Races in Forest Park, Ohio (OH) Detailed Stats
Data:
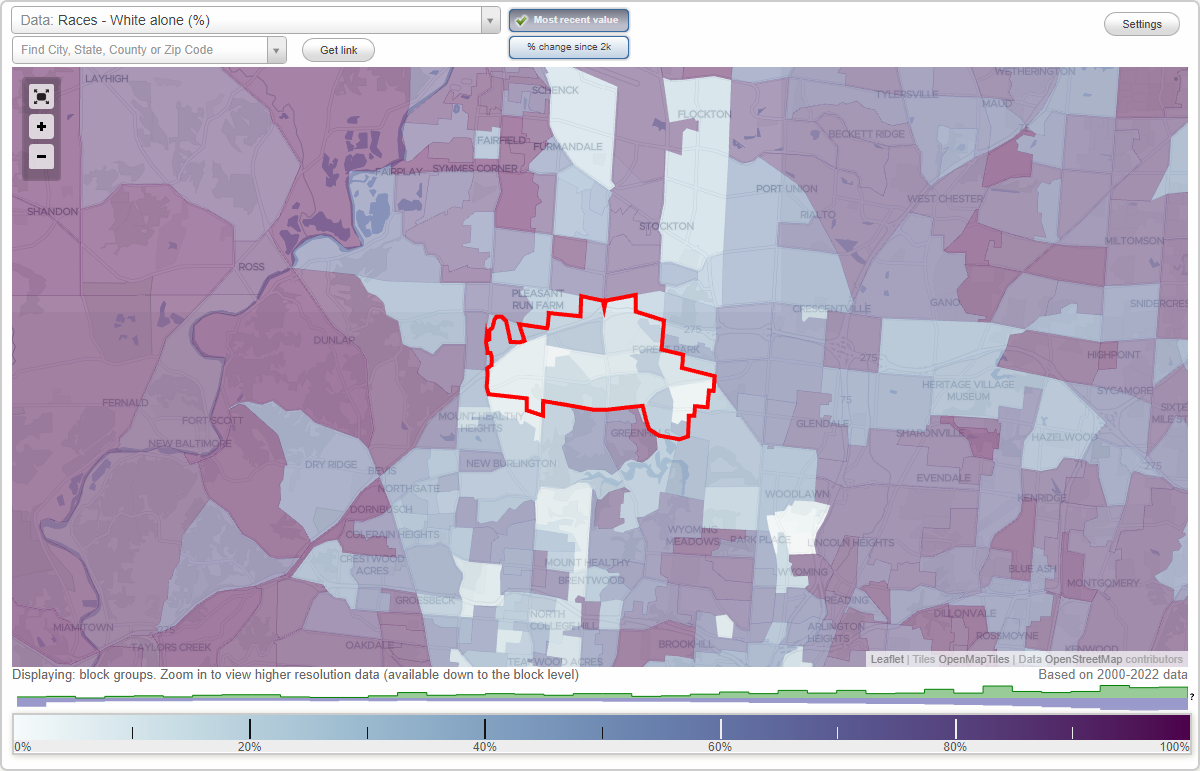
Races - White alone (%)
Races - White alone (% change since 2000)
Races - Black alone (%)
Races - Black alone (% change since 2000)
Races - American Indian alone (%)
Races - American Indian alone (% change since 2000)
Races - Asian alone (%)
Races - Asian alone (% change since 2000)
Races - Hispanic (%)
Races - Hispanic (% change since 2000)
Races - Native Hawaiian and Other Pacific Islander alone (%)
Races - Native Hawaiian and Other Pacific Islander alone (% change since 2000)
Races - Two or more races(%)
Races - Two or more races(% change since 2000)
Races - Other race alone (%)
Races - Other race alone (% change since 2000)
Racial diversity
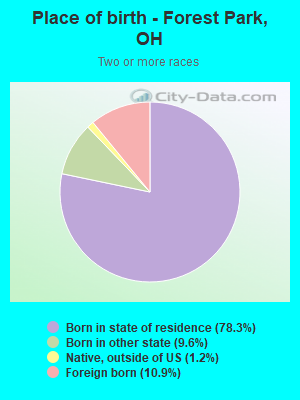
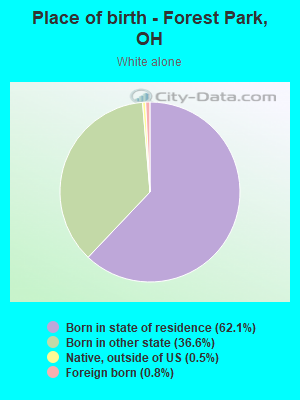
Place of birth - Born in state of residence (%)
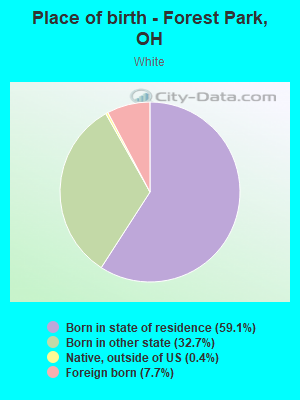
Place of birth - Born in state of residence (%) - White
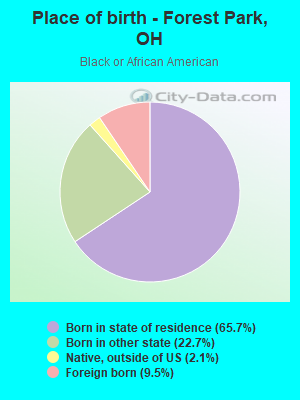
Place of birth - Born in state of residence (%) - Black or African American
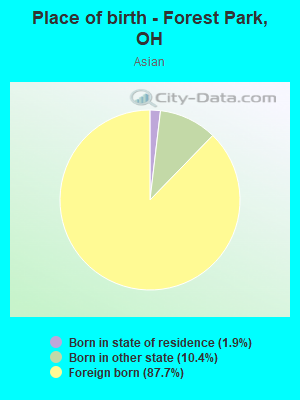
Place of birth - Born in state of residence (%) - Asian
Place of birth - Born in state of residence (%) - Hispanic or Latino
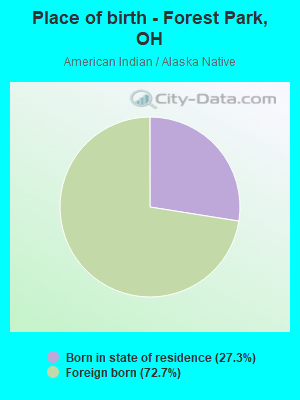
Place of birth - Born in state of residence (%) - American Indian and Alaska Native
Place of birth - Born in state of residence (%) - Multirace
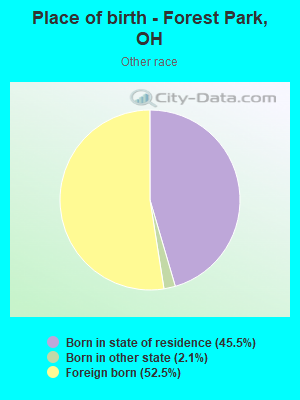
Place of birth - Born in state of residence (%) - Other Race
Place of birth - Born in other state (%)
Place of birth - Born in other state (%) - White
Place of birth - Born in other state (%) - Black or African American
Place of birth - Born in other state (%) - Asian
Place of birth - Born in other state (%) - Hispanic or Latino
Place of birth - Born in other state (%) - American Indian and Alaska Native
Place of birth - Born in other state (%) - Multirace
Place of birth - Born in other state (%) - Other Race
Place of birth - Native, outside of US (%)
Place of birth - Native, outside of US (%) - White
Place of birth - Native, outside of US (%) - Black or African American
Place of birth - Native, outside of US (%) - Asian
Place of birth - Native, outside of US (%) - Hispanic or Latino
Place of birth - Native, outside of US (%) - American Indian and Alaska Native
Place of birth - Native, outside of US (%) - Multirace
Place of birth - Native, outside of US (%) - Other Race
Place of birth - Foreign born (%)
Place of birth - Foreign born (%) - White
Place of birth - Foreign born (%) - Black or African American
Place of birth - Foreign born (%) - Asian
Place of birth - Foreign born (%) - Hispanic or Latino
Place of birth - Foreign born (%) - American Indian and Alaska Native
Place of birth - Foreign born (%) - Multirace
Place of birth - Foreign born (%) - Other Race
Residents speaking English at home (%)
Residents speaking English at home - Born in the United States (%)
Residents speaking English at home - Native, born elsewhere (%)
Residents speaking English at home - Foreign born (%)
Residents speaking Spanish at home (%)
Residents speaking Spanish at home - Born in the United States (%)
Residents speaking Spanish at home - Native, born elsewhere (%)
Residents speaking Spanish at home - Foreign born (%)
Residents speaking other language at home (%)
Residents speaking other language at home - Born in the United States (%)
Residents speaking other language at home - Native, born elsewhere (%)
Residents speaking other language at home - Foreign born (%)
Marital status - Never married (%)
Marital status - Now married (%)
Marital status - Separated (%)
Marital status - Widowed (%)
Marital status - Divorced (%)
Ancestries Reported - Arab (%)
Ancestries Reported - Czech (%)
Ancestries Reported - Danish (%)
Ancestries Reported - Dutch (%)
Ancestries Reported - English (%)
Ancestries Reported - French (%)
Ancestries Reported - French Canadian (%)
Ancestries Reported - German (%)
Ancestries Reported - Greek (%)
Ancestries Reported - Hungarian (%)
Ancestries Reported - Irish (%)
Ancestries Reported - Italian (%)
Ancestries Reported - Lithuanian (%)
Ancestries Reported - Norwegian (%)
Ancestries Reported - Polish (%)
Ancestries Reported - Portuguese (%)
Ancestries Reported - Russian (%)
Ancestries Reported - Scotch-Irish (%)
Ancestries Reported - Scottish (%)
Ancestries Reported - Slovak (%)
Ancestries Reported - Subsaharan African (%)
Ancestries Reported - Swedish (%)
Ancestries Reported - Swiss (%)
Ancestries Reported - Ukrainian (%)
Ancestries Reported - United States (%)
Ancestries Reported - Welsh (%)
Ancestries Reported - West Indian (%)
Ancestries Reported - Other (%)
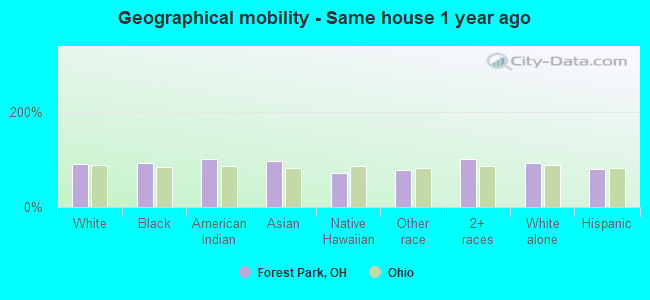
Geographical mobility - Same house 1 year ago (%)
Geographical mobility - Same house 1 year ago (%) - White
Geographical mobility - Same house 1 year ago (%) - Black or African American
Geographical mobility - Same house 1 year ago (%) - Asian
Geographical mobility - Same house 1 year ago (%) - Hispanic or Latino
Geographical mobility - Same house 1 year ago (%) - American Indian and Alaska Native
Geographical mobility - Same house 1 year ago (%) - Multirace
Geographical mobility - Same house 1 year ago (%) - Other Race
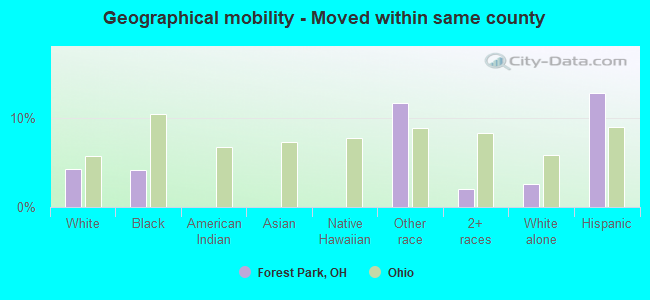
Geographical mobility - Moved within same county (%)
Geographical mobility - Moved within same county (%) - White
Geographical mobility - Moved within same county (%) - Black or African American
Geographical mobility - Moved within same county (%) - Asian
Geographical mobility - Moved within same county (%) - Hispanic or Latino
Geographical mobility - Moved within same county (%) - American Indian and Alaska Native
Geographical mobility - Moved within same county (%) - Multirace
Geographical mobility - Moved within same county (%) - Other Race
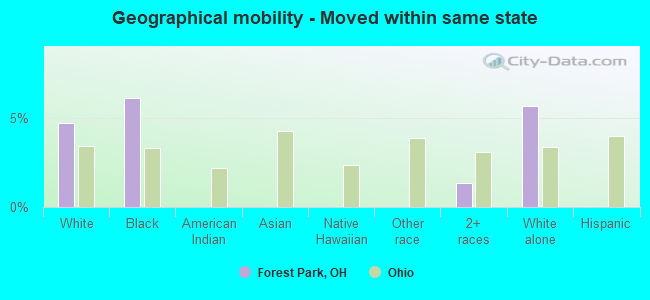
Geographical mobility - Moved from different county within same state (%)
Geographical mobility - Moved from different county within same state (%) - White
Geographical mobility - Moved from different county within same state (%) - Black or African American
Geographical mobility - Moved from different county within same state (%) - Asian
Geographical mobility - Moved from different county within same state (%) - Hispanic or Latino
Geographical mobility - Moved from different county within same state (%) - American Indian and Alaska Native
Geographical mobility - Moved from different county within same state (%) - Multirace
Geographical mobility - Moved from different county within same state (%) - Other Race
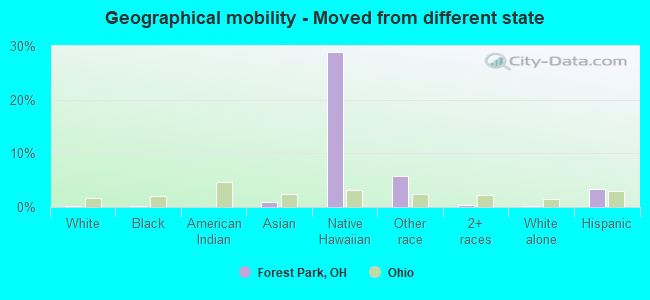
Geographical mobility - Moved from different state (%)
Geographical mobility - Moved from different state (%) - White
Geographical mobility - Moved from different state (%) - Black or African American
Geographical mobility - Moved from different state (%) - Asian
Geographical mobility - Moved from different state (%) - Hispanic or Latino
Geographical mobility - Moved from different state (%) - American Indian and Alaska Native
Geographical mobility - Moved from different state (%) - Multirace
Geographical mobility - Moved from different state (%) - Other Race
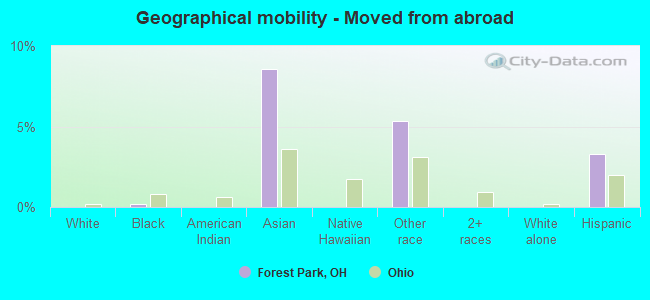
Geographical mobility - Moved from abroad (%)
Geographical mobility - Moved from abroad (%) - White
Geographical mobility - Moved from abroad (%) - Black or African American
Geographical mobility - Moved from abroad (%) - Asian
Geographical mobility - Moved from abroad (%) - Hispanic or Latino
Geographical mobility - Moved from abroad (%) - American Indian and Alaska Native
Geographical mobility - Moved from abroad (%) - Multirace
Geographical mobility - Moved from abroad (%) - Other Race
Place of birth for the foreign-born population - Ireland (%)
Place of birth for the foreign-born population - Denmark (%)
Place of birth for the foreign-born population - Norway (%)
Place of birth for the foreign-born population - Sweden (%)
Place of birth for the foreign-born population - United Kingdom (%)
Place of birth for the foreign-born population - England (%)
Place of birth for the foreign-born population - Scotland (%)
Place of birth for the foreign-born population - Other Northern Europe (%)
Place of birth for the foreign-born population - Austria (%)
Place of birth for the foreign-born population - Belgium (%)
Place of birth for the foreign-born population - France (%)
Place of birth for the foreign-born population - Germany (%)
Place of birth for the foreign-born population - Netherlands (%)
Place of birth for the foreign-born population - Switzerland (%)
Place of birth for the foreign-born population - Other Western Europe (%)
Place of birth for the foreign-born population - Greece (%)
Place of birth for the foreign-born population - Italy (%)
Place of birth for the foreign-born population - Portugal (%)
Place of birth for the foreign-born population - Spain (%)
Place of birth for the foreign-born population - Other Southern Europe (%)
Place of birth for the foreign-born population - Albania (%)
Place of birth for the foreign-born population - Belarus (%)
Place of birth for the foreign-born population - Bosnia and Herzegovina (%)
Place of birth for the foreign-born population - Bulgaria (%)
Place of birth for the foreign-born population - Croatia (%)
Place of birth for the foreign-born population - Czechoslovakia (%)
Place of birth for the foreign-born population - Hungary (%)
Place of birth for the foreign-born population - Latvia (%)
Place of birth for the foreign-born population - Lithuania (%)
Place of birth for the foreign-born population - North Macedonia (Macedonia) (%)
Place of birth for the foreign-born population - Moldova (%)
Place of birth for the foreign-born population - Poland (%)
Place of birth for the foreign-born population - Romania (%)
Place of birth for the foreign-born population - Russia (%)
Place of birth for the foreign-born population - Serbia (%)
Place of birth for the foreign-born population - Ukraine (%)
Place of birth for the foreign-born population - Other Eastern Europe (%)
Place of birth for the foreign-born population - China (%)
Place of birth for the foreign-born population - Hong Kong (%)
Place of birth for the foreign-born population - Taiwan (%)
Place of birth for the foreign-born population - Japan (%)
Place of birth for the foreign-born population - Korea (%)
Place of birth for the foreign-born population - Other Eastern Asia (%)
Place of birth for the foreign-born population - Afghanistan (%)
Place of birth for the foreign-born population - Bangladesh (%)
Place of birth for the foreign-born population - India (%)
Place of birth for the foreign-born population - Iran (%)
Place of birth for the foreign-born population - Kazakhstan (%)
Place of birth for the foreign-born population - Nepal (%)
Place of birth for the foreign-born population - Pakistan (%)
Place of birth for the foreign-born population - Sri Lanka (%)
Place of birth for the foreign-born population - Uzbekistan (%)
Place of birth for the foreign-born population - Other South Central Asia (%)
Place of birth for the foreign-born population - Burma (%)
Place of birth for the foreign-born population - Cambodia (%)
Place of birth for the foreign-born population - Indonesia (%)
Place of birth for the foreign-born population - Laos (%)
Place of birth for the foreign-born population - Malaysia (%)
Place of birth for the foreign-born population - Philippines (%)
Place of birth for the foreign-born population - Singapore (%)
Place of birth for the foreign-born population - Thailand (%)
Place of birth for the foreign-born population - Vietnam (%)
Place of birth for the foreign-born population - Other South Eastern Asia (%)
Place of birth for the foreign-born population - Armenia (%)
Place of birth for the foreign-born population - Iraq (%)
Place of birth for the foreign-born population - Israel (%)
Place of birth for the foreign-born population - Jordan (%)
Place of birth for the foreign-born population - Kuwait (%)
Place of birth for the foreign-born population - Lebanon (%)
Place of birth for the foreign-born population - Saudi Arabia (%)
Place of birth for the foreign-born population - Syria (%)
Place of birth for the foreign-born population - Turkey (%)
Place of birth for the foreign-born population - Yemen (%)
Place of birth for the foreign-born population - Other Western Asia (%)
Place of birth for the foreign-born population - Eritrea (%)
Place of birth for the foreign-born population - Ethiopia (%)
Place of birth for the foreign-born population - Kenya (%)
Place of birth for the foreign-born population - Somalia (%)
Place of birth for the foreign-born population - Uganda (%)
Place of birth for the foreign-born population - Zimbabwe (%)
Place of birth for the foreign-born population - Other Eastern Africa (%)
Place of birth for the foreign-born population - Cameroon (%)
Place of birth for the foreign-born population - Congo (%)
Place of birth for the foreign-born population - Democratic Republic of Congo (Zaire) (%)
Place of birth for the foreign-born population - Other Middle Africa (%)
Place of birth for the foreign-born population - Egypt (%)
Place of birth for the foreign-born population - Morocco (%)
Place of birth for the foreign-born population - Sudan (%)
Place of birth for the foreign-born population - Other Northern Africa (%)
Place of birth for the foreign-born population - South Africa (%)
Place of birth for the foreign-born population - Other Southern Africa (%)
Place of birth for the foreign-born population - Cabo Verde (%)
Place of birth for the foreign-born population - Ghana (%)
Place of birth for the foreign-born population - Liberia (%)
Place of birth for the foreign-born population - Nigeria (%)
Place of birth for the foreign-born population - Senegal (%)
Place of birth for the foreign-born population - Sierra Leone (%)
Place of birth for the foreign-born population - Other Western Africa (%)
Place of birth for the foreign-born population - Australia (%)
Place of birth for the foreign-born population - New Zealand (%)
Place of birth for the foreign-born population - Fiji (%)
Place of birth for the foreign-born population - Micronesia (%)
Place of birth for the foreign-born population - Bahamas (%)
Place of birth for the foreign-born population - Barbados (%)
Place of birth for the foreign-born population - Cuba (%)
Place of birth for the foreign-born population - Dominica (%)
Place of birth for the foreign-born population - Dominican Republic (%)
Place of birth for the foreign-born population - Grenada (%)
Place of birth for the foreign-born population - Haiti (%)
Place of birth for the foreign-born population - Jamaica (%)
Place of birth for the foreign-born population - St. Vincent and the Grenadines (%)
Place of birth for the foreign-born population - Trinidad and Tobago (%)
Place of birth for the foreign-born population - West Indies (%)
Place of birth for the foreign-born population - Other Caribbean (%)
Place of birth for the foreign-born population - Belize (%)
Place of birth for the foreign-born population - Costa Rica (%)
Place of birth for the foreign-born population - El Salvador (%)
Place of birth for the foreign-born population - Guatemala (%)
Place of birth for the foreign-born population - Honduras (%)
Place of birth for the foreign-born population - Mexico (%)
Place of birth for the foreign-born population - Nicaragua (%)
Place of birth for the foreign-born population - Panama (%)
Place of birth for the foreign-born population - Other Central America (%)
Place of birth for the foreign-born population - Argentina (%)
Place of birth for the foreign-born population - Bolivia (%)
Place of birth for the foreign-born population - Brazil (%)
Place of birth for the foreign-born population - Chile (%)
Place of birth for the foreign-born population - Colombia (%)
Place of birth for the foreign-born population - Ecuador (%)
Place of birth for the foreign-born population - Guyana (%)
Place of birth for the foreign-born population - Peru (%)
Place of birth for the foreign-born population - Uruguay (%)
Place of birth for the foreign-born population - Venezuela (%)
Place of birth for the foreign-born population - Other South America (%)
Place of birth for the foreign-born population - Canada (%)
Place of birth for the foreign-born population - Other Northern America (%)
Place of birth for the foreign-born population - Other (%)
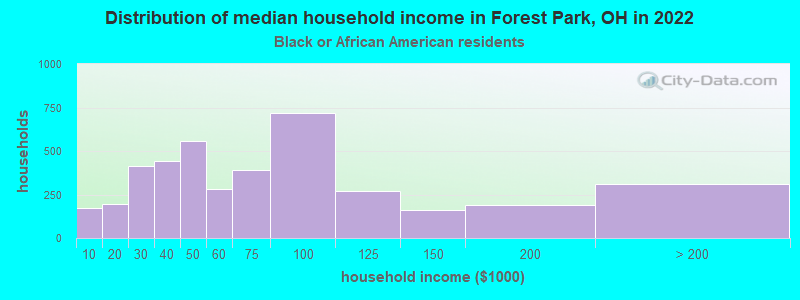
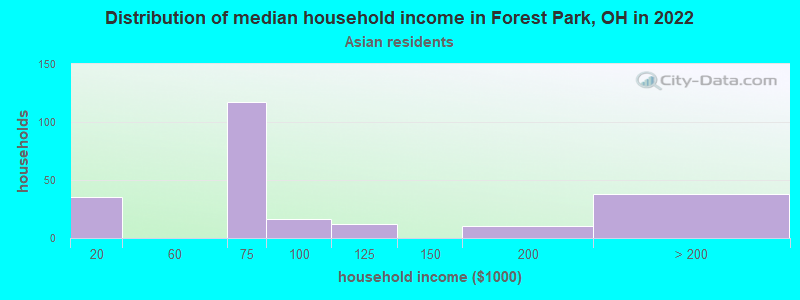
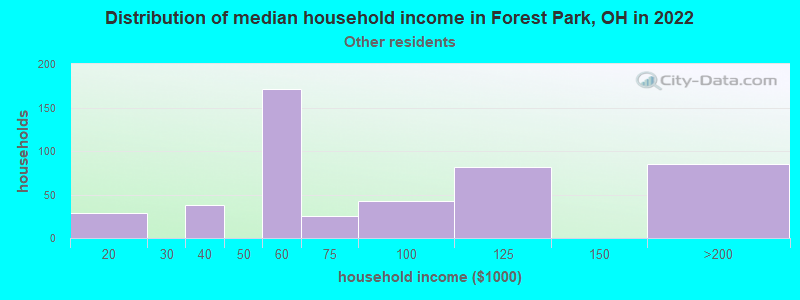
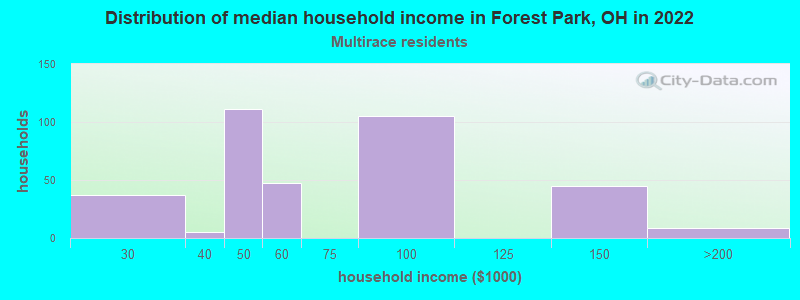
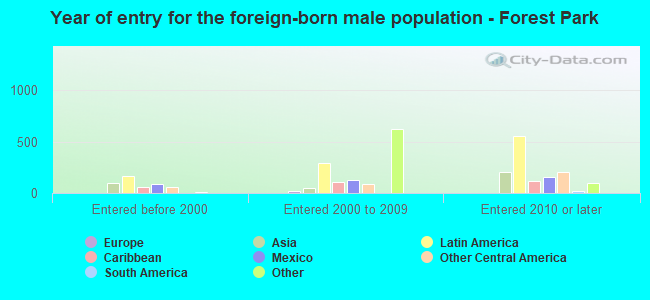
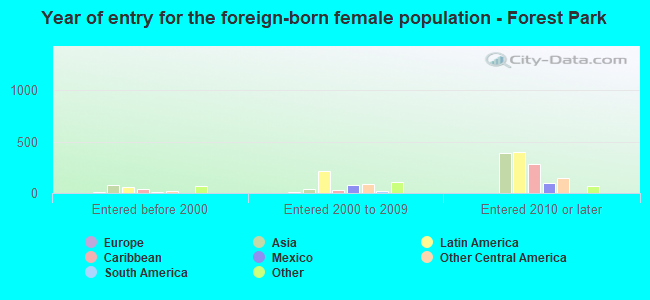
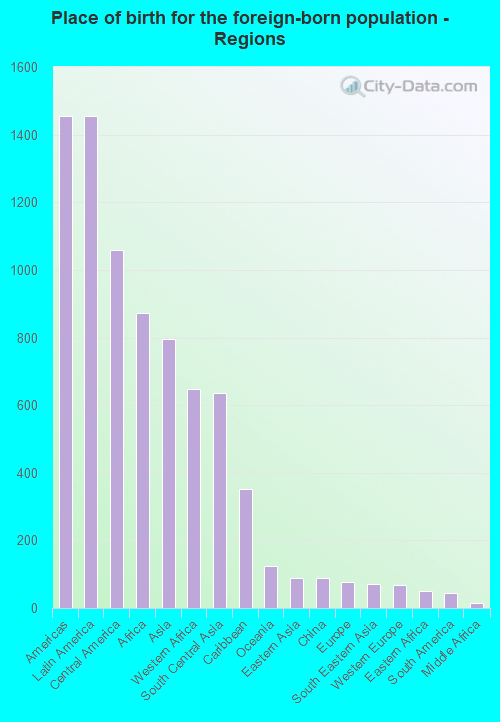
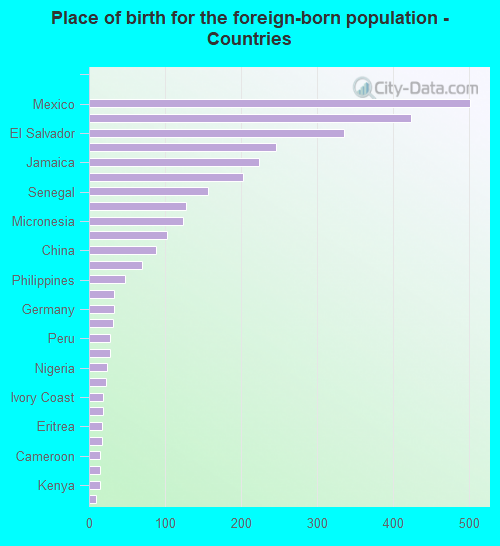
According to 2022 data, the most numerous races in Forest Park, OH are White alone (4,532 residents), Black alone (10,638 residents), and Two or more races (1,111 residents). 81.8% of Forest Park residents speak English at home. 16.7% of Forest Park, OH residents are foreign-born (7.1% born in Latin America, 4.3% born in Africa, 3.9% born in Asia), which is 76.0% greater than the foreign-born rate of 4.0% across the entire state of Ohio.
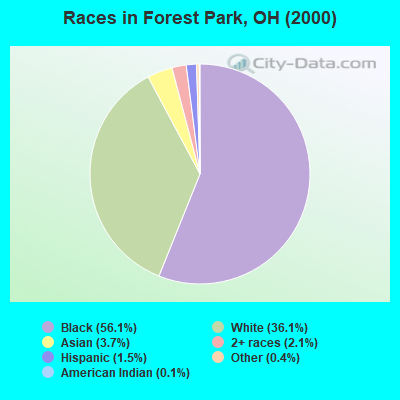
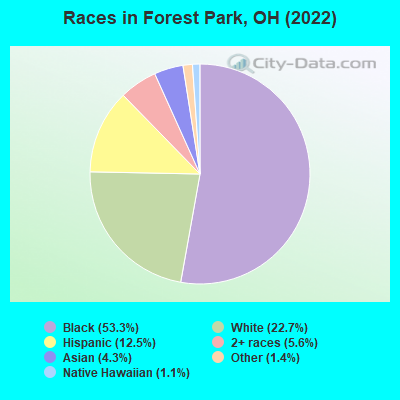
Race distribution in Forest Park
2000 2022
9,538,111 84.0% White alone 1,290,662 11.4% Black alone 217,123 1.9% Hispanic 137,770 1.2% Two or more races 131,670 1.2% Asian alone 21,985 0.2% American Indian alone 13,483 0.1% Other race alone 2,336 0.02% Native Hawaiian and Other
8,948,793 76.1% White alone 1,401,403 11.9% Black alone 529,291 4.5% Two or more races 517,232 4.4% Hispanic 293,387 2.5% Asian alone 52,805 0.4% Other race alone 9,785 0.08% American Indian alone 3,362 0.03% Native Hawaiian and Other
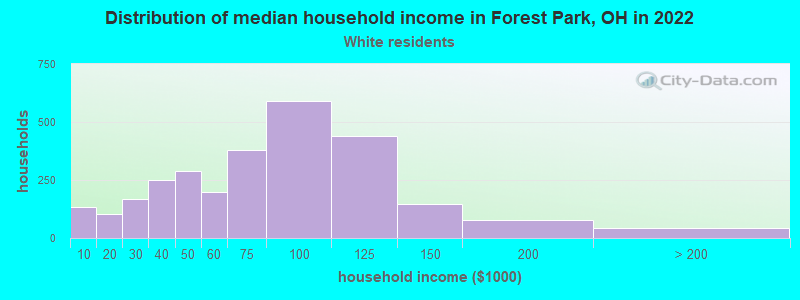
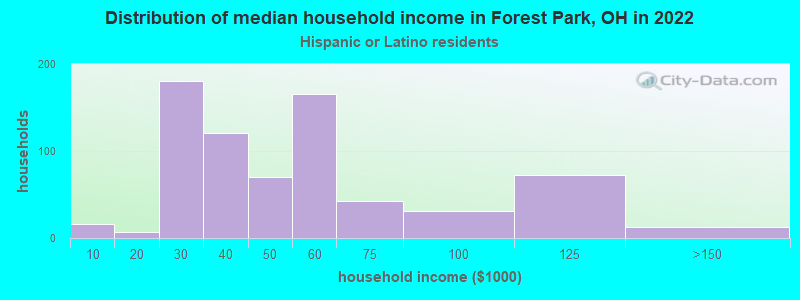
Income and house value in Forest Park Median household income in 2022 $73,957 White non-Hispanic householders$53,553 Black householders$66,868 Asian householders$44,269 Some other race householders$59,873 Two or more races householders$44,394 Hispanic or Latino race householdersMedian 2022 house value $161,452 White Non-Hispanic householders$175,588 Black or African American householders $157,535 Asian householders$157,024 Two or more races householders$205,732 Hispanic or Latino householders
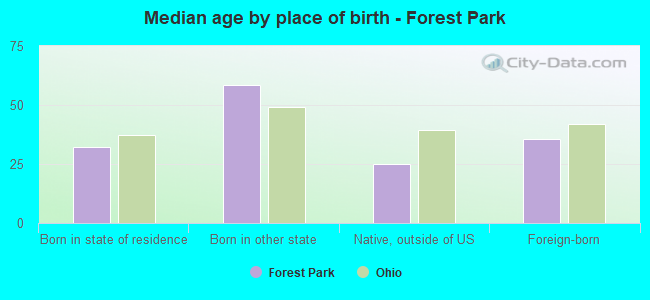
Median age by race in Forest Park
49.1 Median age for White residents40.7 49.7 41.5 Median age for Black or African American residents39.0 43.0 -666,666,666.0 Median age for American Indian / Alaska Native residents-622,116,148.9 -871,212,120.3 39.3 Median age for Asian residents38.8 39.8 42.1 Median age for Native Hawaiian / Pacific Islander residents-750,242,953.6 13.7 21.9 Median age for Other race residents26.5 15.3 17.9 Median age for Two or more races residents16.8 25.6 52.9 Median age for White alone residents53.3 52.6 28.3 Median age for Hispanic or Latino residents29.2 28.2
Owner/renter occupied households by race in Forest Park
House owners and renters - White residents 1,673 59.8% Owner occupied1,127 40.2% Renter occupiedHouse owners and renters - Black or African American residents 2,535 59.6% Owner occupied1,719 40.4% Renter occupiedHouse owners and renters - American Indian / Alaska Native residents 3 100.0% Owner occupiedHouse owners and renters - Asian residents 87 46.8% Owner occupied99 53.2% Renter occupiedHouse owners and renters - Native Hawaiian / Pacific Islander residents 89 100.0% Renter occupiedHouse owners and renters - Other race residents 134 34.5% Owner occupied254 65.5% Renter occupiedHouse owners and renters - Two or more races residents 207 57.6% Owner occupied153 42.4% Renter occupiedHouse owners and renters - White alone residents 1,589 62.6% Owner occupied948 37.4% Renter occupiedHouse owners and renters - Hispanic or Latino residents 239 32.4% Owner occupied499 67.6% Renter occupied
Language usage in Forest Park
English speakers - Total 81.8% of residents of Forest Park speak English at home.
10.0% of residents speak Spanish at home 976 51.1% Speak English very well934 48.9% Speak English less than very well8.6% of residents speak other language at home 705 43.0% Speak English very well934 57.0% Speak English less than very well
English speakers - Born in the United States 94.6% of residents of Forest Park speak English at home.
3.4% of residents speak Spanish at home 101 66.9% Speak English very well50 33.1% Speak English less than very well2.0% of residents speak other language at home 62 68.1% Speak English very well29 31.9% Speak English less than very well
English speakers - Native, born elsewhere 87.6% of residents of Forest Park speak English at home.
16.1% of residents speak other language at home 39 100.0% Speak English very well
English speakers - Foreign-born 20.7% of residents of Forest Park speak English at home.
37.1% of residents speak Spanish at home 431 35.6% Speak English very well780 64.4% Speak English less than very well42.0% of residents speak other language at home 572 41.7% Speak English very well799 58.3% Speak English less than very well
White (Caucasian) - Speak only English Native:
91.4% (4,365)Foreign-born:
14.5% (61)
White (Caucasian) - Speak another language Native:
8.5% (406)Foreign-born:
81.4% (340)
Black or African American - Speak only English Native:
99.8% (9,469)Foreign-born:
41.1% (406)
Black or African American - Speak another language Native:
0.3% (30)Foreign-born:
62.4% (617)
Asian - Speak another language Native:
82.1% (51)Foreign-born:
73.3% (588)
Native Hawaiian / Pacific Islander - Speak another language Native:
100.0% (40)Foreign-born:
100.0% (125)
Other race - Speak only English Native:
54.2% (262)Foreign-born:
2.0% (16)
Other race - Speak another language Native:
50.0% (241)Foreign-born:
99.7% (812)
Two or more races - Speak another language Native:
16.4% (185)Foreign-born:
96.5% (152)
White alone - Speak only English Native:
97.1% (4,344)Foreign-born:
55.2% (19)
White alone - Speak another language Native:
3.1% (139)Foreign-born:
45.9% (16)
Hispanic or Latino - Speak only English Native:
24.0% (187)Foreign-born:
3.3% (44)
Hispanic or Latino - Speak another language Native:
86.2% (669)Foreign-born:
98.5% (1,298)
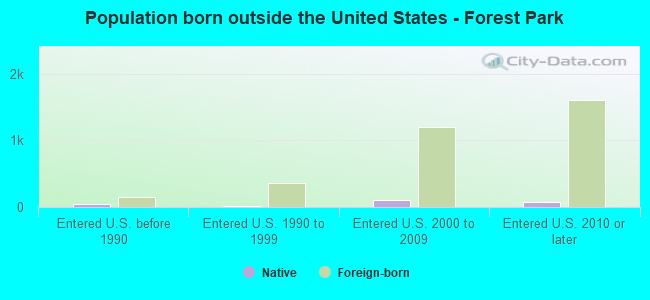
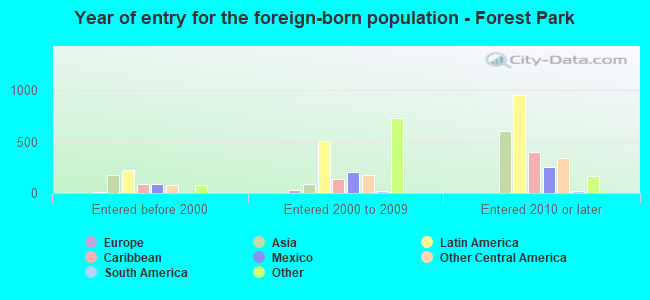
Foreign-born residents in Forest Park 3,322 residents are foreign born (7.1% Latin America , 4.3% Africa , 3.9% Asia ).
Marital status for residents in Forest Park Marital status - White (Caucasian) population 15 years and over
Males 41.8% Never married39.7% Now married1.1% Separated2.7% Widowed14.7% DivorcedFemales 21.8% Never married46.4% Now married2.4% Separated7.0% Widowed22.4% DivorcedWomen who gave birth in the past 12 months Now married:
100.0% (41)Unmarried:
0.0% (0)
Women who did not give birth in the past 12 months Now married:
37.3% (465)Unmarried:
62.7% (780)
Marital status - Black or African American population 15 years and over
Males 49.2% Never married34.7% Now married2.0% Separated3.8% Widowed10.4% DivorcedFemales 43.8% Never married30.4% Now married3.1% Separated9.6% Widowed13.1% DivorcedWomen who gave birth in the past 12 months Now married:
100.0% (20)Unmarried:
0.0% (0)
Women who did not give birth in the past 12 months Now married:
18.9% (498)Unmarried:
81.1% (2,134)
Marital status - American Indian / Alaska Native population 15 years and over
Males 0.0% Never married100.0% Now married0.0% Separated0.0% Widowed0.0% DivorcedFemales 100.0% Never married0.0% Now married0.0% Separated0.0% Widowed0.0% DivorcedWomen who did not give birth in the past 12 months Now married:
0.0% (0)Unmarried:
100.0% (7)
Marital status - Asian population 15 years and over
Males 51.4% Never married40.4% Now married0.0% Separated0.0% Widowed8.2% DivorcedFemales 29.4% Never married70.6% Now married0.0% Separated0.0% Widowed0.0% DivorcedWomen who did not give birth in the past 12 months Now married:
55.3% (130)Unmarried:
44.7% (105)
Marital status - Native Hawaiian / Pacific Islander population 15 years and over
Males 0.0% Never married100.0% Now married0.0% Separated0.0% Widowed0.0% DivorcedFemales 0.0% Never married100.0% Now married0.0% Separated0.0% Widowed0.0% DivorcedWomen who did not give birth in the past 12 months Now married:
100.0% (72)Unmarried:
0.0% (0)
Marital status - Other race population 15 years and over
Males 66.8% Never married24.4% Now married0.0% Separated2.7% Widowed6.1% DivorcedFemales 80.0% Never married15.1% Now married0.0% Separated4.9% Widowed0.0% DivorcedWomen who gave birth in the past 12 months Now married:
29.1% (30)Unmarried:
70.9% (73)
Women who did not give birth in the past 12 months Now married:
7.7% (26)Unmarried:
92.3% (313)
Marital status - Two or more races population 15 years and over
Males 62.4% Never married32.4% Now married0.0% Separated0.9% Widowed4.3% DivorcedFemales 45.3% Never married28.0% Now married0.0% Separated1.2% Widowed25.5% DivorcedWomen who did not give birth in the past 12 months Now married:
28.1% (101)Unmarried:
71.9% (259)
Marital status - White alone, not Hispanic / Latino population 15 years and over
Males 40.4% Never married38.2% Now married1.3% Separated3.1% Widowed17.0% DivorcedFemales 21.2% Never married44.1% Now married2.6% Separated7.6% Widowed24.4% DivorcedWomen who gave birth in the past 12 months Now married:
100.0% (16)Unmarried:
0.0% (0)
Women who did not give birth in the past 12 months Now married:
33.6% (368)Unmarried:
66.4% (726)
Marital status - Hispanic or Latino population 15 years and over
Males 58.0% Never married34.9% Now married0.0% Separated1.5% Widowed5.5% DivorcedFemales 49.7% Never married42.7% Now married0.0% Separated0.0% Widowed7.5% DivorcedWomen who gave birth in the past 12 months Now married:
46.7% (54)Unmarried:
53.3% (62)
Women who did not give birth in the past 12 months Now married:
39.5% (136)Unmarried:
60.5% (208)
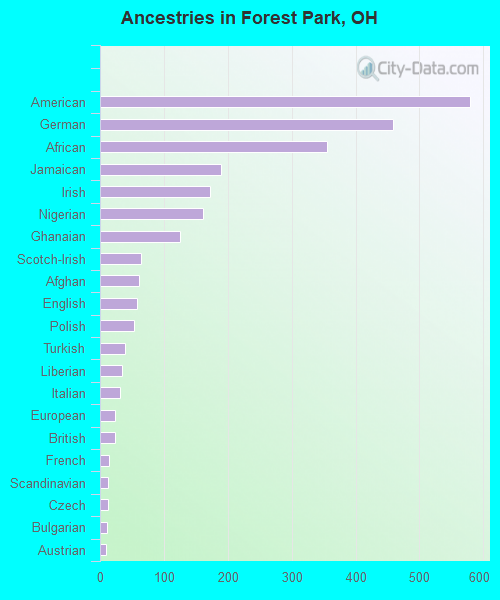
Ancestries in Forest Park
580 4.8% American459 3.8% German356 3.0% African189 1.6% Jamaican172 1.4% Irish162 1.4% Nigerian126 1.1% Ghanaian64 0.5% Scotch-Irish61 0.5% Afghan58 0.5% English53 0.4% Polish39 0.3% Turkish34 0.3% Liberian31 0.3% Italian24 0.2% European23 0.2% British14 0.1% French13 0.1% Scandinavian12 0.1% Czech11 0.09% Bulgarian9 0.08% Austrian
Geographical mobility in Forest Park Same house 1 year ago 4,853 91.3% White (Caucasian)9,879 92.5% Black or African American12 100.0% American Indian / Alaska Native839 96.2% Asian178 71.7% Native Hawaiian / Pacific Islander1,210 77.3% Other race1,412 100.0% Two or more races4,204 92.6% White alone, not Hispanic / Latino1,913 80.4% Hispanic or LatinoMoved within same county 224 4.2% White / Caucasian439 4.1% Black or African American182 11.6% Other race28 2.0% Two or more races117 2.6% White alone, not Hispanic / Latino303 12.7% Hispanic or LatinoMoved within same state 251 4.7% White / Caucasian652 6.1% Black or African American19 1.4% Two or more races257 5.7% White alone, not Hispanic / LatinoMoved from different state 9 0.2% White / Caucasian28 0.3% Black or African American8 0.9% Asian72 28.9% Native Hawaiian / Pacific Islander89 5.7% Other race6 0.4% Two or more races9 0.2% White alone, not Hispanic / Latino79 3.3% Hispanic or LatinoMoved from abroad 17 0.2% Black or African American75 8.6% Asian83 5.3% Other race79 3.3% Hispanic or Latino
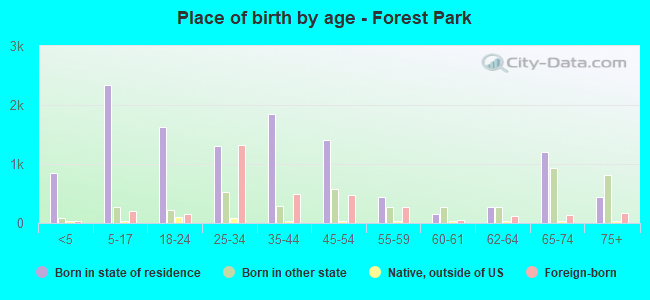
Children Nativity (place of birth) in Forest Park
Children under 6 years - Living with two parents Both parents native 22 100.0% NativeBoth parents foreign-born 230 100.0% NativeOne native, one foreign-born parent 66 100.0% NativeChildren under 6 years - Living with one parent Native parent 537 100.0% NativeForeign-born parent 108 84.2% Native20 15.8% Foreign-bornChildren 6 to 17 years - Living with two parents Both parents native 201 100.0% NativeBoth parents foreign-born 532 86.1% Native86 13.9% Foreign-bornOne native, one foreign-born parent 240 100.0% NativeChildren 6 to 17 years - Living with one parent Native parent 1,155 93.9% Native75 6.1% Foreign-bornForeign-born parent 115 77.4% Native34 22.6% Foreign-born
Grandparents responsible for own grandchildren in Forest Park
Grandparents (30 to 59 years) White / Caucasian 29 100.0% Responsible for grandchildrenBlack or African American 15 52.2% Responsible for grandchildren13 47.8% Not responsible for grandchildrenWhite alone, not Hispanic / Latino 20 100.0% Responsible for grandchildrenGrandparents (60 years and over) White / Caucasian 11 100.0% Not responsible for grandchildrenBlack or African American 92 33.7% Responsible for grandchildren181 66.3% Not responsible for grandchildrenWhite alone, not Hispanic / Latino 11 100.0% Not responsible for grandchildren