Races in Granite Bay, California (CA) Detailed Stats
Data:
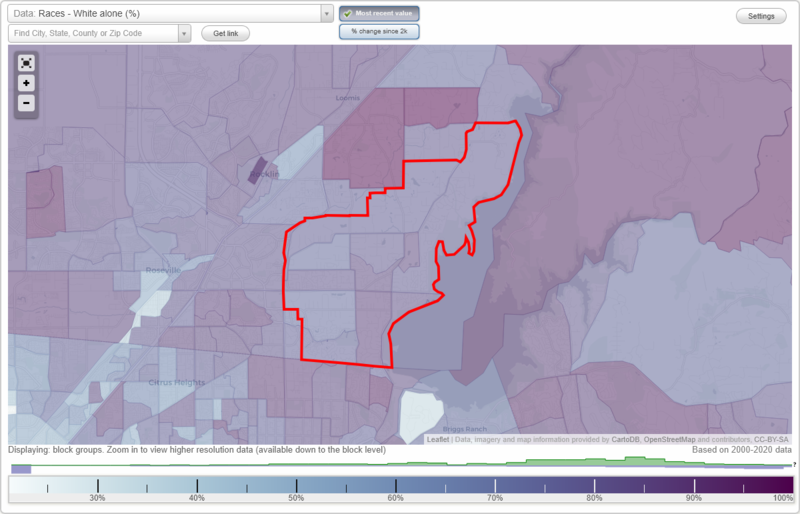
Races - White alone (%)
Races - White alone (% change since 2000)
Races - Black alone (%)
Races - Black alone (% change since 2000)
Races - American Indian alone (%)
Races - American Indian alone (% change since 2000)
Races - Asian alone (%)
Races - Asian alone (% change since 2000)
Races - Hispanic (%)
Races - Hispanic (% change since 2000)
Races - Native Hawaiian and Other Pacific Islander alone (%)
Races - Native Hawaiian and Other Pacific Islander alone (% change since 2000)
Races - Two or more races(%)
Races - Two or more races(% change since 2000)
Races - Other race alone (%)
Races - Other race alone (% change since 2000)
Racial diversity
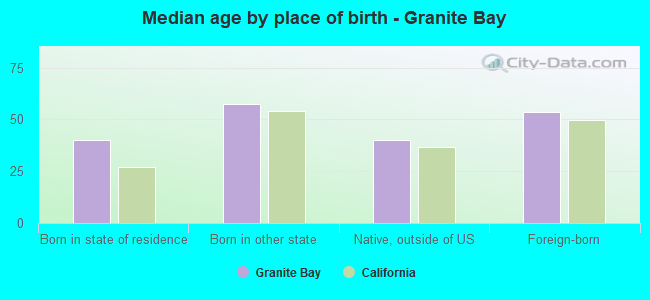
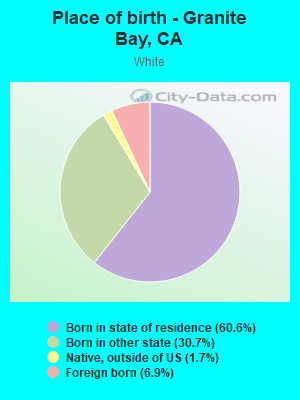
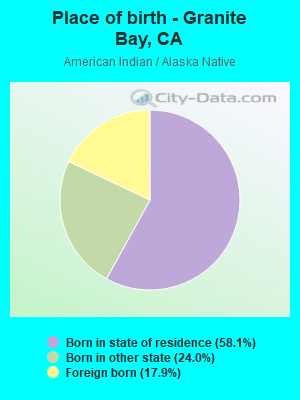
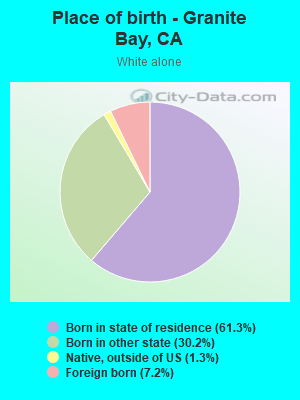
Place of birth - Born in state of residence (%)
Place of birth - Born in state of residence (%) - White
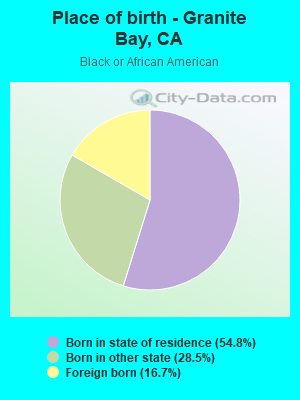
Place of birth - Born in state of residence (%) - Black or African American
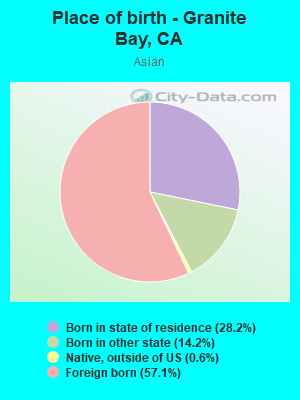
Place of birth - Born in state of residence (%) - Asian
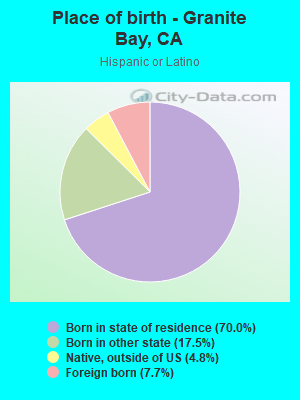
Place of birth - Born in state of residence (%) - Hispanic or Latino
Place of birth - Born in state of residence (%) - American Indian and Alaska Native
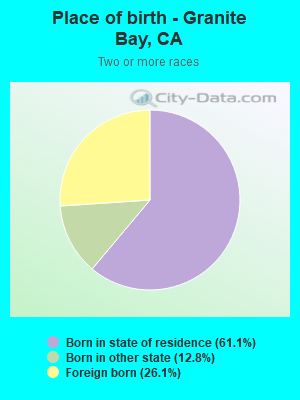
Place of birth - Born in state of residence (%) - Multirace
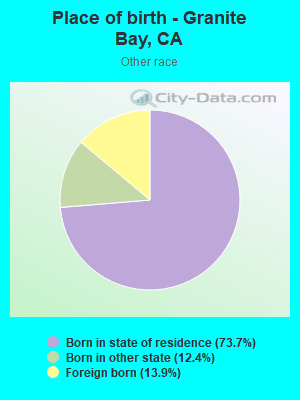
Place of birth - Born in state of residence (%) - Other Race
Place of birth - Born in other state (%)
Place of birth - Born in other state (%) - White
Place of birth - Born in other state (%) - Black or African American
Place of birth - Born in other state (%) - Asian
Place of birth - Born in other state (%) - Hispanic or Latino
Place of birth - Born in other state (%) - American Indian and Alaska Native
Place of birth - Born in other state (%) - Multirace
Place of birth - Born in other state (%) - Other Race
Place of birth - Native, outside of US (%)
Place of birth - Native, outside of US (%) - White
Place of birth - Native, outside of US (%) - Black or African American
Place of birth - Native, outside of US (%) - Asian
Place of birth - Native, outside of US (%) - Hispanic or Latino
Place of birth - Native, outside of US (%) - American Indian and Alaska Native
Place of birth - Native, outside of US (%) - Multirace
Place of birth - Native, outside of US (%) - Other Race
Place of birth - Foreign born (%)
Place of birth - Foreign born (%) - White
Place of birth - Foreign born (%) - Black or African American
Place of birth - Foreign born (%) - Asian
Place of birth - Foreign born (%) - Hispanic or Latino
Place of birth - Foreign born (%) - American Indian and Alaska Native
Place of birth - Foreign born (%) - Multirace
Place of birth - Foreign born (%) - Other Race
Residents speaking English at home (%)
Residents speaking English at home - Born in the United States (%)
Residents speaking English at home - Native, born elsewhere (%)
Residents speaking English at home - Foreign born (%)
Residents speaking Spanish at home (%)
Residents speaking Spanish at home - Born in the United States (%)
Residents speaking Spanish at home - Native, born elsewhere (%)
Residents speaking Spanish at home - Foreign born (%)
Residents speaking other language at home (%)
Residents speaking other language at home - Born in the United States (%)
Residents speaking other language at home - Native, born elsewhere (%)
Residents speaking other language at home - Foreign born (%)
Marital status - Never married (%)
Marital status - Now married (%)
Marital status - Separated (%)
Marital status - Widowed (%)
Marital status - Divorced (%)
Ancestries Reported - Arab (%)
Ancestries Reported - Czech (%)
Ancestries Reported - Danish (%)
Ancestries Reported - Dutch (%)
Ancestries Reported - English (%)
Ancestries Reported - French (%)
Ancestries Reported - French Canadian (%)
Ancestries Reported - German (%)
Ancestries Reported - Greek (%)
Ancestries Reported - Hungarian (%)
Ancestries Reported - Irish (%)
Ancestries Reported - Italian (%)
Ancestries Reported - Lithuanian (%)
Ancestries Reported - Norwegian (%)
Ancestries Reported - Polish (%)
Ancestries Reported - Portuguese (%)
Ancestries Reported - Russian (%)
Ancestries Reported - Scotch-Irish (%)
Ancestries Reported - Scottish (%)
Ancestries Reported - Slovak (%)
Ancestries Reported - Subsaharan African (%)
Ancestries Reported - Swedish (%)
Ancestries Reported - Swiss (%)
Ancestries Reported - Ukrainian (%)
Ancestries Reported - United States (%)
Ancestries Reported - Welsh (%)
Ancestries Reported - West Indian (%)
Ancestries Reported - Other (%)
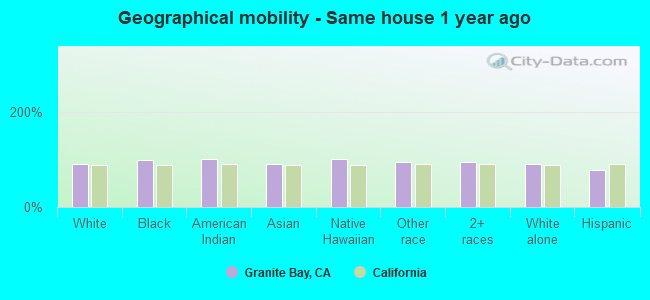
Geographical mobility - Same house 1 year ago (%)
Geographical mobility - Same house 1 year ago (%) - White
Geographical mobility - Same house 1 year ago (%) - Black or African American
Geographical mobility - Same house 1 year ago (%) - Asian
Geographical mobility - Same house 1 year ago (%) - Hispanic or Latino
Geographical mobility - Same house 1 year ago (%) - American Indian and Alaska Native
Geographical mobility - Same house 1 year ago (%) - Multirace
Geographical mobility - Same house 1 year ago (%) - Other Race
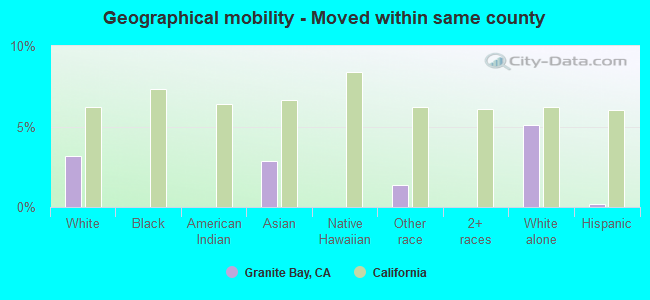
Geographical mobility - Moved within same county (%)
Geographical mobility - Moved within same county (%) - White
Geographical mobility - Moved within same county (%) - Black or African American
Geographical mobility - Moved within same county (%) - Asian
Geographical mobility - Moved within same county (%) - Hispanic or Latino
Geographical mobility - Moved within same county (%) - American Indian and Alaska Native
Geographical mobility - Moved within same county (%) - Multirace
Geographical mobility - Moved within same county (%) - Other Race
Geographical mobility - Moved from different county within same state (%)
Geographical mobility - Moved from different county within same state (%) - White
Geographical mobility - Moved from different county within same state (%) - Black or African American
Geographical mobility - Moved from different county within same state (%) - Asian
Geographical mobility - Moved from different county within same state (%) - Hispanic or Latino
Geographical mobility - Moved from different county within same state (%) - American Indian and Alaska Native
Geographical mobility - Moved from different county within same state (%) - Multirace
Geographical mobility - Moved from different county within same state (%) - Other Race
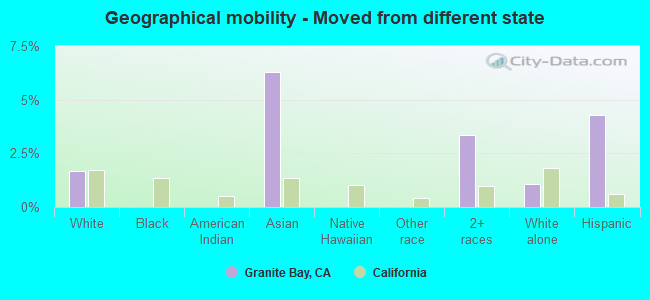
Geographical mobility - Moved from different state (%)
Geographical mobility - Moved from different state (%) - White
Geographical mobility - Moved from different state (%) - Black or African American
Geographical mobility - Moved from different state (%) - Asian
Geographical mobility - Moved from different state (%) - Hispanic or Latino
Geographical mobility - Moved from different state (%) - American Indian and Alaska Native
Geographical mobility - Moved from different state (%) - Multirace
Geographical mobility - Moved from different state (%) - Other Race
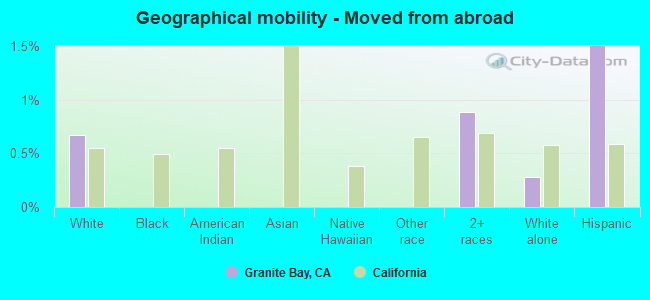
Geographical mobility - Moved from abroad (%)
Geographical mobility - Moved from abroad (%) - White
Geographical mobility - Moved from abroad (%) - Black or African American
Geographical mobility - Moved from abroad (%) - Asian
Geographical mobility - Moved from abroad (%) - Hispanic or Latino
Geographical mobility - Moved from abroad (%) - American Indian and Alaska Native
Geographical mobility - Moved from abroad (%) - Multirace
Geographical mobility - Moved from abroad (%) - Other Race
Place of birth for the foreign-born population - Ireland (%)
Place of birth for the foreign-born population - Denmark (%)
Place of birth for the foreign-born population - Norway (%)
Place of birth for the foreign-born population - Sweden (%)
Place of birth for the foreign-born population - United Kingdom (%)
Place of birth for the foreign-born population - England (%)
Place of birth for the foreign-born population - Scotland (%)
Place of birth for the foreign-born population - Other Northern Europe (%)
Place of birth for the foreign-born population - Austria (%)
Place of birth for the foreign-born population - Belgium (%)
Place of birth for the foreign-born population - France (%)
Place of birth for the foreign-born population - Germany (%)
Place of birth for the foreign-born population - Netherlands (%)
Place of birth for the foreign-born population - Switzerland (%)
Place of birth for the foreign-born population - Other Western Europe (%)
Place of birth for the foreign-born population - Greece (%)
Place of birth for the foreign-born population - Italy (%)
Place of birth for the foreign-born population - Portugal (%)
Place of birth for the foreign-born population - Spain (%)
Place of birth for the foreign-born population - Other Southern Europe (%)
Place of birth for the foreign-born population - Albania (%)
Place of birth for the foreign-born population - Belarus (%)
Place of birth for the foreign-born population - Bosnia and Herzegovina (%)
Place of birth for the foreign-born population - Bulgaria (%)
Place of birth for the foreign-born population - Croatia (%)
Place of birth for the foreign-born population - Czechoslovakia (%)
Place of birth for the foreign-born population - Hungary (%)
Place of birth for the foreign-born population - Latvia (%)
Place of birth for the foreign-born population - Lithuania (%)
Place of birth for the foreign-born population - North Macedonia (Macedonia) (%)
Place of birth for the foreign-born population - Moldova (%)
Place of birth for the foreign-born population - Poland (%)
Place of birth for the foreign-born population - Romania (%)
Place of birth for the foreign-born population - Russia (%)
Place of birth for the foreign-born population - Serbia (%)
Place of birth for the foreign-born population - Ukraine (%)
Place of birth for the foreign-born population - Other Eastern Europe (%)
Place of birth for the foreign-born population - China (%)
Place of birth for the foreign-born population - Hong Kong (%)
Place of birth for the foreign-born population - Taiwan (%)
Place of birth for the foreign-born population - Japan (%)
Place of birth for the foreign-born population - Korea (%)
Place of birth for the foreign-born population - Other Eastern Asia (%)
Place of birth for the foreign-born population - Afghanistan (%)
Place of birth for the foreign-born population - Bangladesh (%)
Place of birth for the foreign-born population - India (%)
Place of birth for the foreign-born population - Iran (%)
Place of birth for the foreign-born population - Kazakhstan (%)
Place of birth for the foreign-born population - Nepal (%)
Place of birth for the foreign-born population - Pakistan (%)
Place of birth for the foreign-born population - Sri Lanka (%)
Place of birth for the foreign-born population - Uzbekistan (%)
Place of birth for the foreign-born population - Other South Central Asia (%)
Place of birth for the foreign-born population - Burma (%)
Place of birth for the foreign-born population - Cambodia (%)
Place of birth for the foreign-born population - Indonesia (%)
Place of birth for the foreign-born population - Laos (%)
Place of birth for the foreign-born population - Malaysia (%)
Place of birth for the foreign-born population - Philippines (%)
Place of birth for the foreign-born population - Singapore (%)
Place of birth for the foreign-born population - Thailand (%)
Place of birth for the foreign-born population - Vietnam (%)
Place of birth for the foreign-born population - Other South Eastern Asia (%)
Place of birth for the foreign-born population - Armenia (%)
Place of birth for the foreign-born population - Iraq (%)
Place of birth for the foreign-born population - Israel (%)
Place of birth for the foreign-born population - Jordan (%)
Place of birth for the foreign-born population - Kuwait (%)
Place of birth for the foreign-born population - Lebanon (%)
Place of birth for the foreign-born population - Saudi Arabia (%)
Place of birth for the foreign-born population - Syria (%)
Place of birth for the foreign-born population - Turkey (%)
Place of birth for the foreign-born population - Yemen (%)
Place of birth for the foreign-born population - Other Western Asia (%)
Place of birth for the foreign-born population - Eritrea (%)
Place of birth for the foreign-born population - Ethiopia (%)
Place of birth for the foreign-born population - Kenya (%)
Place of birth for the foreign-born population - Somalia (%)
Place of birth for the foreign-born population - Uganda (%)
Place of birth for the foreign-born population - Zimbabwe (%)
Place of birth for the foreign-born population - Other Eastern Africa (%)
Place of birth for the foreign-born population - Cameroon (%)
Place of birth for the foreign-born population - Congo (%)
Place of birth for the foreign-born population - Democratic Republic of Congo (Zaire) (%)
Place of birth for the foreign-born population - Other Middle Africa (%)
Place of birth for the foreign-born population - Egypt (%)
Place of birth for the foreign-born population - Morocco (%)
Place of birth for the foreign-born population - Sudan (%)
Place of birth for the foreign-born population - Other Northern Africa (%)
Place of birth for the foreign-born population - South Africa (%)
Place of birth for the foreign-born population - Other Southern Africa (%)
Place of birth for the foreign-born population - Cabo Verde (%)
Place of birth for the foreign-born population - Ghana (%)
Place of birth for the foreign-born population - Liberia (%)
Place of birth for the foreign-born population - Nigeria (%)
Place of birth for the foreign-born population - Senegal (%)
Place of birth for the foreign-born population - Sierra Leone (%)
Place of birth for the foreign-born population - Other Western Africa (%)
Place of birth for the foreign-born population - Australia (%)
Place of birth for the foreign-born population - New Zealand (%)
Place of birth for the foreign-born population - Fiji (%)
Place of birth for the foreign-born population - Micronesia (%)
Place of birth for the foreign-born population - Bahamas (%)
Place of birth for the foreign-born population - Barbados (%)
Place of birth for the foreign-born population - Cuba (%)
Place of birth for the foreign-born population - Dominica (%)
Place of birth for the foreign-born population - Dominican Republic (%)
Place of birth for the foreign-born population - Grenada (%)
Place of birth for the foreign-born population - Haiti (%)
Place of birth for the foreign-born population - Jamaica (%)
Place of birth for the foreign-born population - St. Vincent and the Grenadines (%)
Place of birth for the foreign-born population - Trinidad and Tobago (%)
Place of birth for the foreign-born population - West Indies (%)
Place of birth for the foreign-born population - Other Caribbean (%)
Place of birth for the foreign-born population - Belize (%)
Place of birth for the foreign-born population - Costa Rica (%)
Place of birth for the foreign-born population - El Salvador (%)
Place of birth for the foreign-born population - Guatemala (%)
Place of birth for the foreign-born population - Honduras (%)
Place of birth for the foreign-born population - Mexico (%)
Place of birth for the foreign-born population - Nicaragua (%)
Place of birth for the foreign-born population - Panama (%)
Place of birth for the foreign-born population - Other Central America (%)
Place of birth for the foreign-born population - Argentina (%)
Place of birth for the foreign-born population - Bolivia (%)
Place of birth for the foreign-born population - Brazil (%)
Place of birth for the foreign-born population - Chile (%)
Place of birth for the foreign-born population - Colombia (%)
Place of birth for the foreign-born population - Ecuador (%)
Place of birth for the foreign-born population - Guyana (%)
Place of birth for the foreign-born population - Peru (%)
Place of birth for the foreign-born population - Uruguay (%)
Place of birth for the foreign-born population - Venezuela (%)
Place of birth for the foreign-born population - Other South America (%)
Place of birth for the foreign-born population - Canada (%)
Place of birth for the foreign-born population - Other Northern America (%)
Place of birth for the foreign-born population - Other (%)
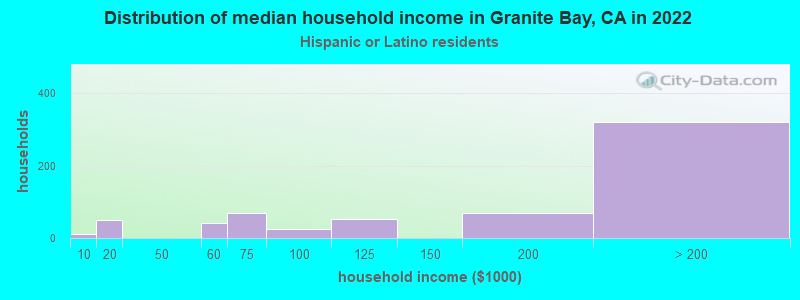
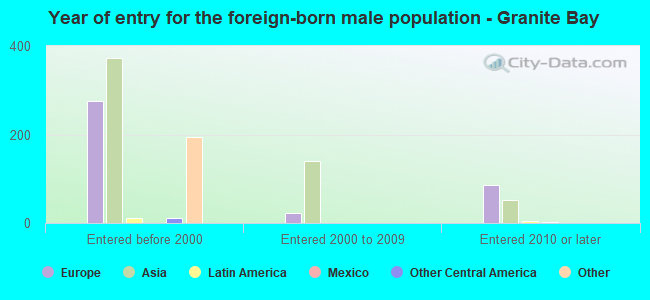
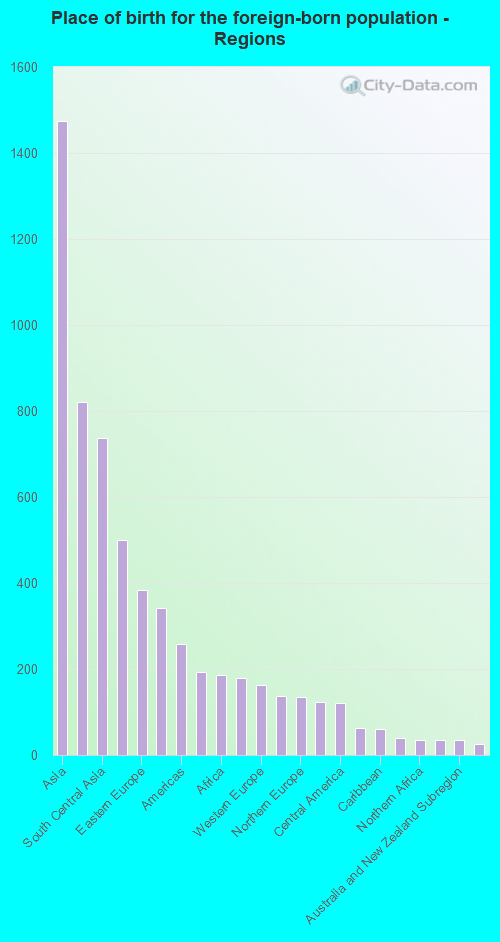
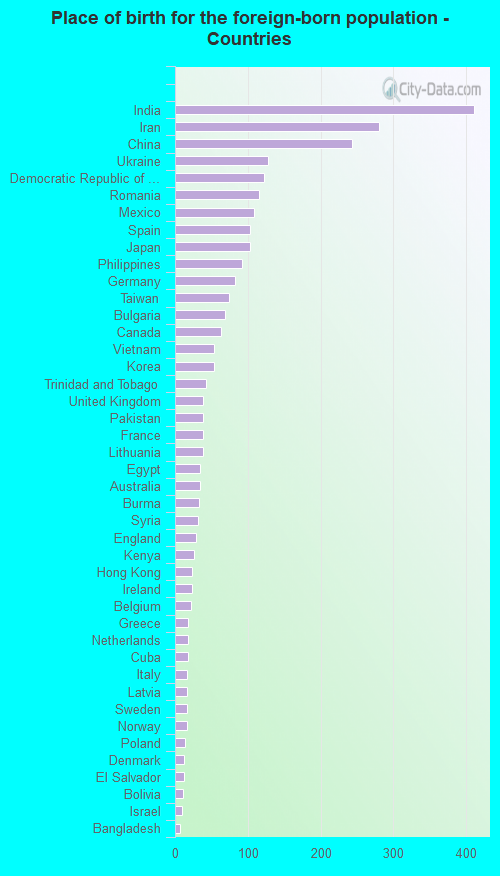
According to 2022 data, the most numerous races in Granite Bay, CA are Hispanic (2,445 residents), White alone (15,879 residents), and Asian alone (1,944 residents). 84.8% of Granite Bay residents speak English at home. 11.6% of Granite Bay, CA residents are foreign-born (6.3% born in Asia, 3.5% born in Europe), which is 124.8% less than the foreign-born rate of 26.0% across the entire state of California.
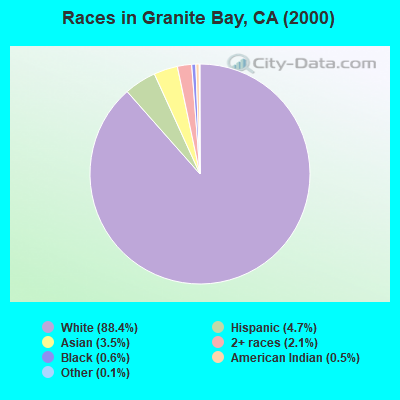
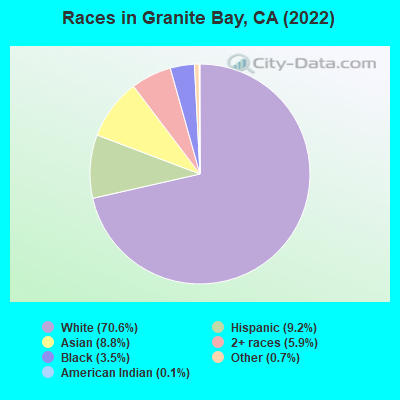
Race distribution in Granite Bay
2000 2022
15,816,790 46.7% White alone 10,966,556 32.4% Hispanic 3,648,860 10.8% Asian alone 2,181,926 6.4% Black alone 903,115 2.7% Two or more races 178,984 0.5% American Indian alone 103,736 0.3% Native Hawaiian and Other 71,681 0.2% Other race alone
15,732,184 40.3% Hispanic 13,160,426 33.7% White alone 5,957,867 15.3% Asian alone 2,025,218 5.2% Black alone 1,663,222 4.3% Two or more races 251,618 0.6% Other race alone 135,777 0.3% Native Hawaiian and Other 103,030 0.3% American Indian alone
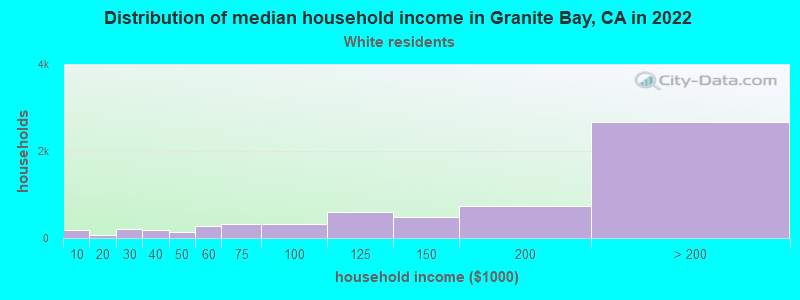
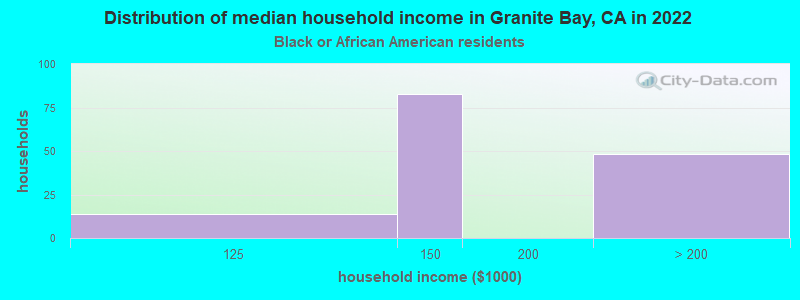
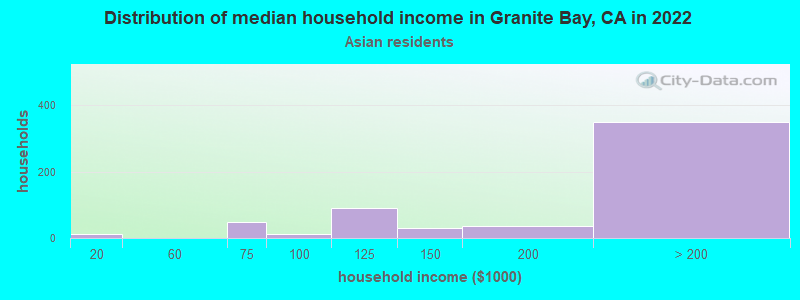
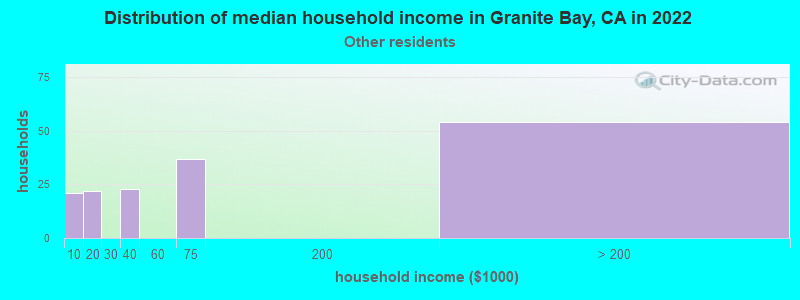
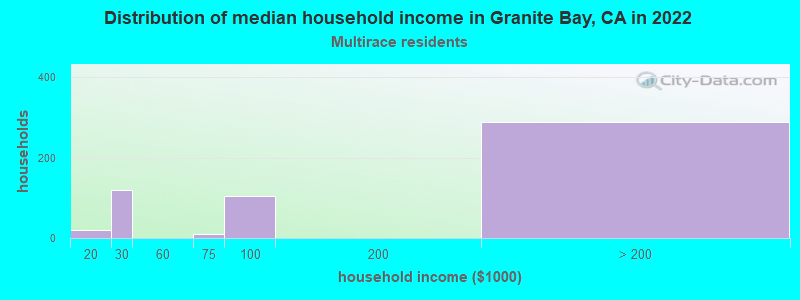
Income and house value in Granite Bay Median household income in 2022 $179,783 White non-Hispanic householdersover $200,000 Black householdersover $200,000 American Indian and Alaska Native householdersover $200,000 Asian householdersover $200,000 Some other race householdersover $200,000 Two or more races householders$160,342 Hispanic or Latino race householdersMedian 2022 house value over $1,000,000 White Non-Hispanic householdersover $1,000,000 Black or African American householdersover $1,000,000 American Indian or Alaska Native householders over $1,000,000 Asian householdersover $1,000,000 Some other race householdersover $1,000,000 Two or more races householdersover $1,000,000 Hispanic or Latino householders
Median age by race in Granite Bay
51.5 Median age for White residents51.2 52.3 25.8 Median age for Black or African American residents51.7 19.5 15.5 Median age for American Indian / Alaska Native residents46.4 Median age for Asian residents40.4 48.1 35.9 Median age for Other race residents25.5 32.0 34.1 Median age for Two or more races residents32.0 34.5 51.4 Median age for White alone residents50.3 52.5 33.9 Median age for Hispanic or Latino residents45.6 31.4
Owner/renter occupied households by race in Granite Bay
House owners and renters - White residents 5,891 89.5% Owner occupied691 10.5% Renter occupiedHouse owners and renters - Black or African American residents 307 93.9% Owner occupied20 6.1% Renter occupiedHouse owners and renters - American Indian / Alaska Native residents 77 100.0% Owner occupiedHouse owners and renters - Asian residents 593 100.0% Owner occupiedHouse owners and renters - Native Hawaiian / Pacific Islander residents 14 100.0% Owner occupiedHouse owners and renters - Other race residents 49 100.0% Owner occupiedHouse owners and renters - Two or more races residents 543 67.4% Owner occupied262 32.6% Renter occupiedHouse owners and renters - White alone residents 5,829 89.7% Owner occupied670 10.3% Renter occupiedHouse owners and renters - Hispanic or Latino residents 645 86.9% Owner occupied97 13.1% Renter occupied
Language usage in Granite Bay
English speakers - Total 84.8% of residents of Granite Bay speak English at home.
5.4% of residents speak Spanish at home 1,106 91.4% Speak English very well104 8.6% Speak English less than very well10.4% of residents speak other language at home 1,752 75.0% Speak English very well583 25.0% Speak English less than very well
English speakers - Born in the United States 95.6% of residents of Granite Bay speak English at home.
1.7% of residents speak Spanish at home 104 100.0% Speak English very well2.5% of residents speak other language at home 98 64.5% Speak English very well54 35.5% Speak English less than very well
English speakers - Native, born elsewhere 72.9% of residents of Granite Bay speak English at home.
24.8% of residents speak Spanish at home 78 90.7% Speak English very well8 9.3% Speak English less than very well2.6% of residents speak other language at home 9 100.0% Speak English very well
English speakers - Foreign-born 24.5% of residents of Granite Bay speak English at home.
9.2% of residents speak Spanish at home 210 83.7% Speak English very well41 16.3% Speak English less than very well70.2% of residents speak other language at home 1,381 72.5% Speak English very well525 27.5% Speak English less than very well
White (Caucasian) - Speak only English Native:
98.6% (14,574)Foreign-born:
23.9% (274)
White (Caucasian) - Speak another language Native:
5.6% (835)Foreign-born:
79.4% (911)
American Indian / Alaska Native - Speak only English Native:
83.5% (102)Foreign-born:
89.9% (23)
Asian - Speak only English Native:
74.1% (550)Foreign-born:
17.6% (220)
Asian - Speak another language Native:
20.9% (155)Foreign-born:
83.0% (1,041)
Other race - Speak another language Native:
46.6% (135)Foreign-born:
98.2% (43)
Two or more races - Speak only English Native:
75.0% (1,621)Foreign-born:
45.3% (378)
Two or more races - Speak another language Native:
4.0% (87)Foreign-born:
23.6% (197)
White alone - Speak only English Native:
96.7% (14,075)Foreign-born:
20.4% (269)
White alone - Speak another language Native:
3.2% (467)Foreign-born:
83.5% (1,098)
Hispanic or Latino - Speak only English Native:
63.6% (1,436)Foreign-born:
6.4% (14)
Hispanic or Latino - Speak another language Native:
37.5% (846)Foreign-born:
94.4% (212)
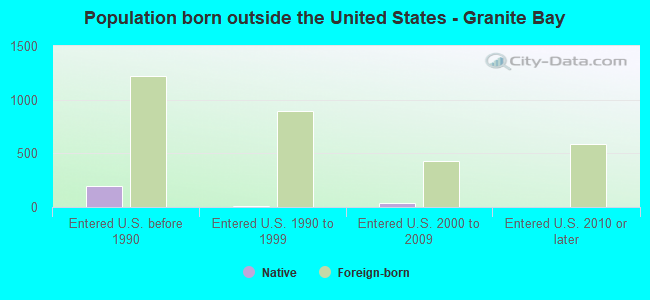
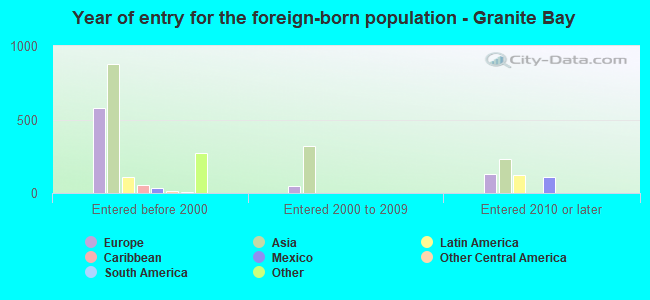
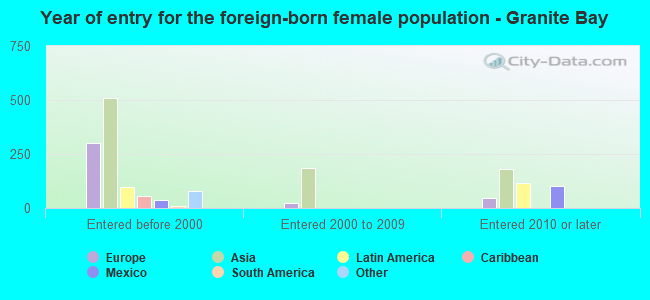
Foreign-born residents in Granite Bay 2,775 residents are foreign born (6.3% Asia , 3.5% Europe ).
This city:
11.6%California:
100.0%
Marital status for residents in Granite Bay Marital status - White (Caucasian) population 15 years and over
Males 24.0% Never married67.5% Now married0.6% Separated2.5% Widowed5.4% DivorcedFemales 19.0% Never married65.4% Now married1.3% Separated7.8% Widowed6.6% DivorcedWomen who gave birth in the past 12 months Now married:
100.0% (36)Unmarried:
0.0% (0)
Women who did not give birth in the past 12 months Now married:
57.6% (1,679)Unmarried:
42.4% (1,237)
Marital status - Black or African American population 15 years and over
Males 30.1% Never married64.5% Now married0.0% Separated0.0% Widowed5.4% DivorcedFemales 36.3% Never married44.5% Now married0.0% Separated0.0% Widowed19.2% DivorcedWomen who did not give birth in the past 12 months Now married:
55.6% (118)Unmarried:
44.4% (94)
Marital status - American Indian / Alaska Native population 15 years and over
Males 55.6% Never married44.4% Now married0.0% Separated0.0% Widowed0.0% DivorcedFemales 53.0% Never married47.0% Now married0.0% Separated0.0% Widowed0.0% DivorcedWomen who gave birth in the past 12 months Now married:
100.0% (28)Unmarried:
0.0% (0)
Women who did not give birth in the past 12 months Now married:
0.0% (0)Unmarried:
100.0% (64)
Marital status - Asian population 15 years and over
Males 21.1% Never married77.2% Now married0.0% Separated0.0% Widowed1.7% DivorcedFemales 5.3% Never married78.8% Now married0.0% Separated4.1% Widowed11.7% DivorcedWomen who gave birth in the past 12 months Now married:
100.0% (69)Unmarried:
0.0% (0)
Women who did not give birth in the past 12 months Now married:
87.8% (382)Unmarried:
12.2% (53)
Marital status - Other race population 15 years and over
Males 45.4% Never married47.9% Now married0.0% Separated1.7% Widowed5.0% DivorcedFemales 19.8% Never married39.6% Now married40.6% Separated0.0% Widowed0.0% DivorcedWomen who did not give birth in the past 12 months Now married:
67.2% (46)Unmarried:
32.8% (22)
Marital status - Two or more races population 15 years and over
Males 24.8% Never married75.2% Now married0.0% Separated0.0% Widowed0.0% DivorcedFemales 48.0% Never married39.8% Now married6.6% Separated0.0% Widowed5.6% DivorcedWomen who did not give birth in the past 12 months Now married:
46.7% (506)Unmarried:
53.3% (577)
Marital status - White alone, not Hispanic / Latino population 15 years and over
Males 22.0% Never married69.4% Now married0.7% Separated2.8% Widowed5.0% DivorcedFemales 18.3% Never married64.9% Now married1.4% Separated8.2% Widowed7.2% DivorcedWomen who gave birth in the past 12 months Now married:
100.0% (18)Unmarried:
0.0% (0)
Women who did not give birth in the past 12 months Now married:
57.0% (1,668)Unmarried:
43.0% (1,257)
Marital status - Hispanic or Latino population 15 years and over
Males 41.1% Never married50.8% Now married0.0% Separated0.2% Widowed7.9% DivorcedFemales 27.1% Never married65.3% Now married4.5% Separated3.1% Widowed0.0% DivorcedWomen who gave birth in the past 12 months Now married:
100.0% (28)Unmarried:
0.0% (0)
Women who did not give birth in the past 12 months Now married:
60.0% (392)Unmarried:
40.0% (262)
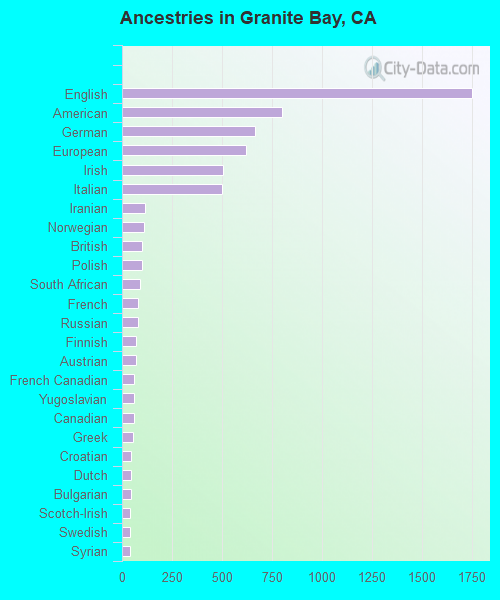
Ancestries in Granite Bay
1,418 12.6% American1,056 9.4% English994 8.8% European938 8.3% German388 3.4% Italian373 3.3% Iranian345 3.1% Irish300 2.7% Romanian196 1.7% Russian175 1.6% French152 1.3% British151 1.3% Ukrainian120 1.1% Polish89 0.8% Greek85 0.8% Bulgarian71 0.6% Scottish67 0.6% Norwegian66 0.6% Portuguese59 0.5% Danish55 0.5% Canadian55 0.5% Scotch-Irish46 0.4% Syrian46 0.4% French Canadian45 0.4% Celtic45 0.4% Scandinavian44 0.4% Lithuanian43 0.4% Northern European40 0.4% Swedish35 0.3% Belgian32 0.3% Finnish24 0.2% Eastern European23 0.2% Swiss18 0.2% West Indian16 0.1% Egyptian15 0.1% Dutch15 0.1% Serbian14 0.1% Yugoslavian12 0.1% Latvian2 0.02% African
Geographical mobility in Granite Bay Same house 1 year ago 14,388 90.1% White (Caucasian)793 98.6% Black or African American156 100.0% American Indian / Alaska Native1,915 90.8% Asian14 100.0% Native Hawaiian / Pacific Islander299 94.0% Other race2,850 94.7% Two or more races14,579 90.7% White alone, not Hispanic / Latino1,834 76.8% Hispanic or LatinoMoved within same county 510 3.2% White / Caucasian61 2.9% Asian4 1.4% Other race820 5.1% White alone, not Hispanic / Latino4 0.2% Hispanic or LatinoMoved within same state 852 5.3% White / Caucasian32 4.0% Black or African American33 1.6% Asian18 5.8% Other race84 2.8% Two or more races518 3.2% White alone, not Hispanic / Latino419 17.6% Hispanic or LatinoMoved from different state 264 1.7% White / Caucasian132 6.3% Asian101 3.4% Two or more races173 1.1% White alone, not Hispanic / Latino102 4.3% Hispanic or LatinoMoved from abroad 108 0.7% White27 0.9% Two or more races45 0.3% White alone, not Hispanic / Latino44 1.8% Hispanic or Latino
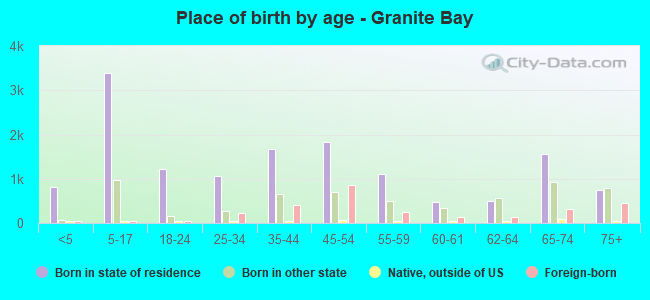
Children Nativity (place of birth) in Granite Bay
Children under 6 years - Living with two parents Both parents native 637 100.0% NativeBoth parents foreign-born 400 100.0% NativeOne native, one foreign-born parent 107 100.0% NativeChildren under 6 years - Living with one parent Native parent 83 100.0% NativeChildren 6 to 17 years - Living with two parents Both parents native 2,218 100.0% NativeBoth parents foreign-born 743 94.8% Native41 5.2% Foreign-bornOne native, one foreign-born parent 662 100.0% NativeChildren 6 to 17 years - Living with one parent Native parent 527 100.0% NativeForeign-born parent 43 49.2% Native45 50.8% Foreign-born
Grandparents responsible for own grandchildren in Granite Bay
Grandparents (30 to 59 years) White / Caucasian 23 72.6% Responsible for grandchildren8 27.4% Not responsible for grandchildrenAsian 19 100.0% Responsible for grandchildrenTwo or more races 108 100.0% Not responsible for grandchildrenWhite alone, not Hispanic / Latino 23 69.8% Responsible for grandchildren10 30.2% Not responsible for grandchildrenGrandparents (60 years and over) White / Caucasian 52 25.6% Responsible for grandchildren152 74.4% Not responsible for grandchildrenAsian 104 100.0% Not responsible for grandchildrenWhite alone, not Hispanic / Latino 63 22.5% Responsible for grandchildren217 77.5% Not responsible for grandchildren