Races in Hollywood, Florida (FL) Detailed Stats
Data:
Races - White alone (%)
Races - White alone (% change since 2000)
Races - Black alone (%)
Races - Black alone (% change since 2000)
Races - American Indian alone (%)
Races - American Indian alone (% change since 2000)
Races - Asian alone (%)
Races - Asian alone (% change since 2000)
Races - Hispanic (%)
Races - Hispanic (% change since 2000)
Races - Native Hawaiian and Other Pacific Islander alone (%)
Races - Native Hawaiian and Other Pacific Islander alone (% change since 2000)
Races - Two or more races(%)
Races - Two or more races(% change since 2000)
Races - Other race alone (%)
Races - Other race alone (% change since 2000)
Racial diversity
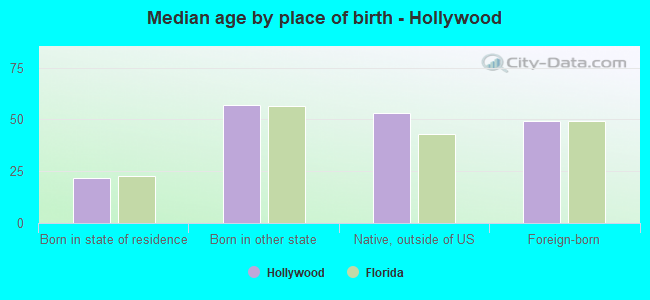
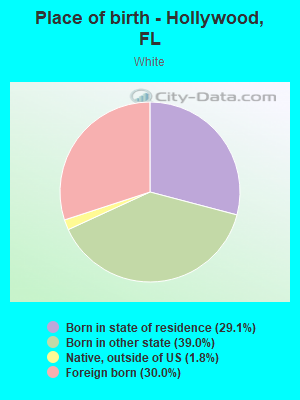
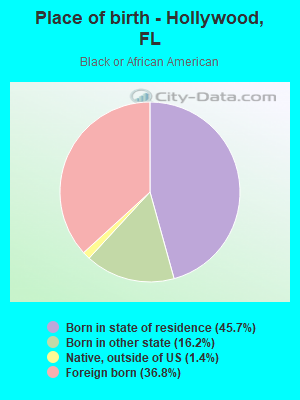
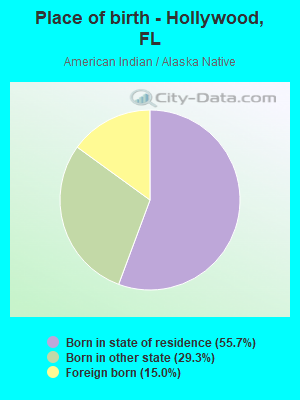
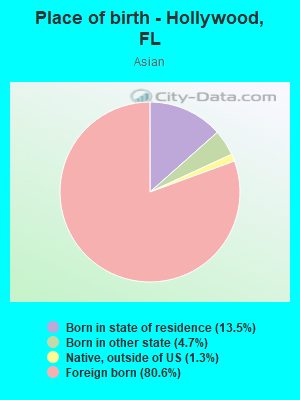
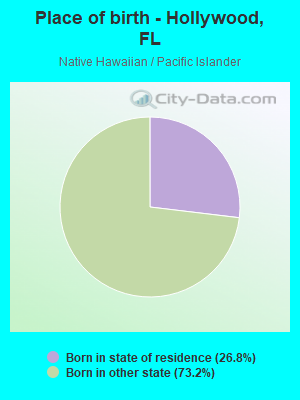
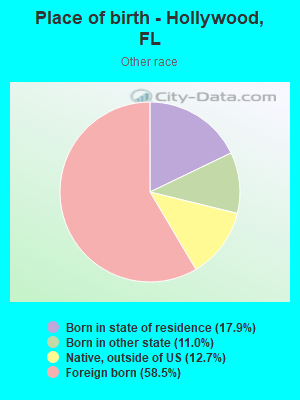
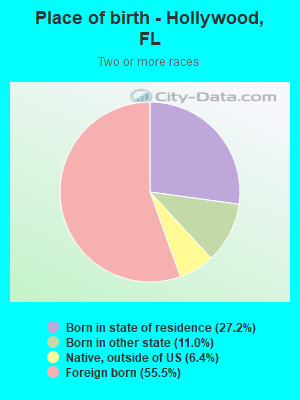
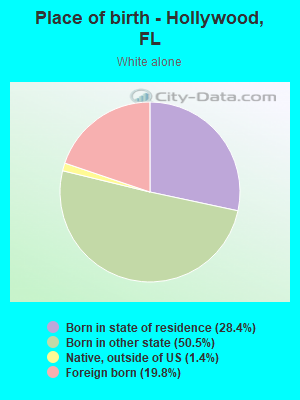
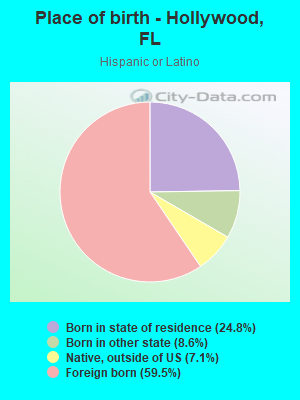
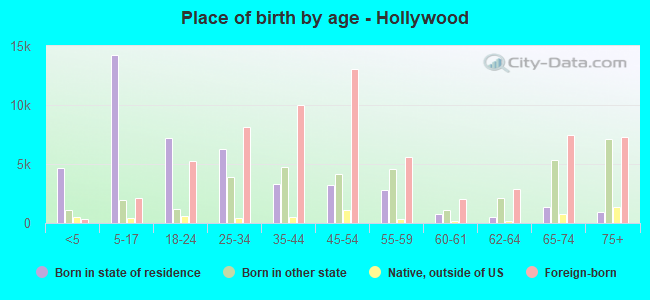
Place of birth - Born in state of residence (%)
Place of birth - Born in state of residence (%) - White
Place of birth - Born in state of residence (%) - Black or African American
Place of birth - Born in state of residence (%) - Asian
Place of birth - Born in state of residence (%) - Hispanic or Latino
Place of birth - Born in state of residence (%) - American Indian and Alaska Native
Place of birth - Born in state of residence (%) - Multirace
Place of birth - Born in state of residence (%) - Other Race
Place of birth - Born in other state (%)
Place of birth - Born in other state (%) - White
Place of birth - Born in other state (%) - Black or African American
Place of birth - Born in other state (%) - Asian
Place of birth - Born in other state (%) - Hispanic or Latino
Place of birth - Born in other state (%) - American Indian and Alaska Native
Place of birth - Born in other state (%) - Multirace
Place of birth - Born in other state (%) - Other Race
Place of birth - Native, outside of US (%)
Place of birth - Native, outside of US (%) - White
Place of birth - Native, outside of US (%) - Black or African American
Place of birth - Native, outside of US (%) - Asian
Place of birth - Native, outside of US (%) - Hispanic or Latino
Place of birth - Native, outside of US (%) - American Indian and Alaska Native
Place of birth - Native, outside of US (%) - Multirace
Place of birth - Native, outside of US (%) - Other Race
Place of birth - Foreign born (%)
Place of birth - Foreign born (%) - White
Place of birth - Foreign born (%) - Black or African American
Place of birth - Foreign born (%) - Asian
Place of birth - Foreign born (%) - Hispanic or Latino
Place of birth - Foreign born (%) - American Indian and Alaska Native
Place of birth - Foreign born (%) - Multirace
Place of birth - Foreign born (%) - Other Race
Residents speaking English at home (%)
Residents speaking English at home - Born in the United States (%)
Residents speaking English at home - Native, born elsewhere (%)
Residents speaking English at home - Foreign born (%)
Residents speaking Spanish at home (%)
Residents speaking Spanish at home - Born in the United States (%)
Residents speaking Spanish at home - Native, born elsewhere (%)
Residents speaking Spanish at home - Foreign born (%)
Residents speaking other language at home (%)
Residents speaking other language at home - Born in the United States (%)
Residents speaking other language at home - Native, born elsewhere (%)
Residents speaking other language at home - Foreign born (%)
Marital status - Never married (%)
Marital status - Now married (%)
Marital status - Separated (%)
Marital status - Widowed (%)
Marital status - Divorced (%)
Ancestries Reported - Arab (%)
Ancestries Reported - Czech (%)
Ancestries Reported - Danish (%)
Ancestries Reported - Dutch (%)
Ancestries Reported - English (%)
Ancestries Reported - French (%)
Ancestries Reported - French Canadian (%)
Ancestries Reported - German (%)
Ancestries Reported - Greek (%)
Ancestries Reported - Hungarian (%)
Ancestries Reported - Irish (%)
Ancestries Reported - Italian (%)
Ancestries Reported - Lithuanian (%)
Ancestries Reported - Norwegian (%)
Ancestries Reported - Polish (%)
Ancestries Reported - Portuguese (%)
Ancestries Reported - Russian (%)
Ancestries Reported - Scotch-Irish (%)
Ancestries Reported - Scottish (%)
Ancestries Reported - Slovak (%)
Ancestries Reported - Subsaharan African (%)
Ancestries Reported - Swedish (%)
Ancestries Reported - Swiss (%)
Ancestries Reported - Ukrainian (%)
Ancestries Reported - United States (%)
Ancestries Reported - Welsh (%)
Ancestries Reported - West Indian (%)
Ancestries Reported - Other (%)
Geographical mobility - Same house 1 year ago (%)
Geographical mobility - Same house 1 year ago (%) - White
Geographical mobility - Same house 1 year ago (%) - Black or African American
Geographical mobility - Same house 1 year ago (%) - Asian
Geographical mobility - Same house 1 year ago (%) - Hispanic or Latino
Geographical mobility - Same house 1 year ago (%) - American Indian and Alaska Native
Geographical mobility - Same house 1 year ago (%) - Multirace
Geographical mobility - Same house 1 year ago (%) - Other Race
Geographical mobility - Moved within same county (%)
Geographical mobility - Moved within same county (%) - White
Geographical mobility - Moved within same county (%) - Black or African American
Geographical mobility - Moved within same county (%) - Asian
Geographical mobility - Moved within same county (%) - Hispanic or Latino
Geographical mobility - Moved within same county (%) - American Indian and Alaska Native
Geographical mobility - Moved within same county (%) - Multirace
Geographical mobility - Moved within same county (%) - Other Race
Geographical mobility - Moved from different county within same state (%)
Geographical mobility - Moved from different county within same state (%) - White
Geographical mobility - Moved from different county within same state (%) - Black or African American
Geographical mobility - Moved from different county within same state (%) - Asian
Geographical mobility - Moved from different county within same state (%) - Hispanic or Latino
Geographical mobility - Moved from different county within same state (%) - American Indian and Alaska Native
Geographical mobility - Moved from different county within same state (%) - Multirace
Geographical mobility - Moved from different county within same state (%) - Other Race
Geographical mobility - Moved from different state (%)
Geographical mobility - Moved from different state (%) - White
Geographical mobility - Moved from different state (%) - Black or African American
Geographical mobility - Moved from different state (%) - Asian
Geographical mobility - Moved from different state (%) - Hispanic or Latino
Geographical mobility - Moved from different state (%) - American Indian and Alaska Native
Geographical mobility - Moved from different state (%) - Multirace
Geographical mobility - Moved from different state (%) - Other Race
Geographical mobility - Moved from abroad (%)
Geographical mobility - Moved from abroad (%) - White
Geographical mobility - Moved from abroad (%) - Black or African American
Geographical mobility - Moved from abroad (%) - Asian
Geographical mobility - Moved from abroad (%) - Hispanic or Latino
Geographical mobility - Moved from abroad (%) - American Indian and Alaska Native
Geographical mobility - Moved from abroad (%) - Multirace
Geographical mobility - Moved from abroad (%) - Other Race
Place of birth for the foreign-born population - Ireland (%)
Place of birth for the foreign-born population - Denmark (%)
Place of birth for the foreign-born population - Norway (%)
Place of birth for the foreign-born population - Sweden (%)
Place of birth for the foreign-born population - United Kingdom (%)
Place of birth for the foreign-born population - England (%)
Place of birth for the foreign-born population - Scotland (%)
Place of birth for the foreign-born population - Other Northern Europe (%)
Place of birth for the foreign-born population - Austria (%)
Place of birth for the foreign-born population - Belgium (%)
Place of birth for the foreign-born population - France (%)
Place of birth for the foreign-born population - Germany (%)
Place of birth for the foreign-born population - Netherlands (%)
Place of birth for the foreign-born population - Switzerland (%)
Place of birth for the foreign-born population - Other Western Europe (%)
Place of birth for the foreign-born population - Greece (%)
Place of birth for the foreign-born population - Italy (%)
Place of birth for the foreign-born population - Portugal (%)
Place of birth for the foreign-born population - Spain (%)
Place of birth for the foreign-born population - Other Southern Europe (%)
Place of birth for the foreign-born population - Albania (%)
Place of birth for the foreign-born population - Belarus (%)
Place of birth for the foreign-born population - Bosnia and Herzegovina (%)
Place of birth for the foreign-born population - Bulgaria (%)
Place of birth for the foreign-born population - Croatia (%)
Place of birth for the foreign-born population - Czechoslovakia (%)
Place of birth for the foreign-born population - Hungary (%)
Place of birth for the foreign-born population - Latvia (%)
Place of birth for the foreign-born population - Lithuania (%)
Place of birth for the foreign-born population - North Macedonia (Macedonia) (%)
Place of birth for the foreign-born population - Moldova (%)
Place of birth for the foreign-born population - Poland (%)
Place of birth for the foreign-born population - Romania (%)
Place of birth for the foreign-born population - Russia (%)
Place of birth for the foreign-born population - Serbia (%)
Place of birth for the foreign-born population - Ukraine (%)
Place of birth for the foreign-born population - Other Eastern Europe (%)
Place of birth for the foreign-born population - China (%)
Place of birth for the foreign-born population - Hong Kong (%)
Place of birth for the foreign-born population - Taiwan (%)
Place of birth for the foreign-born population - Japan (%)
Place of birth for the foreign-born population - Korea (%)
Place of birth for the foreign-born population - Other Eastern Asia (%)
Place of birth for the foreign-born population - Afghanistan (%)
Place of birth for the foreign-born population - Bangladesh (%)
Place of birth for the foreign-born population - India (%)
Place of birth for the foreign-born population - Iran (%)
Place of birth for the foreign-born population - Kazakhstan (%)
Place of birth for the foreign-born population - Nepal (%)
Place of birth for the foreign-born population - Pakistan (%)
Place of birth for the foreign-born population - Sri Lanka (%)
Place of birth for the foreign-born population - Uzbekistan (%)
Place of birth for the foreign-born population - Other South Central Asia (%)
Place of birth for the foreign-born population - Burma (%)
Place of birth for the foreign-born population - Cambodia (%)
Place of birth for the foreign-born population - Indonesia (%)
Place of birth for the foreign-born population - Laos (%)
Place of birth for the foreign-born population - Malaysia (%)
Place of birth for the foreign-born population - Philippines (%)
Place of birth for the foreign-born population - Singapore (%)
Place of birth for the foreign-born population - Thailand (%)
Place of birth for the foreign-born population - Vietnam (%)
Place of birth for the foreign-born population - Other South Eastern Asia (%)
Place of birth for the foreign-born population - Armenia (%)
Place of birth for the foreign-born population - Iraq (%)
Place of birth for the foreign-born population - Israel (%)
Place of birth for the foreign-born population - Jordan (%)
Place of birth for the foreign-born population - Kuwait (%)
Place of birth for the foreign-born population - Lebanon (%)
Place of birth for the foreign-born population - Saudi Arabia (%)
Place of birth for the foreign-born population - Syria (%)
Place of birth for the foreign-born population - Turkey (%)
Place of birth for the foreign-born population - Yemen (%)
Place of birth for the foreign-born population - Other Western Asia (%)
Place of birth for the foreign-born population - Eritrea (%)
Place of birth for the foreign-born population - Ethiopia (%)
Place of birth for the foreign-born population - Kenya (%)
Place of birth for the foreign-born population - Somalia (%)
Place of birth for the foreign-born population - Uganda (%)
Place of birth for the foreign-born population - Zimbabwe (%)
Place of birth for the foreign-born population - Other Eastern Africa (%)
Place of birth for the foreign-born population - Cameroon (%)
Place of birth for the foreign-born population - Congo (%)
Place of birth for the foreign-born population - Democratic Republic of Congo (Zaire) (%)
Place of birth for the foreign-born population - Other Middle Africa (%)
Place of birth for the foreign-born population - Egypt (%)
Place of birth for the foreign-born population - Morocco (%)
Place of birth for the foreign-born population - Sudan (%)
Place of birth for the foreign-born population - Other Northern Africa (%)
Place of birth for the foreign-born population - South Africa (%)
Place of birth for the foreign-born population - Other Southern Africa (%)
Place of birth for the foreign-born population - Cabo Verde (%)
Place of birth for the foreign-born population - Ghana (%)
Place of birth for the foreign-born population - Liberia (%)
Place of birth for the foreign-born population - Nigeria (%)
Place of birth for the foreign-born population - Senegal (%)
Place of birth for the foreign-born population - Sierra Leone (%)
Place of birth for the foreign-born population - Other Western Africa (%)
Place of birth for the foreign-born population - Australia (%)
Place of birth for the foreign-born population - New Zealand (%)
Place of birth for the foreign-born population - Fiji (%)
Place of birth for the foreign-born population - Micronesia (%)
Place of birth for the foreign-born population - Bahamas (%)
Place of birth for the foreign-born population - Barbados (%)
Place of birth for the foreign-born population - Cuba (%)
Place of birth for the foreign-born population - Dominica (%)
Place of birth for the foreign-born population - Dominican Republic (%)
Place of birth for the foreign-born population - Grenada (%)
Place of birth for the foreign-born population - Haiti (%)
Place of birth for the foreign-born population - Jamaica (%)
Place of birth for the foreign-born population - St. Vincent and the Grenadines (%)
Place of birth for the foreign-born population - Trinidad and Tobago (%)
Place of birth for the foreign-born population - West Indies (%)
Place of birth for the foreign-born population - Other Caribbean (%)
Place of birth for the foreign-born population - Belize (%)
Place of birth for the foreign-born population - Costa Rica (%)
Place of birth for the foreign-born population - El Salvador (%)
Place of birth for the foreign-born population - Guatemala (%)
Place of birth for the foreign-born population - Honduras (%)
Place of birth for the foreign-born population - Mexico (%)
Place of birth for the foreign-born population - Nicaragua (%)
Place of birth for the foreign-born population - Panama (%)
Place of birth for the foreign-born population - Other Central America (%)
Place of birth for the foreign-born population - Argentina (%)
Place of birth for the foreign-born population - Bolivia (%)
Place of birth for the foreign-born population - Brazil (%)
Place of birth for the foreign-born population - Chile (%)
Place of birth for the foreign-born population - Colombia (%)
Place of birth for the foreign-born population - Ecuador (%)
Place of birth for the foreign-born population - Guyana (%)
Place of birth for the foreign-born population - Peru (%)
Place of birth for the foreign-born population - Uruguay (%)
Place of birth for the foreign-born population - Venezuela (%)
Place of birth for the foreign-born population - Other South America (%)
Place of birth for the foreign-born population - Canada (%)
Place of birth for the foreign-born population - Other Northern America (%)
Place of birth for the foreign-born population - Other (%)
Latest news about races in Hollywood, FL collected exclusively by city-data.com from local newspapers, TV, and radio stations
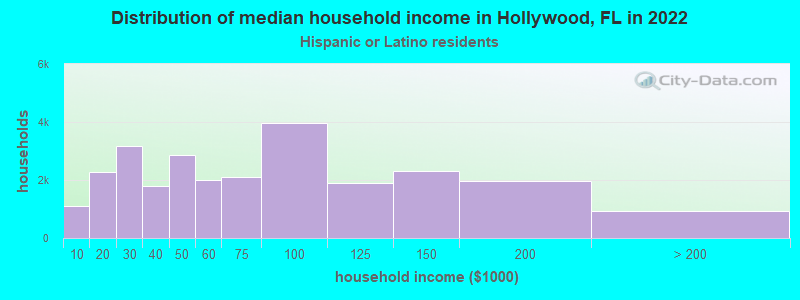
According to 2022 data, the most numerous races in Hollywood, FL are White alone (51,258 residents), Hispanic (71,682 residents), and Black alone (21,176 residents). 47.4% of Hollywood residents speak English at home. 40.3% of Hollywood, FL residents are foreign-born (30.6% born in Latin America), which is 47.9% greater than the foreign-born rate of 21.0% across the entire state of Florida.
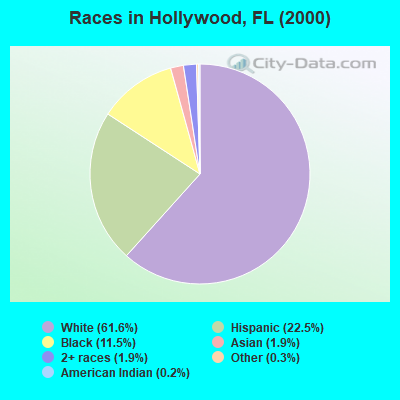
Race distribution in Hollywood
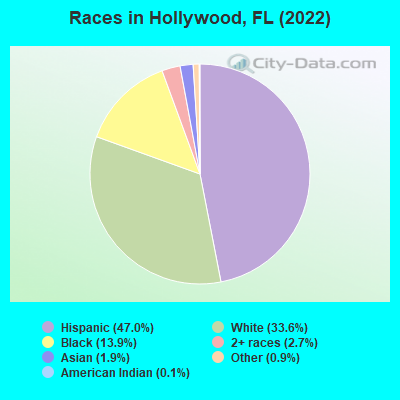
2000 2022
85,808 61.6% White alone 31,392 22.5% Hispanic 15,972 11.5% Black alone 2,643 1.9% Two or more races 2,695 1.9% Asian alone 475 0.3% Other race alone 268 0.2% American Indian alone 104 0.07% Native Hawaiian and Other
71,682 47.0% Hispanic 51,258 33.6% White alone 21,176 13.9% Black alone 4,118 2.7% Two or more races 2,847 1.9% Asian alone 1,402 0.9% Other race alone 179 0.1% American Indian alone
2000 2022
10,458,509 65.4% White alone 2,682,715 16.8% Hispanic 2,264,268 14.2% Black alone 261,693 1.6% Asian alone 236,954 1.5% Two or more races 42,358 0.3% American Indian alone 28,994 0.2% Other race alone 6,887 0.04% Native Hawaiian and Other
11,309,403 50.8% White alone 6,025,039 27.1% Hispanic 3,241,015 14.6% Black alone 861,630 3.9% Two or more races 623,692 2.8% Asian alone 152,054 0.7% Other race alone 22,504 0.1% American Indian alone 9,486 0.04% Native Hawaiian and Other
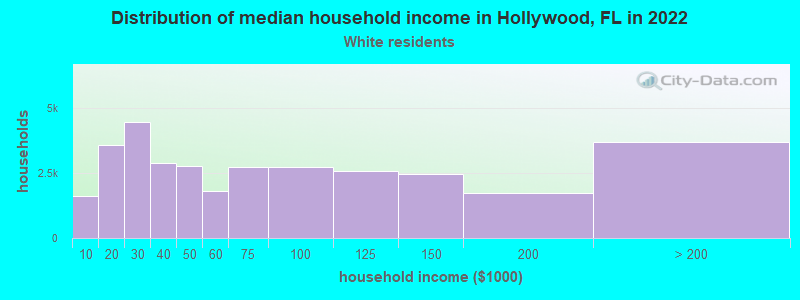
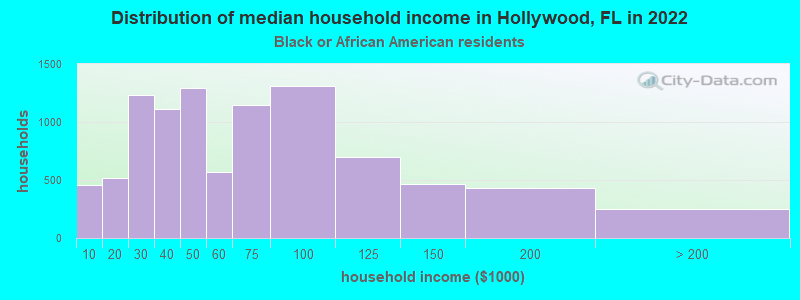
Income and house value in Hollywood Median household income in 2022 $60,231 White non-Hispanic householders$61,872 Black householders$167,131 American Indian and Alaska Native householders$50,683 Asian householders$75,504 Some other race householders$58,790 Two or more races householders$59,944 Hispanic or Latino race householdersMedian 2022 house value $467,050 White Non-Hispanic householders$345,124 Black or African American householders$422,966 American Indian or Alaska Native householders $395,165 Asian householders$595,727 Native Hawaiian and other Pacific Islander householders$344,330 Some other race householders$374,513 Two or more races householders$386,428 Hispanic or Latino householders
Median age by race in Hollywood
51.3 Median age for White residents49.6 53.0 37.3 Median age for Black or African American residents35.9 38.0 46.9 Median age for American Indian / Alaska Native residents30.4 79.3 43.8 Median age for Asian residents45.4 38.4 -666,666,666.0 Median age for Native Hawaiian / Pacific Islander residents-666,666,666.0 -666,666,666.0 34.8 Median age for Other race residents29.9 38.7 40.8 Median age for Two or more races residents39.3 44.6 56.2 Median age for White alone residents54.9 57.3 40.3 Median age for Hispanic or Latino residents37.7 44.3
Owner/renter occupied households by race in Hollywood
House owners and renters - White residents 23,308 70.6% Owner occupied9,705 29.4% Renter occupiedHouse owners and renters - Black or African American residents 3,052 36.8% Owner occupied5,243 63.2% Renter occupiedHouse owners and renters - American Indian / Alaska Native residents 88 63.2% Owner occupied51 36.8% Renter occupiedHouse owners and renters - Asian residents 523 42.0% Owner occupied721 58.0% Renter occupiedHouse owners and renters - Other race residents 2,365 54.6% Owner occupied1,966 45.4% Renter occupiedHouse owners and renters - Two or more races residents 7,596 44.9% Owner occupied9,320 55.1% Renter occupiedHouse owners and renters - White alone residents 20,428 77.0% Owner occupied6,096 23.0% Renter occupiedHouse owners and renters - Hispanic or Latino residents 12,425 47.1% Owner occupied13,963 52.9% Renter occupied
Language usage in Hollywood
English speakers - Total 47.4% of residents of Hollywood speak English at home.
39.9% of residents speak Spanish at home 32,389 55.6% Speak English very well25,898 44.4% Speak English less than very well12.7% of residents speak other language at home 12,271 65.9% Speak English very well6,349 34.1% Speak English less than very well
English speakers - Born in the United States 80.5% of residents of Hollywood speak English at home.
13.5% of residents speak Spanish at home 4,413 90.7% Speak English very well454 9.3% Speak English less than very well6.0% of residents speak other language at home 1,773 81.8% Speak English very well395 18.2% Speak English less than very well
English speakers - Native, born elsewhere 18.1% of residents of Hollywood speak English at home.
76.7% of residents speak Spanish at home 2,821 65.2% Speak English very well1,504 34.8% Speak English less than very well5.2% of residents speak other language at home 73 24.8% Speak English very well221 75.2% Speak English less than very well
English speakers - Foreign-born 14.9% of residents of Hollywood speak English at home.
63.3% of residents speak Spanish at home 17,435 43.2% Speak English very well22,965 56.8% Speak English less than very well21.8% of residents speak other language at home 8,158 58.7% Speak English very well5,733 41.3% Speak English less than very well
White (Caucasian) - Speak only English Native:
80.5% (37,083)Foreign-born:
18.1% (3,771)
White (Caucasian) - Speak another language Native:
19.5% (8,982)Foreign-born:
81.9% (17,014)
Black or African American - Speak only English Native:
89.8% (12,039)Foreign-born:
36.9% (2,872)
Black or African American - Speak another language Native:
10.2% (1,361)Foreign-born:
63.1% (4,917)
American Indian / Alaska Native - Speak another language Native:
30.4% (72)Foreign-born:
97.0% (42)
Asian - Speak only English Native:
37.2% (213)Foreign-born:
3.7% (96)
Asian - Speak another language Native:
62.8% (360)Foreign-born:
96.3% (2,478)
Other race - Speak only English Native:
41.4% (1,858)Foreign-born:
11.5% (842)
Other race - Speak another language Native:
58.6% (2,625)Foreign-born:
88.5% (6,478)
Two or more races - Speak only English Native:
47.3% (8,329)Foreign-born:
7.7% (1,942)
Two or more races - Speak another language Native:
52.7% (9,288)Foreign-born:
92.3% (23,340)
White alone - Speak only English Native:
88.3% (34,854)Foreign-born:
36.5% (3,703)
White alone - Speak another language Native:
11.7% (4,607)Foreign-born:
63.5% (6,437)
Hispanic or Latino - Speak only English Native:
35.8% (9,128)Foreign-born:
6.7% (2,834)
Hispanic or Latino - Speak another language Native:
64.2% (16,387)Foreign-born:
93.3% (39,710)
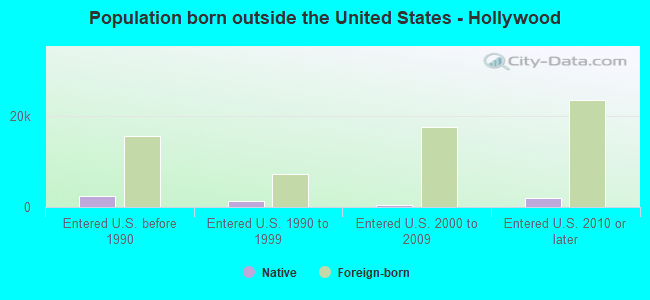
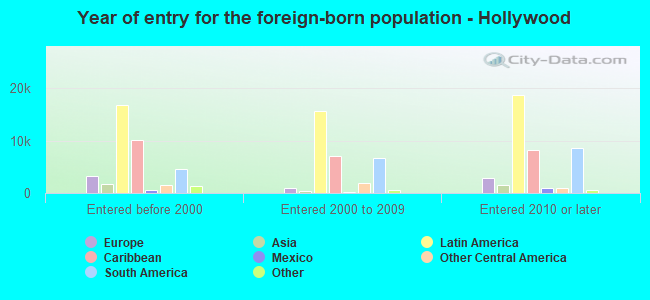
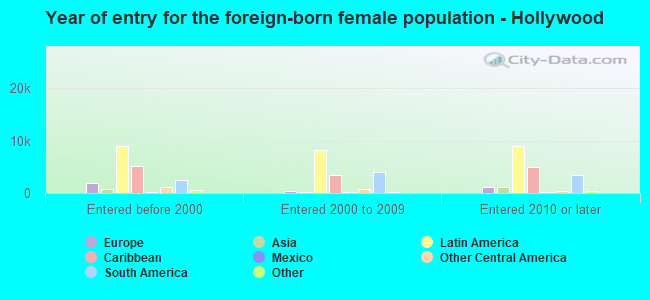
Foreign-born residents in Hollywood 61,769 residents are foreign born (30.6% Latin America ).
This city:
40.3%Florida:
21.1%
Marital status for residents in Hollywood Marital status - White (Caucasian) population 15 years and over
Males 37.0% Never married42.0% Now married2.4% Separated2.9% Widowed15.8% DivorcedFemales 21.1% Never married40.4% Now married4.6% Separated17.7% Widowed16.3% DivorcedWomen who gave birth in the past 12 months Now married:
87.2% (444)Unmarried:
12.8% (65)
Women who did not give birth in the past 12 months Now married:
43.6% (5,069)Unmarried:
56.4% (6,553)
Marital status - Black or African American population 15 years and over
Males 44.6% Never married45.1% Now married0.2% Separated1.2% Widowed9.0% DivorcedFemales 40.3% Never married36.1% Now married0.0% Separated4.9% Widowed18.6% DivorcedWomen who gave birth in the past 12 months Now married:
73.5% (133)Unmarried:
26.5% (48)
Women who did not give birth in the past 12 months Now married:
25.3% (1,696)Unmarried:
74.7% (5,007)
Marital status - American Indian / Alaska Native population 15 years and over
Males 30.9% Never married50.0% Now married0.0% Separated0.0% Widowed19.1% DivorcedFemales 28.2% Never married29.3% Now married0.0% Separated24.9% Widowed17.7% DivorcedWomen who did not give birth in the past 12 months Now married:
51.0% (87)Unmarried:
49.0% (83)
Marital status - Asian population 15 years and over
Males 24.1% Never married63.2% Now married2.7% Separated0.1% Widowed9.9% DivorcedFemales 32.4% Never married50.1% Now married0.0% Separated12.2% Widowed5.2% DivorcedWomen who gave birth in the past 12 months Now married:
0.0% (0)Unmarried:
100.0% (22)
Women who did not give birth in the past 12 months Now married:
49.5% (644)Unmarried:
50.5% (656)
Marital status - Other race population 15 years and over
Males 45.9% Never married45.5% Now married1.3% Separated0.0% Widowed7.2% DivorcedFemales 25.5% Never married52.0% Now married0.0% Separated11.3% Widowed11.2% DivorcedWomen who gave birth in the past 12 months Now married:
100.0% (113)Unmarried:
0.0% (0)
Women who did not give birth in the past 12 months Now married:
54.7% (1,553)Unmarried:
45.3% (1,286)
Marital status - Two or more races population 15 years and over
Males 34.8% Never married51.4% Now married2.3% Separated0.0% Widowed11.5% DivorcedFemales 28.5% Never married43.0% Now married1.3% Separated6.0% Widowed21.2% DivorcedWomen who gave birth in the past 12 months Now married:
15.3% (124)Unmarried:
84.7% (687)
Women who did not give birth in the past 12 months Now married:
38.4% (3,458)Unmarried:
61.6% (5,554)
Marital status - White alone, not Hispanic / Latino population 15 years and over
Males 30.6% Never married45.2% Now married2.5% Separated3.6% Widowed18.1% DivorcedFemales 18.5% Never married41.5% Now married2.4% Separated21.1% Widowed16.4% DivorcedWomen who gave birth in the past 12 months Now married:
100.0% (171)Unmarried:
0.0% (0)
Women who did not give birth in the past 12 months Now married:
46.8% (3,459)Unmarried:
53.2% (3,936)
Marital status - Hispanic or Latino population 15 years and over
Males 42.5% Never married44.9% Now married2.0% Separated0.2% Widowed10.5% DivorcedFemales 27.2% Never married42.7% Now married3.6% Separated6.6% Widowed19.8% DivorcedWomen who gave birth in the past 12 months Now married:
40.4% (510)Unmarried:
59.6% (752)
Women who did not give birth in the past 12 months Now married:
41.9% (6,399)Unmarried:
58.1% (8,864)
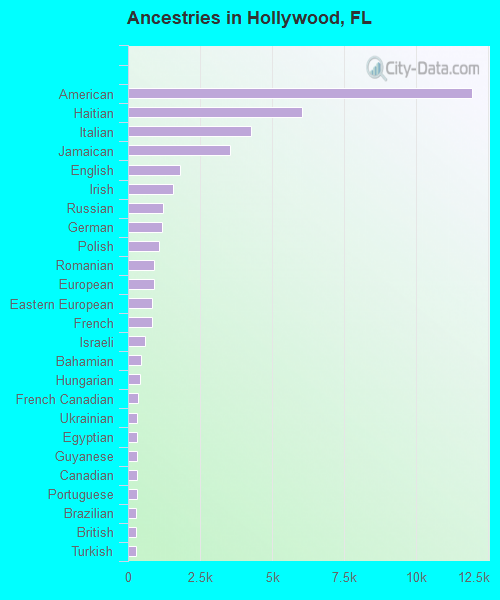
Ancestries in Hollywood
11,926 12.2% American6,021 6.1% Haitian4,252 4.3% Italian3,532 3.6% Jamaican1,799 1.8% English1,559 1.6% Irish1,208 1.2% Russian1,174 1.2% German1,073 1.1% Polish913 0.9% Romanian899 0.9% European845 0.9% Eastern European835 0.9% French589 0.6% Israeli453 0.5% Bahamian432 0.4% Hungarian336 0.3% French Canadian327 0.3% Ukrainian321 0.3% Egyptian317 0.3% Guyanese304 0.3% Canadian298 0.3% Portuguese294 0.3% Brazilian283 0.3% British267 0.3% Turkish262 0.3% Greek212 0.2% British West Indian209 0.2% Serbian193 0.2% Moroccan180 0.2% Lithuanian170 0.2% Czech155 0.2% West Indian137 0.1% Scottish136 0.1% Trinidadian and Tobagonian117 0.1% Lebanese115 0.1% Scotch-Irish109 0.1% Dutch99 0.1% Swedish96 0.10% Belizean92 0.09% Macedonian76 0.08% Slovak72 0.07% U.S. Virgin Islander68 0.07% Iranian65 0.07% Armenian65 0.07% Nigerian64 0.07% Welsh64 0.07% Danish62 0.06% African61 0.06% Arab61 0.06% Iraqi60 0.06% Belgian60 0.06% New Zealander58 0.06% Palestinian55 0.06% Norwegian54 0.06% Czechoslovakian50 0.05% Austrian44 0.04% Yugoslavian43 0.04% Finnish38 0.04% Icelander36 0.04% Scandinavian35 0.04% Ugandan29 0.03% South African28 0.03% Australian27 0.03% Cypriot23 0.02% Basque23 0.02% Croatian15 0.02% Slovene13 0.01% Albanian9 0.01% Bulgarian9 0.01% Swiss
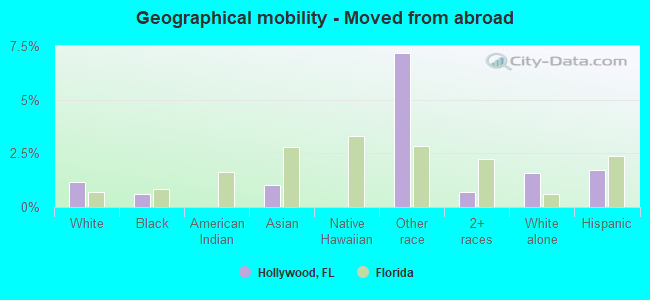
Geographical mobility in Hollywood Same house 1 year ago 63,182 92.0% White (Caucasian)20,211 93.3% Black or African American463 100.0% American Indian / Alaska Native3,371 91.4% Asian42 100.0% Native Hawaiian / Pacific Islander10,434 82.6% Other race38,620 86.0% Two or more races46,313 90.8% White alone, not Hispanic / Latino62,549 88.6% Hispanic or LatinoMoved within same county 3,574 5.2% White / Caucasian688 3.2% Black or African American69 1.9% Asian294 2.3% Other race2,953 6.6% Two or more races2,957 5.8% White alone, not Hispanic / Latino3,864 5.5% Hispanic or LatinoMoved within same state 721 1.0% White / Caucasian570 2.6% Black or African American7 1.4% American Indian / Alaska Native94 2.6% Asian509 4.0% Other race1,731 3.9% Two or more races517 1.0% White alone, not Hispanic / Latino1,467 2.1% Hispanic or LatinoMoved from different state 406 0.6% White / Caucasian76 0.4% Black or African American148 4.0% Asian485 3.8% Other race1,291 2.9% Two or more races406 0.8% White alone, not Hispanic / Latino1,515 2.1% Hispanic or LatinoMoved from abroad 807 1.2% White128 0.6% Black or African American38 1.0% Asian904 7.2% Other race314 0.7% Two or more races807 1.6% White alone, not Hispanic / Latino1,218 1.7% Hispanic or Latino
Children Nativity (place of birth) in Hollywood
Children under 6 years - Living with two parents Both parents native 1,785 100.0% NativeBoth parents foreign-born 739 92.5% Native60 7.5% Foreign-bornOne native, one foreign-born parent 404 100.0% NativeChildren under 6 years - Living with one parent Native parent 2,168 100.0% NativeForeign-born parent 1,284 80.9% Native303 19.1% Foreign-bornChildren 6 to 17 years - Living with two parents Both parents native 1,924 100.0% NativeBoth parents foreign-born 3,137 68.0% Native1,474 32.0% Foreign-bornOne native, one foreign-born parent 2,504 100.0% NativeChildren 6 to 17 years - Living with one parent Native parent 2,929 100.0% NativeForeign-born parent 3,987 54.2% Native3,364 45.8% Foreign-born
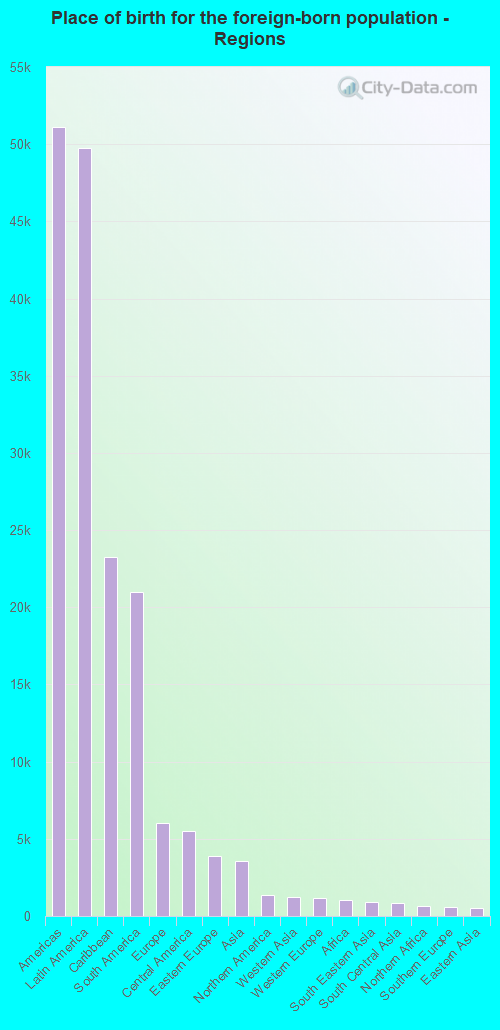
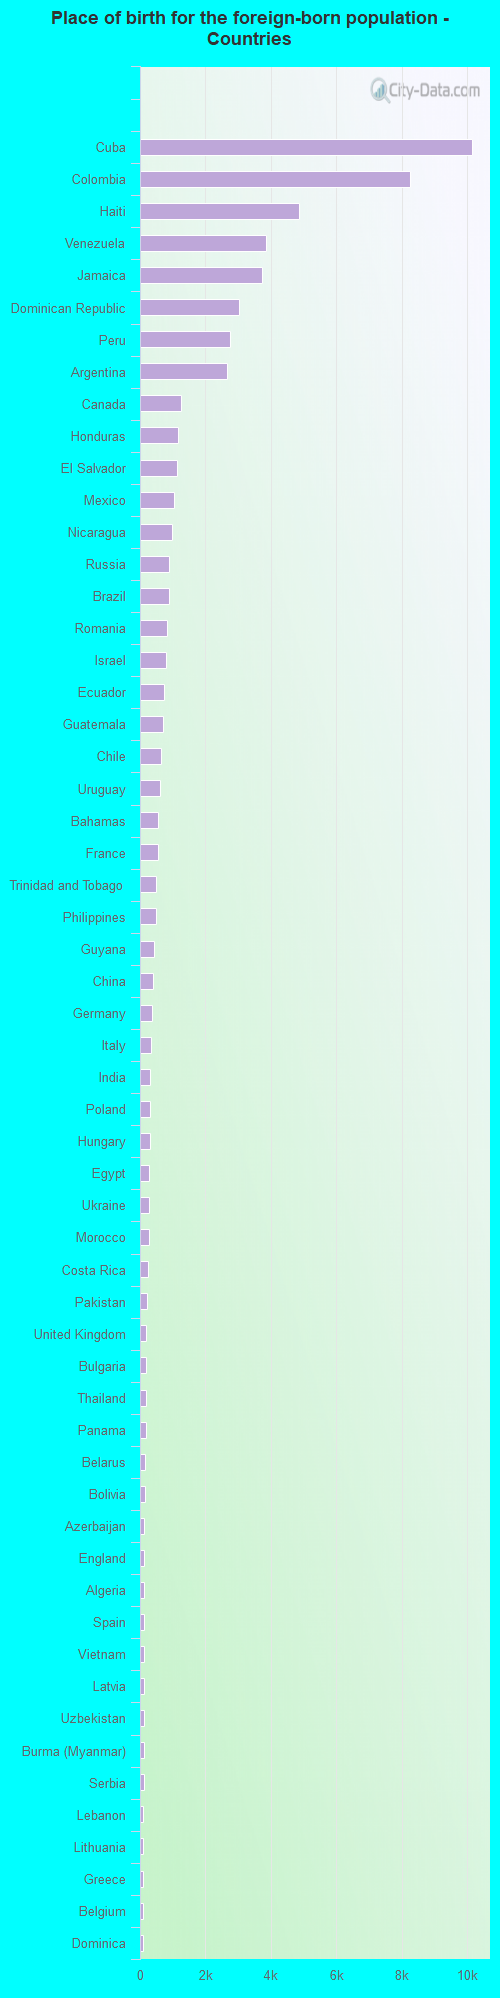
Place of birth for residents in Hollywood 51,106 Americas49,750 Latin America23,231 Caribbean20,987 South America6,000 Europe5,530 Central America3,866 Eastern Europe3,542 Asia1,356 Northern America1,263 Western Asia1,148 Western Europe1,019 Africa919 South Eastern Asia823 South Central Asia667 Northern Africa565 Southern Europe535 Eastern Asia419 Northern Europe397 China163 Eastern Africa99 Oceania99 Australia and New Zealand Subregion88 Southern Africa87 Western Africa12 Middle Africa10,163 Cuba8,254 Colombia4,861 Haiti3,848 Venezuela3,729 Jamaica3,018 Dominican Republic2,761 Peru2,672 Argentina1,241 Canada1,164 Honduras1,130 El Salvador1,046 Mexico988 Nicaragua902 Russia873 Brazil837 Romania793 Israel735 Ecuador691 Guatemala643 Chile604 Uruguay560 Bahamas559 France484 Trinidad and Tobago474 Philippines431 Guyana389 China374 Germany329 Italy317 India308 Poland294 Hungary276 Egypt274 Ukraine263 Morocco258 Costa Rica229 Pakistan198 United Kingdom179 Bulgaria176 Thailand175 Panama150 Belarus148 Bolivia137 Azerbaijan136 England127 Algeria125 Spain121 Vietnam120 Latvia119 Uzbekistan118 Burma (Myanmar)115 Serbia107 Lebanon104 Lithuania104 Greece101 Belgium97 Dominica88 South Africa88 Turkey82 North Macedonia (Macedonia)78 Moldova76 Japan76 Belize75 Netherlands71 New Zealand69 Iran68 Czechoslovakia65 Grenada64 Kenya61 Korea59 Nigeria53 Iraq53 Croatia38 Somalia32 Jordan28 Australia26 Senegal26 Ireland24 Ethiopia20 Zimbabwe18 Georgia15 Tanzania15 Malaysia14 Austria13 Cambodia13 Saudi Arabia11 Switzerland11 Sweden10 Bosnia and Herzegovina10 Kuwait8 Hong Kong7 Kazakhstan6 Portugal5 Scotland
Grandparents responsible for own grandchildren in Hollywood
Grandparents (30 to 59 years) White / Caucasian 109 28.1% Responsible for grandchildren280 71.9% Not responsible for grandchildrenBlack or African American 89 39.8% Responsible for grandchildren135 60.2% Not responsible for grandchildrenAsian 48 100.0% Not responsible for grandchildrenOther race 92 71.3% Responsible for grandchildren37 28.7% Not responsible for grandchildrenTwo or more races 114 31.0% Responsible for grandchildren254 69.0% Not responsible for grandchildrenWhite alone, not Hispanic / Latino 127 59.6% Responsible for grandchildren86 40.4% Not responsible for grandchildrenHispanic or Latino 186 23.5% Responsible for grandchildren604 76.5% Not responsible for grandchildrenGrandparents (60 years and over) White / Caucasian 98 16.9% Responsible for grandchildren484 83.1% Not responsible for grandchildrenBlack or African American 282 49.4% Responsible for grandchildren289 50.6% Not responsible for grandchildrenAsian 65 43.4% Responsible for grandchildren85 56.6% Not responsible for grandchildrenOther race 124 100.0% Not responsible for grandchildrenTwo or more races 13 2.3% Responsible for grandchildren550 97.7% Not responsible for grandchildrenWhite alone, not Hispanic / Latino 67 14.3% Responsible for grandchildren404 85.7% Not responsible for grandchildrenHispanic or Latino 55 7.3% Responsible for grandchildren699 92.7% Not responsible for grandchildren