Races in Holt, Michigan (MI) Detailed Stats
Data:
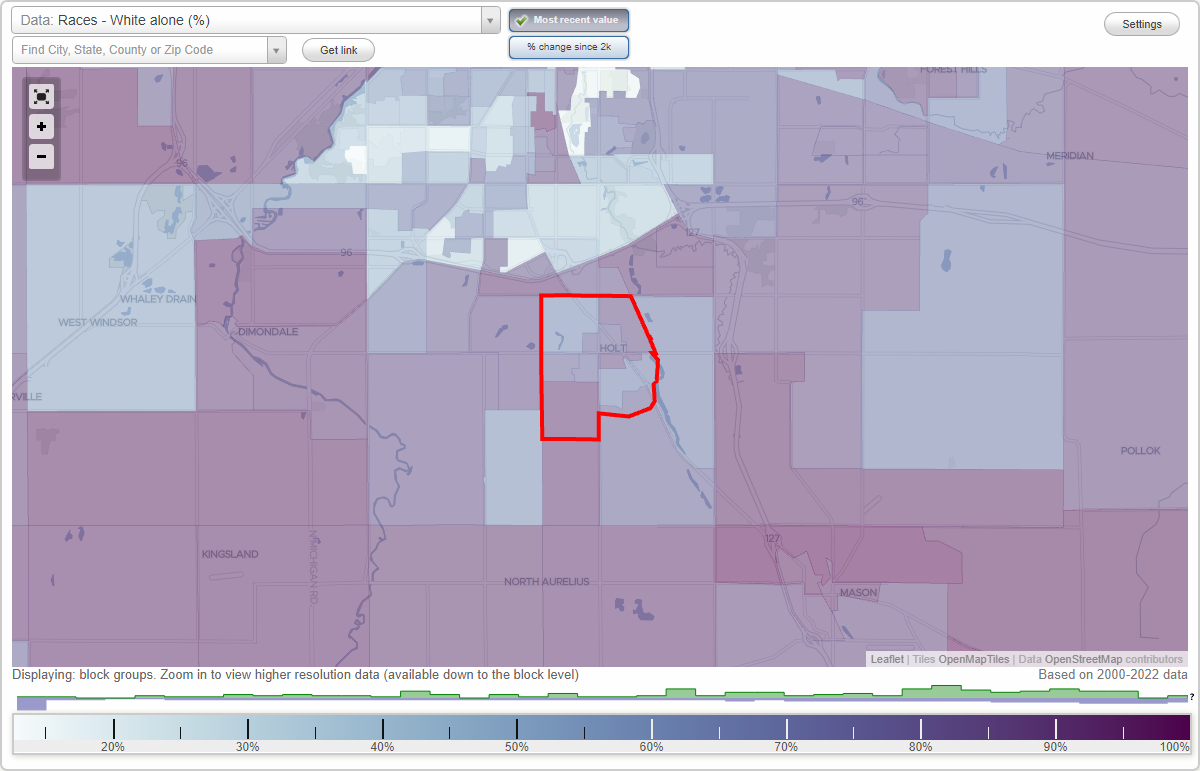
Races - White alone (%)
Races - White alone (% change since 2000)
Races - Black alone (%)
Races - Black alone (% change since 2000)
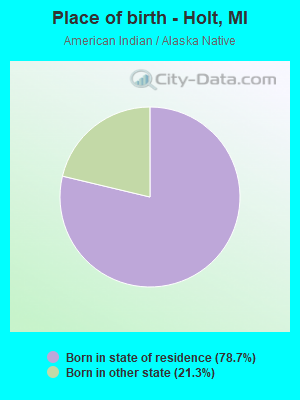
Races - American Indian alone (%)
Races - American Indian alone (% change since 2000)
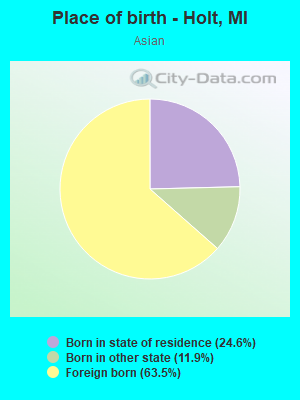
Races - Asian alone (%)
Races - Asian alone (% change since 2000)
Races - Hispanic (%)
Races - Hispanic (% change since 2000)
Races - Native Hawaiian and Other Pacific Islander alone (%)
Races - Native Hawaiian and Other Pacific Islander alone (% change since 2000)
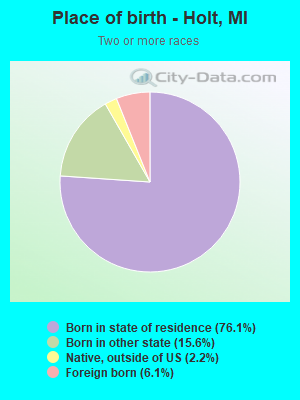
Races - Two or more races(%)
Races - Two or more races(% change since 2000)
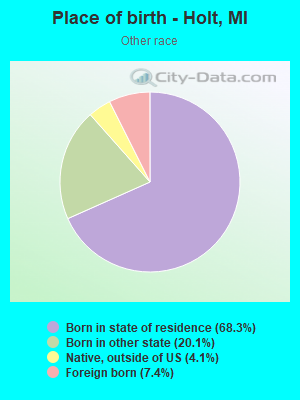
Races - Other race alone (%)
Races - Other race alone (% change since 2000)
Racial diversity
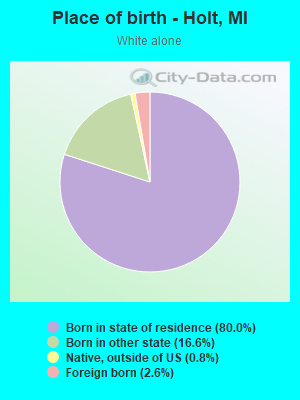
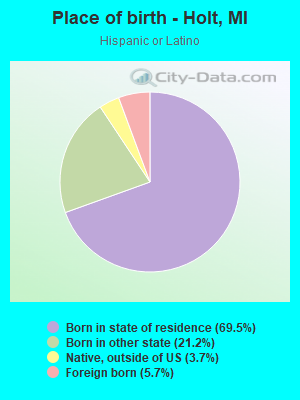
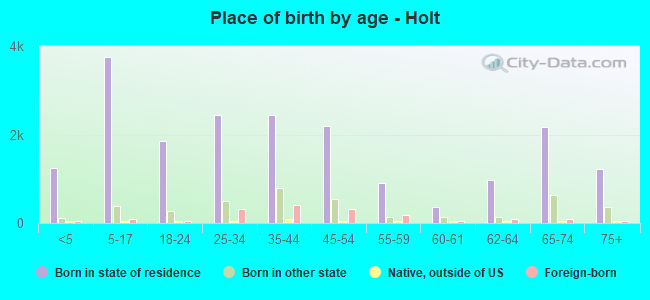
Place of birth - Born in state of residence (%)
Place of birth - Born in state of residence (%) - White
Place of birth - Born in state of residence (%) - Black or African American
Place of birth - Born in state of residence (%) - Asian
Place of birth - Born in state of residence (%) - Hispanic or Latino
Place of birth - Born in state of residence (%) - American Indian and Alaska Native
Place of birth - Born in state of residence (%) - Multirace
Place of birth - Born in state of residence (%) - Other Race
Place of birth - Born in other state (%)
Place of birth - Born in other state (%) - White
Place of birth - Born in other state (%) - Black or African American
Place of birth - Born in other state (%) - Asian
Place of birth - Born in other state (%) - Hispanic or Latino
Place of birth - Born in other state (%) - American Indian and Alaska Native
Place of birth - Born in other state (%) - Multirace
Place of birth - Born in other state (%) - Other Race
Place of birth - Native, outside of US (%)
Place of birth - Native, outside of US (%) - White
Place of birth - Native, outside of US (%) - Black or African American
Place of birth - Native, outside of US (%) - Asian
Place of birth - Native, outside of US (%) - Hispanic or Latino
Place of birth - Native, outside of US (%) - American Indian and Alaska Native
Place of birth - Native, outside of US (%) - Multirace
Place of birth - Native, outside of US (%) - Other Race
Place of birth - Foreign born (%)
Place of birth - Foreign born (%) - White
Place of birth - Foreign born (%) - Black or African American
Place of birth - Foreign born (%) - Asian
Place of birth - Foreign born (%) - Hispanic or Latino
Place of birth - Foreign born (%) - American Indian and Alaska Native
Place of birth - Foreign born (%) - Multirace
Place of birth - Foreign born (%) - Other Race
Residents speaking English at home (%)
Residents speaking English at home - Born in the United States (%)
Residents speaking English at home - Native, born elsewhere (%)
Residents speaking English at home - Foreign born (%)
Residents speaking Spanish at home (%)
Residents speaking Spanish at home - Born in the United States (%)
Residents speaking Spanish at home - Native, born elsewhere (%)
Residents speaking Spanish at home - Foreign born (%)
Residents speaking other language at home (%)
Residents speaking other language at home - Born in the United States (%)
Residents speaking other language at home - Native, born elsewhere (%)
Residents speaking other language at home - Foreign born (%)
Marital status - Never married (%)
Marital status - Now married (%)
Marital status - Separated (%)
Marital status - Widowed (%)
Marital status - Divorced (%)
Ancestries Reported - Arab (%)
Ancestries Reported - Czech (%)
Ancestries Reported - Danish (%)
Ancestries Reported - Dutch (%)
Ancestries Reported - English (%)
Ancestries Reported - French (%)
Ancestries Reported - French Canadian (%)
Ancestries Reported - German (%)
Ancestries Reported - Greek (%)
Ancestries Reported - Hungarian (%)
Ancestries Reported - Irish (%)
Ancestries Reported - Italian (%)
Ancestries Reported - Lithuanian (%)
Ancestries Reported - Norwegian (%)
Ancestries Reported - Polish (%)
Ancestries Reported - Portuguese (%)
Ancestries Reported - Russian (%)
Ancestries Reported - Scotch-Irish (%)
Ancestries Reported - Scottish (%)
Ancestries Reported - Slovak (%)
Ancestries Reported - Subsaharan African (%)
Ancestries Reported - Swedish (%)
Ancestries Reported - Swiss (%)
Ancestries Reported - Ukrainian (%)
Ancestries Reported - United States (%)
Ancestries Reported - Welsh (%)
Ancestries Reported - West Indian (%)
Ancestries Reported - Other (%)
Geographical mobility - Same house 1 year ago (%)
Geographical mobility - Same house 1 year ago (%) - White
Geographical mobility - Same house 1 year ago (%) - Black or African American
Geographical mobility - Same house 1 year ago (%) - Asian
Geographical mobility - Same house 1 year ago (%) - Hispanic or Latino
Geographical mobility - Same house 1 year ago (%) - American Indian and Alaska Native
Geographical mobility - Same house 1 year ago (%) - Multirace
Geographical mobility - Same house 1 year ago (%) - Other Race
Geographical mobility - Moved within same county (%)
Geographical mobility - Moved within same county (%) - White
Geographical mobility - Moved within same county (%) - Black or African American
Geographical mobility - Moved within same county (%) - Asian
Geographical mobility - Moved within same county (%) - Hispanic or Latino
Geographical mobility - Moved within same county (%) - American Indian and Alaska Native
Geographical mobility - Moved within same county (%) - Multirace
Geographical mobility - Moved within same county (%) - Other Race
Geographical mobility - Moved from different county within same state (%)
Geographical mobility - Moved from different county within same state (%) - White
Geographical mobility - Moved from different county within same state (%) - Black or African American
Geographical mobility - Moved from different county within same state (%) - Asian
Geographical mobility - Moved from different county within same state (%) - Hispanic or Latino
Geographical mobility - Moved from different county within same state (%) - American Indian and Alaska Native
Geographical mobility - Moved from different county within same state (%) - Multirace
Geographical mobility - Moved from different county within same state (%) - Other Race
Geographical mobility - Moved from different state (%)
Geographical mobility - Moved from different state (%) - White
Geographical mobility - Moved from different state (%) - Black or African American
Geographical mobility - Moved from different state (%) - Asian
Geographical mobility - Moved from different state (%) - Hispanic or Latino
Geographical mobility - Moved from different state (%) - American Indian and Alaska Native
Geographical mobility - Moved from different state (%) - Multirace
Geographical mobility - Moved from different state (%) - Other Race
Geographical mobility - Moved from abroad (%)
Geographical mobility - Moved from abroad (%) - White
Geographical mobility - Moved from abroad (%) - Black or African American
Geographical mobility - Moved from abroad (%) - Asian
Geographical mobility - Moved from abroad (%) - Hispanic or Latino
Geographical mobility - Moved from abroad (%) - American Indian and Alaska Native
Geographical mobility - Moved from abroad (%) - Multirace
Geographical mobility - Moved from abroad (%) - Other Race
Place of birth for the foreign-born population - Ireland (%)
Place of birth for the foreign-born population - Denmark (%)
Place of birth for the foreign-born population - Norway (%)
Place of birth for the foreign-born population - Sweden (%)
Place of birth for the foreign-born population - United Kingdom (%)
Place of birth for the foreign-born population - England (%)
Place of birth for the foreign-born population - Scotland (%)
Place of birth for the foreign-born population - Other Northern Europe (%)
Place of birth for the foreign-born population - Austria (%)
Place of birth for the foreign-born population - Belgium (%)
Place of birth for the foreign-born population - France (%)
Place of birth for the foreign-born population - Germany (%)
Place of birth for the foreign-born population - Netherlands (%)
Place of birth for the foreign-born population - Switzerland (%)
Place of birth for the foreign-born population - Other Western Europe (%)
Place of birth for the foreign-born population - Greece (%)
Place of birth for the foreign-born population - Italy (%)
Place of birth for the foreign-born population - Portugal (%)
Place of birth for the foreign-born population - Spain (%)
Place of birth for the foreign-born population - Other Southern Europe (%)
Place of birth for the foreign-born population - Albania (%)
Place of birth for the foreign-born population - Belarus (%)
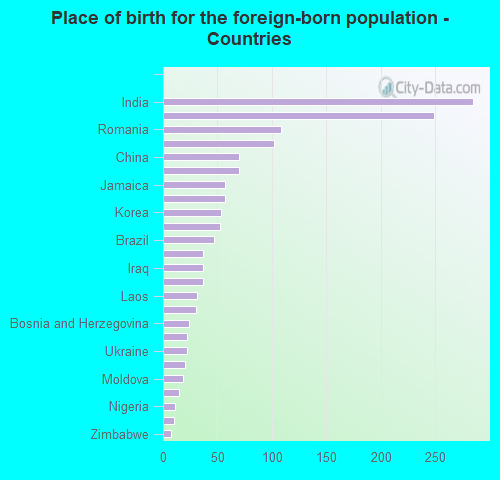
Place of birth for the foreign-born population - Bosnia and Herzegovina (%)
Place of birth for the foreign-born population - Bulgaria (%)
Place of birth for the foreign-born population - Croatia (%)
Place of birth for the foreign-born population - Czechoslovakia (%)
Place of birth for the foreign-born population - Hungary (%)
Place of birth for the foreign-born population - Latvia (%)
Place of birth for the foreign-born population - Lithuania (%)
Place of birth for the foreign-born population - North Macedonia (Macedonia) (%)
Place of birth for the foreign-born population - Moldova (%)
Place of birth for the foreign-born population - Poland (%)
Place of birth for the foreign-born population - Romania (%)
Place of birth for the foreign-born population - Russia (%)
Place of birth for the foreign-born population - Serbia (%)
Place of birth for the foreign-born population - Ukraine (%)
Place of birth for the foreign-born population - Other Eastern Europe (%)
Place of birth for the foreign-born population - China (%)
Place of birth for the foreign-born population - Hong Kong (%)
Place of birth for the foreign-born population - Taiwan (%)
Place of birth for the foreign-born population - Japan (%)
Place of birth for the foreign-born population - Korea (%)
Place of birth for the foreign-born population - Other Eastern Asia (%)
Place of birth for the foreign-born population - Afghanistan (%)
Place of birth for the foreign-born population - Bangladesh (%)
Place of birth for the foreign-born population - India (%)
Place of birth for the foreign-born population - Iran (%)
Place of birth for the foreign-born population - Kazakhstan (%)
Place of birth for the foreign-born population - Nepal (%)
Place of birth for the foreign-born population - Pakistan (%)
Place of birth for the foreign-born population - Sri Lanka (%)
Place of birth for the foreign-born population - Uzbekistan (%)
Place of birth for the foreign-born population - Other South Central Asia (%)
Place of birth for the foreign-born population - Burma (%)
Place of birth for the foreign-born population - Cambodia (%)
Place of birth for the foreign-born population - Indonesia (%)
Place of birth for the foreign-born population - Laos (%)
Place of birth for the foreign-born population - Malaysia (%)
Place of birth for the foreign-born population - Philippines (%)
Place of birth for the foreign-born population - Singapore (%)
Place of birth for the foreign-born population - Thailand (%)
Place of birth for the foreign-born population - Vietnam (%)
Place of birth for the foreign-born population - Other South Eastern Asia (%)
Place of birth for the foreign-born population - Armenia (%)
Place of birth for the foreign-born population - Iraq (%)
Place of birth for the foreign-born population - Israel (%)
Place of birth for the foreign-born population - Jordan (%)
Place of birth for the foreign-born population - Kuwait (%)
Place of birth for the foreign-born population - Lebanon (%)
Place of birth for the foreign-born population - Saudi Arabia (%)
Place of birth for the foreign-born population - Syria (%)
Place of birth for the foreign-born population - Turkey (%)
Place of birth for the foreign-born population - Yemen (%)
Place of birth for the foreign-born population - Other Western Asia (%)
Place of birth for the foreign-born population - Eritrea (%)
Place of birth for the foreign-born population - Ethiopia (%)
Place of birth for the foreign-born population - Kenya (%)
Place of birth for the foreign-born population - Somalia (%)
Place of birth for the foreign-born population - Uganda (%)
Place of birth for the foreign-born population - Zimbabwe (%)
Place of birth for the foreign-born population - Other Eastern Africa (%)
Place of birth for the foreign-born population - Cameroon (%)
Place of birth for the foreign-born population - Congo (%)
Place of birth for the foreign-born population - Democratic Republic of Congo (Zaire) (%)
Place of birth for the foreign-born population - Other Middle Africa (%)
Place of birth for the foreign-born population - Egypt (%)
Place of birth for the foreign-born population - Morocco (%)
Place of birth for the foreign-born population - Sudan (%)
Place of birth for the foreign-born population - Other Northern Africa (%)
Place of birth for the foreign-born population - South Africa (%)
Place of birth for the foreign-born population - Other Southern Africa (%)
Place of birth for the foreign-born population - Cabo Verde (%)
Place of birth for the foreign-born population - Ghana (%)
Place of birth for the foreign-born population - Liberia (%)
Place of birth for the foreign-born population - Nigeria (%)
Place of birth for the foreign-born population - Senegal (%)
Place of birth for the foreign-born population - Sierra Leone (%)
Place of birth for the foreign-born population - Other Western Africa (%)
Place of birth for the foreign-born population - Australia (%)
Place of birth for the foreign-born population - New Zealand (%)
Place of birth for the foreign-born population - Fiji (%)
Place of birth for the foreign-born population - Micronesia (%)
Place of birth for the foreign-born population - Bahamas (%)
Place of birth for the foreign-born population - Barbados (%)
Place of birth for the foreign-born population - Cuba (%)
Place of birth for the foreign-born population - Dominica (%)
Place of birth for the foreign-born population - Dominican Republic (%)
Place of birth for the foreign-born population - Grenada (%)
Place of birth for the foreign-born population - Haiti (%)
Place of birth for the foreign-born population - Jamaica (%)
Place of birth for the foreign-born population - St. Vincent and the Grenadines (%)
Place of birth for the foreign-born population - Trinidad and Tobago (%)
Place of birth for the foreign-born population - West Indies (%)
Place of birth for the foreign-born population - Other Caribbean (%)
Place of birth for the foreign-born population - Belize (%)
Place of birth for the foreign-born population - Costa Rica (%)
Place of birth for the foreign-born population - El Salvador (%)
Place of birth for the foreign-born population - Guatemala (%)
Place of birth for the foreign-born population - Honduras (%)
Place of birth for the foreign-born population - Mexico (%)
Place of birth for the foreign-born population - Nicaragua (%)
Place of birth for the foreign-born population - Panama (%)
Place of birth for the foreign-born population - Other Central America (%)
Place of birth for the foreign-born population - Argentina (%)
Place of birth for the foreign-born population - Bolivia (%)
Place of birth for the foreign-born population - Brazil (%)
Place of birth for the foreign-born population - Chile (%)
Place of birth for the foreign-born population - Colombia (%)
Place of birth for the foreign-born population - Ecuador (%)
Place of birth for the foreign-born population - Guyana (%)
Place of birth for the foreign-born population - Peru (%)
Place of birth for the foreign-born population - Uruguay (%)
Place of birth for the foreign-born population - Venezuela (%)
Place of birth for the foreign-born population - Other South America (%)
Place of birth for the foreign-born population - Canada (%)
Place of birth for the foreign-born population - Other Northern America (%)
Place of birth for the foreign-born population - Other (%)
Latest news about races in Holt, MI collected exclusively by city-data.com from local newspapers, TV, and radio stations
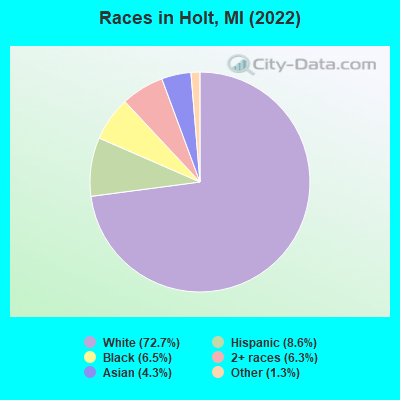
According to 2022 data, the most numerous races in Holt, MI are White alone (18,543 residents), Black alone (1,648 residents), and Hispanic (2,206 residents). 92.3% of Holt residents speak English at home. 6.3% of Holt, MI residents are foreign-born (3.6% born in Asia, 1.2% born in Latin America, 1.0% born in Europe), which is 5.3% greater than the foreign-born rate of 6.0% across the entire state of Michigan.
Race distribution in Holt
2000 2022
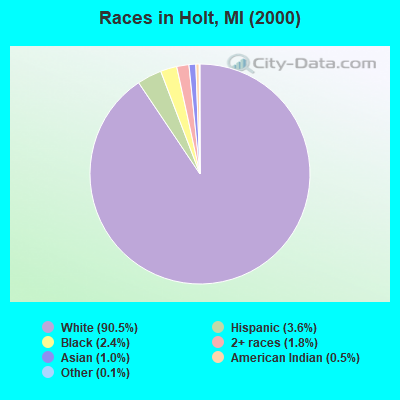
7,806,691 78.6% White alone 1,402,047 14.1% Black alone 323,877 3.3% Hispanic 175,311 1.8% Asian alone 163,487 1.6% Two or more races 53,421 0.5% American Indian alone 11,465 0.1% Other race alone 2,145 0.02% Native Hawaiian and Other
7,289,051 72.6% White alone 1,310,464 13.1% Black alone 572,405 5.7% Hispanic 450,031 4.5% Two or more races 335,732 3.3% Asian alone 45,217 0.5% Other race alone 29,011 0.3% American Indian alone 2,207 0.02% Native Hawaiian and Other
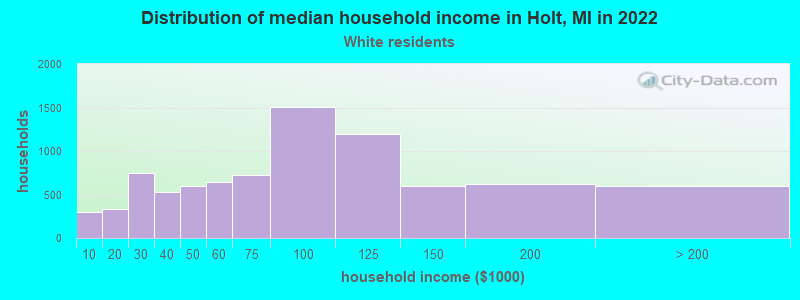
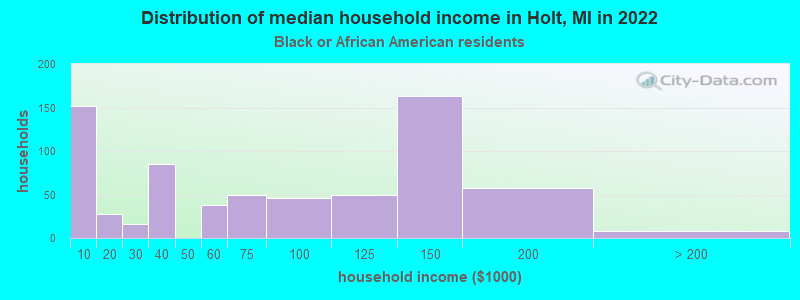
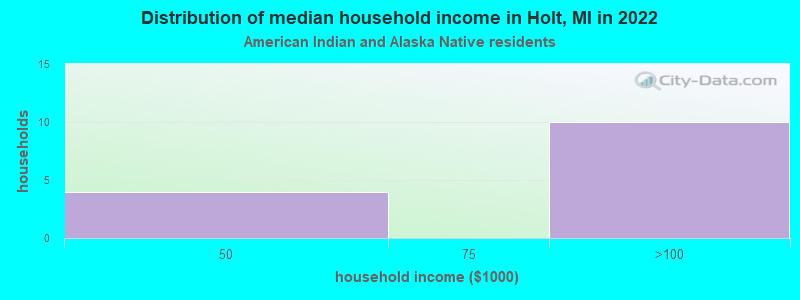
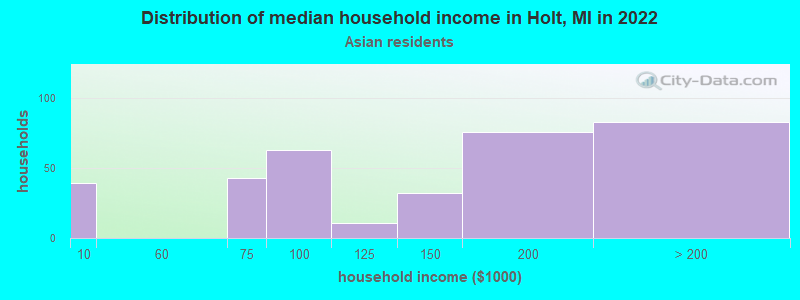
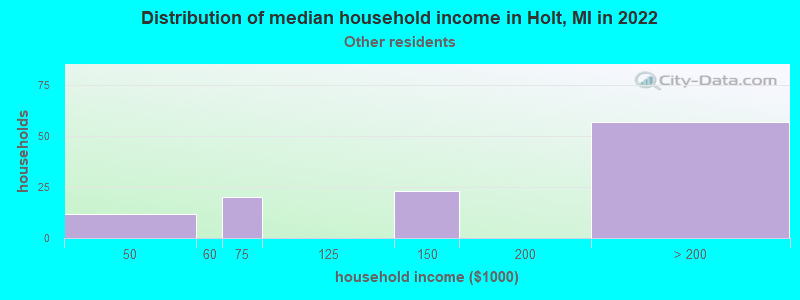
Income and house value in Holt Median household income in 2022 $80,458 White non-Hispanic householders$127,349 Asian householders$128,964 Two or more races householders$68,816 Hispanic or Latino race householdersMedian 2022 house value $221,779 White Non-Hispanic householders$253,003 Black or African American householders$298,557 American Indian or Alaska Native householders$197,398 Some other race householders$254,072 Two or more races householders$192,479 Hispanic or Latino householders
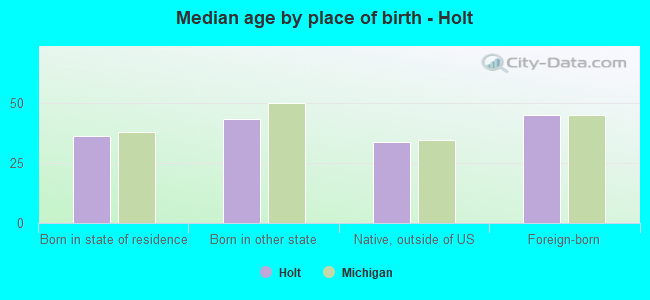
Median age by race in Holt
42.9 Median age for White residents40.4 44.8 29.9 Median age for Black or African American residents23.0 44.0 72.2 Median age for American Indian / Alaska Native residents-623,868,312.1 118.4 29.5 Median age for Asian residents29.7 31.2 -666,666,666.0 Median age for Native Hawaiian / Pacific Islander residents-666,666,666.0 -666,666,666.0 23.7 Median age for Other race residents32.0 17.5 22.7 Median age for Two or more races residents30.9 22.0 42.9 Median age for White alone residents40.5 45.5 20.9 Median age for Hispanic or Latino residents22.5 20.5
Owner/renter occupied households by race in Holt
House owners and renters - White residents 6,075 72.1% Owner occupied2,356 27.9% Renter occupiedHouse owners and renters - Black or African American residents 252 30.7% Owner occupied569 69.3% Renter occupiedHouse owners and renters - American Indian / Alaska Native residents 21 100.0% Owner occupiedHouse owners and renters - Asian residents 159 44.8% Owner occupied196 55.2% Renter occupiedHouse owners and renters - Other race residents 76 49.5% Owner occupied78 50.5% Renter occupiedHouse owners and renters - Two or more races residents 511 61.9% Owner occupied314 38.1% Renter occupiedHouse owners and renters - White alone residents 6,037 71.8% Owner occupied2,376 28.2% Renter occupiedHouse owners and renters - Hispanic or Latino residents 290 53.7% Owner occupied250 46.3% Renter occupied
Language usage in Holt
English speakers - Total 92.3% of residents of Holt speak English at home.
1.8% of residents speak Spanish at home 337 77.1% Speak English very well100 22.9% Speak English less than very well5.2% of residents speak other language at home 750 60.0% Speak English very well499 40.0% Speak English less than very well
English speakers - Born in the United States 92.1% of residents of Holt speak English at home.
6.3% of residents speak Spanish at home 129 52.0% Speak English very well119 48.0% Speak English less than very well0.7% of residents speak other language at home 26 100.0% Speak English very well
English speakers - Native, born elsewhere 67.9% of residents of Holt speak English at home.
9.9% of residents speak Spanish at home 26 100.0% Speak English less than very well9.5% of residents speak other language at home 25 100.0% Speak English very well
English speakers - Foreign-born 29.2% of residents of Holt speak English at home.
10.9% of residents speak Spanish at home 173 100.0% Speak English very well61.0% of residents speak other language at home 520 53.9% Speak English very well444 46.1% Speak English less than very well
White (Caucasian) - Speak only English Native:
99.0% (17,229)Foreign-born:
36.3% (150)
White (Caucasian) - Speak another language Native:
1.0% (169)Foreign-born:
64.0% (265)
Black or African American - Speak only English Native:
97.2% (1,675)Foreign-born:
67.7% (137)
Black or African American - Speak another language Native:
1.2% (20)Foreign-born:
37.6% (76)
Asian - Speak only English Native:
65.9% (222)Foreign-born:
16.7% (119)
Asian - Speak another language Native:
31.0% (104)Foreign-born:
83.7% (596)
Other race - Speak only English Native:
80.6% (569)Foreign-born:
59.2% (38)
Other race - Speak another language Native:
19.9% (141)Foreign-born:
56.5% (37)
Two or more races - Speak only English Native:
91.1% (2,273)Foreign-born:
13.7% (26)
Two or more races - Speak another language Native:
8.3% (207)Foreign-born:
73.9% (139)
White alone - Speak only English Native:
98.8% (17,158)Foreign-born:
31.2% (154)
White alone - Speak another language Native:
1.0% (168)Foreign-born:
68.9% (339)
Hispanic or Latino - Speak only English Native:
83.4% (1,476)Foreign-born:
68.4% (82)
Hispanic or Latino - Speak another language Native:
15.2% (269)Foreign-born:
59.0% (70)
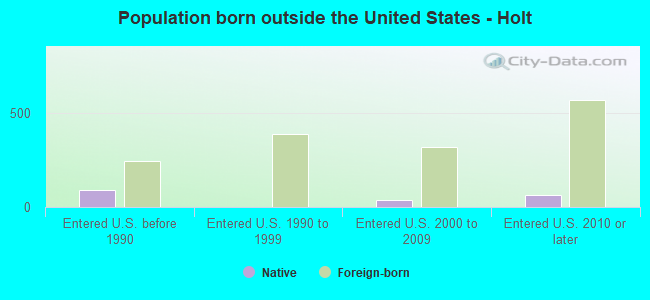
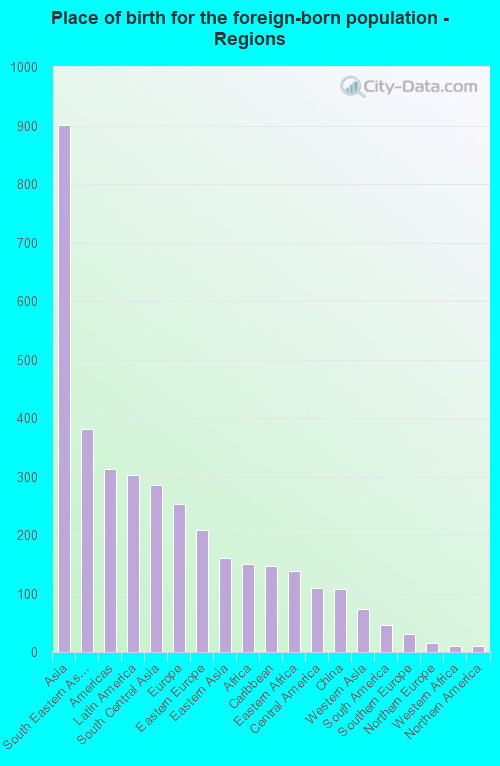
Foreign-born residents in Holt 1,617 residents are foreign born (3.6% Asia , 1.2% Latin America , 1.0% Europe ).
This city:
6.3%Michigan:
6.9%
Marital status for residents in Holt Marital status - White (Caucasian) population 15 years and over
Males 30.6% Never married55.6% Now married1.1% Separated2.2% Widowed10.4% DivorcedFemales 25.1% Never married50.6% Now married0.9% Separated8.9% Widowed14.5% DivorcedWomen who gave birth in the past 12 months Now married:
51.4% (110)Unmarried:
48.6% (104)
Women who did not give birth in the past 12 months Now married:
46.6% (1,773)Unmarried:
53.4% (2,032)
Marital status - Black or African American population 15 years and over
Males 35.8% Never married45.2% Now married3.4% Separated0.0% Widowed15.6% DivorcedFemales 61.5% Never married27.2% Now married0.0% Separated6.8% Widowed4.4% DivorcedWomen who gave birth in the past 12 months Now married:
19.9% (34)Unmarried:
80.1% (135)
Women who did not give birth in the past 12 months Now married:
25.1% (133)Unmarried:
74.9% (395)
Marital status - American Indian / Alaska Native population 15 years and over
Males 0.0% Never married0.0% Now married0.0% Separated0.0% Widowed100.0% DivorcedFemales 0.0% Never married100.0% Now married0.0% Separated0.0% Widowed0.0% DivorcedMarital status - Asian population 15 years and over
Males 46.2% Never married48.4% Now married0.0% Separated3.2% Widowed2.2% DivorcedFemales 15.2% Never married74.2% Now married0.0% Separated0.0% Widowed10.6% DivorcedWomen who gave birth in the past 12 months Now married:
100.0% (16)Unmarried:
0.0% (0)
Women who did not give birth in the past 12 months Now married:
56.6% (131)Unmarried:
43.4% (100)
Marital status - Other race population 15 years and over
Males 65.6% Never married30.6% Now married0.0% Separated0.0% Widowed3.8% DivorcedFemales 40.0% Never married45.7% Now married0.0% Separated0.0% Widowed14.3% DivorcedWomen who did not give birth in the past 12 months Now married:
53.3% (76)Unmarried:
46.7% (67)
Marital status - Two or more races population 15 years and over
Males 33.6% Never married44.3% Now married0.0% Separated0.0% Widowed22.1% DivorcedFemales 54.6% Never married29.8% Now married0.0% Separated1.6% Widowed14.0% DivorcedWomen who gave birth in the past 12 months Now married:
100.0% (76)Unmarried:
0.0% (0)
Women who did not give birth in the past 12 months Now married:
23.6% (214)Unmarried:
76.4% (693)
Marital status - White alone, not Hispanic / Latino population 15 years and over
Males 30.7% Never married55.9% Now married1.0% Separated2.1% Widowed10.3% DivorcedFemales 24.9% Never married50.8% Now married0.9% Separated8.9% Widowed14.5% DivorcedWomen who gave birth in the past 12 months Now married:
51.4% (114)Unmarried:
48.6% (108)
Women who did not give birth in the past 12 months Now married:
46.8% (1,786)Unmarried:
53.2% (2,031)
Marital status - Hispanic or Latino population 15 years and over
Males 44.4% Never married43.8% Now married2.1% Separated1.8% Widowed8.0% DivorcedFemales 60.0% Never married32.9% Now married0.0% Separated1.8% Widowed5.3% DivorcedWomen who gave birth in the past 12 months Now married:
100.0% (29)Unmarried:
0.0% (0)
Women who did not give birth in the past 12 months Now married:
27.4% (159)Unmarried:
72.6% (424)
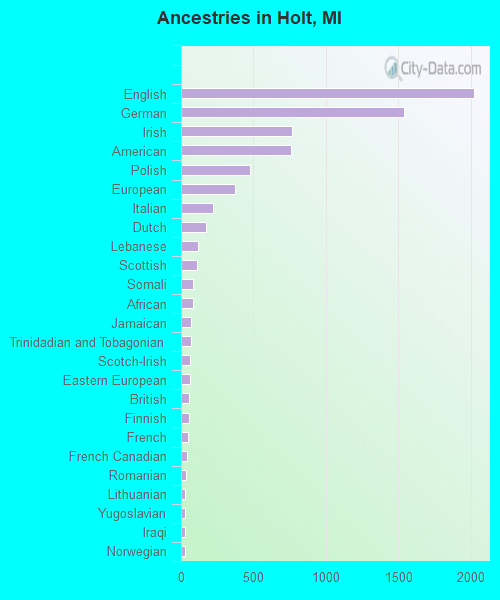
Ancestries in Holt
2,023 20.0% English1,541 15.2% German767 7.6% Irish761 7.5% American474 4.7% Polish373 3.7% European224 2.2% Italian173 1.7% Dutch117 1.2% Lebanese112 1.1% Scottish84 0.8% Somali81 0.8% African70 0.7% Jamaican66 0.7% Trinidadian and Tobagonian61 0.6% Scotch-Irish59 0.6% Eastern European55 0.5% British52 0.5% Finnish46 0.5% French43 0.4% French Canadian36 0.4% Romanian30 0.3% Lithuanian30 0.3% Yugoslavian27 0.3% Iraqi25 0.2% Norwegian25 0.2% Ukrainian22 0.2% Brazilian20 0.2% Hungarian17 0.2% Belgian17 0.2% Swiss16 0.2% Portuguese15 0.1% Swedish14 0.1% Slovak14 0.1% Nigerian13 0.1% Austrian13 0.1% Canadian13 0.1% West Indian10 0.10% Czech8 0.08% Slavic
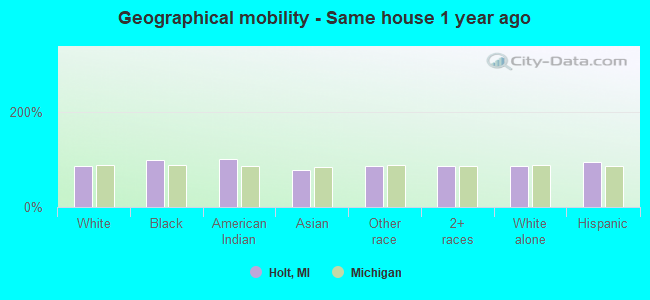
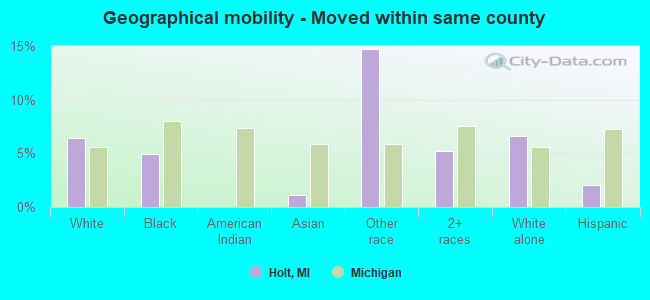
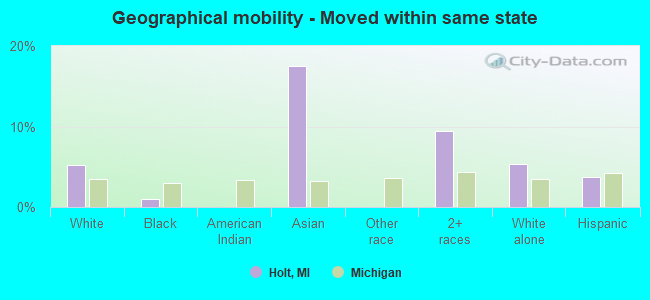
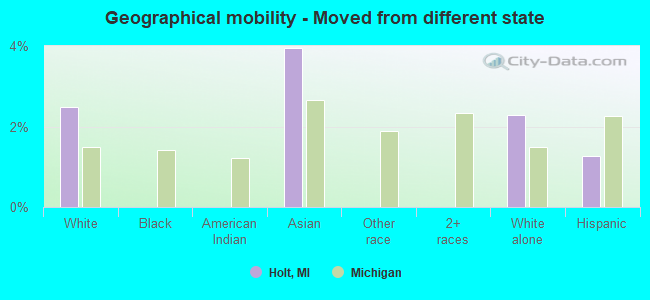
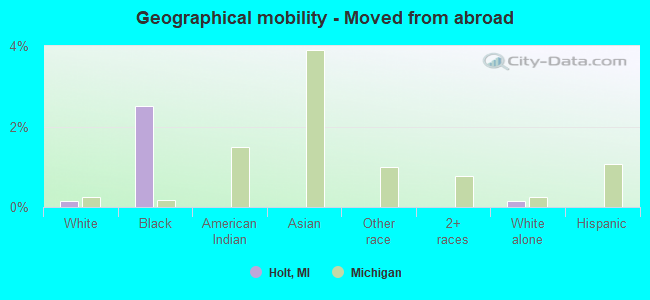
Geographical mobility in Holt Same house 1 year ago 15,752 85.9% White (Caucasian)1,985 99.3% Black or African American45 100.0% American Indian / Alaska Native824 76.7% Asian541 84.6% Other race2,495 85.0% Two or more races15,765 85.7% White alone, not Hispanic / Latino1,975 93.8% Hispanic or LatinoMoved within same county 1,186 6.5% White / Caucasian98 4.9% Black or African American12 1.1% Asian94 14.7% Other race154 5.3% Two or more races1,211 6.6% White alone, not Hispanic / Latino43 2.0% Hispanic or LatinoMoved within same state 949 5.2% White / Caucasian20 1.0% Black or African American188 17.5% Asian278 9.5% Two or more races978 5.3% White alone, not Hispanic / Latino79 3.7% Hispanic or LatinoMoved from different state 456 2.5% White / Caucasian42 4.0% Asian422 2.3% White alone, not Hispanic / Latino27 1.3% Hispanic or LatinoMoved from abroad 27 0.1% White50 2.5% Black or African American29 0.2% White alone, not Hispanic / Latino
Children Nativity (place of birth) in Holt
Children under 6 years - Living with two parents Both parents native 677 100.0% NativeBoth parents foreign-born 34 100.0% NativeOne native, one foreign-born parent 206 100.0% NativeChildren under 6 years - Living with one parent Native parent 431 100.0% NativeChildren 6 to 17 years - Living with two parents Both parents native 1,705 95.8% Native76 4.2% Foreign-bornBoth parents foreign-born 92 100.0% NativeOne native, one foreign-born parent 287 100.0% NativeChildren 6 to 17 years - Living with one parent Native parent 1,422 100.0% NativeForeign-born parent 37 50.9% Native35 49.1% Foreign-born
Grandparents responsible for own grandchildren in Holt
Grandparents (30 to 59 years) White / Caucasian 53 81.5% Responsible for grandchildren12 18.5% Not responsible for grandchildrenBlack or African American 69 100.0% Responsible for grandchildrenTwo or more races 4 5.1% Responsible for grandchildren72 94.9% Not responsible for grandchildrenWhite alone, not Hispanic / Latino 53 81.4% Responsible for grandchildren12 18.6% Not responsible for grandchildrenHispanic or Latino 5 100.0% Responsible for grandchildrenGrandparents (60 years and over) White / Caucasian 16 15.8% Responsible for grandchildren83 84.2% Not responsible for grandchildrenTwo or more races 9 100.0% Responsible for grandchildrenWhite alone, not Hispanic / Latino 16 14.8% Responsible for grandchildren93 85.2% Not responsible for grandchildrenHispanic or Latino 3 26.5% Responsible for grandchildren9 73.5% Not responsible for grandchildren