Races in Lake Shore, Maryland (MD) Detailed Stats
Data:
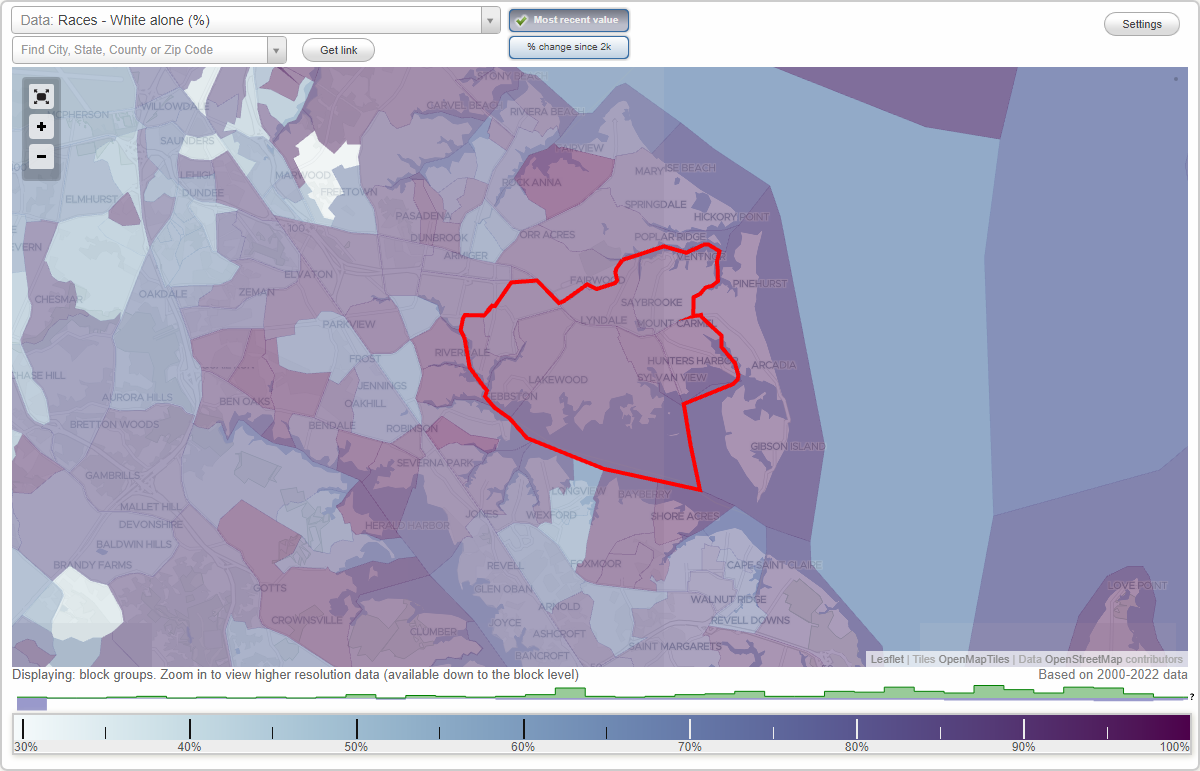
Races - White alone (%)
Races - White alone (% change since 2000)
Races - Black alone (%)
Races - Black alone (% change since 2000)
Races - American Indian alone (%)
Races - American Indian alone (% change since 2000)
Races - Asian alone (%)
Races - Asian alone (% change since 2000)
Races - Hispanic (%)
Races - Hispanic (% change since 2000)
Races - Native Hawaiian and Other Pacific Islander alone (%)
Races - Native Hawaiian and Other Pacific Islander alone (% change since 2000)
Races - Two or more races(%)
Races - Two or more races(% change since 2000)
Races - Other race alone (%)
Races - Other race alone (% change since 2000)
Racial diversity
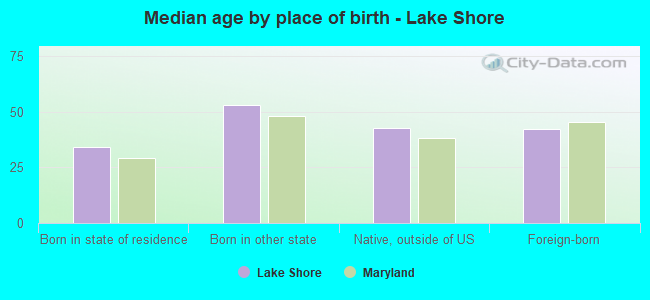
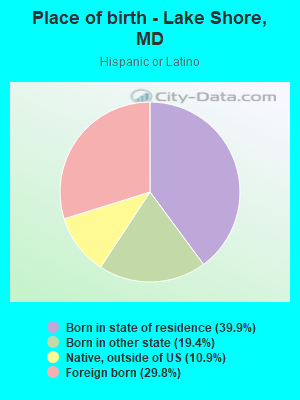
Place of birth - Born in state of residence (%)
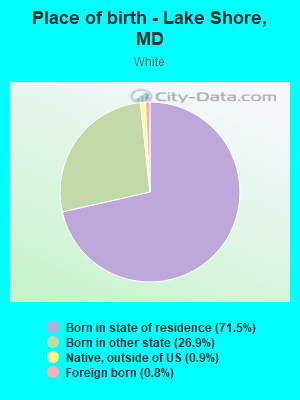
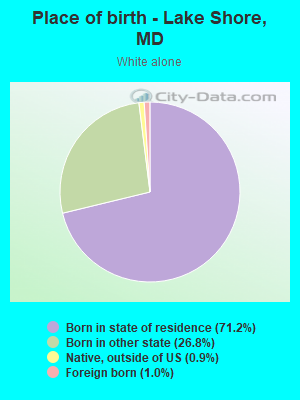
Place of birth - Born in state of residence (%) - White
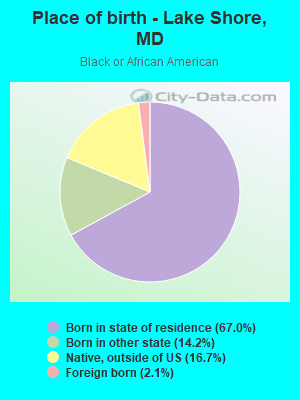
Place of birth - Born in state of residence (%) - Black or African American
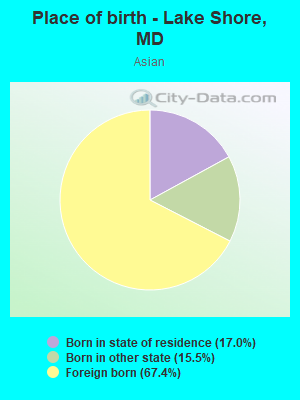
Place of birth - Born in state of residence (%) - Asian
Place of birth - Born in state of residence (%) - Hispanic or Latino
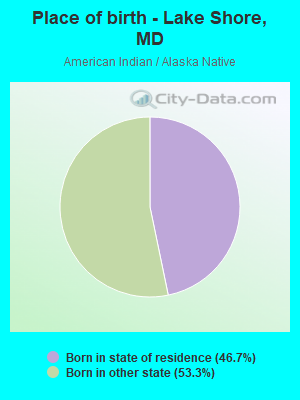
Place of birth - Born in state of residence (%) - American Indian and Alaska Native
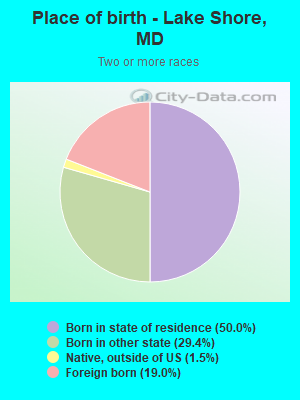
Place of birth - Born in state of residence (%) - Multirace
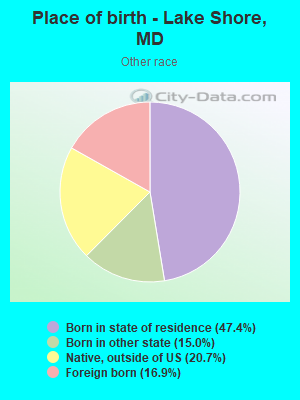
Place of birth - Born in state of residence (%) - Other Race
Place of birth - Born in other state (%)
Place of birth - Born in other state (%) - White
Place of birth - Born in other state (%) - Black or African American
Place of birth - Born in other state (%) - Asian
Place of birth - Born in other state (%) - Hispanic or Latino
Place of birth - Born in other state (%) - American Indian and Alaska Native
Place of birth - Born in other state (%) - Multirace
Place of birth - Born in other state (%) - Other Race
Place of birth - Native, outside of US (%)
Place of birth - Native, outside of US (%) - White
Place of birth - Native, outside of US (%) - Black or African American
Place of birth - Native, outside of US (%) - Asian
Place of birth - Native, outside of US (%) - Hispanic or Latino
Place of birth - Native, outside of US (%) - American Indian and Alaska Native
Place of birth - Native, outside of US (%) - Multirace
Place of birth - Native, outside of US (%) - Other Race
Place of birth - Foreign born (%)
Place of birth - Foreign born (%) - White
Place of birth - Foreign born (%) - Black or African American
Place of birth - Foreign born (%) - Asian
Place of birth - Foreign born (%) - Hispanic or Latino
Place of birth - Foreign born (%) - American Indian and Alaska Native
Place of birth - Foreign born (%) - Multirace
Place of birth - Foreign born (%) - Other Race
Residents speaking English at home (%)
Residents speaking English at home - Born in the United States (%)
Residents speaking English at home - Native, born elsewhere (%)
Residents speaking English at home - Foreign born (%)
Residents speaking Spanish at home (%)
Residents speaking Spanish at home - Born in the United States (%)
Residents speaking Spanish at home - Native, born elsewhere (%)
Residents speaking Spanish at home - Foreign born (%)
Residents speaking other language at home (%)
Residents speaking other language at home - Born in the United States (%)
Residents speaking other language at home - Native, born elsewhere (%)
Residents speaking other language at home - Foreign born (%)
Marital status - Never married (%)
Marital status - Now married (%)
Marital status - Separated (%)
Marital status - Widowed (%)
Marital status - Divorced (%)
Ancestries Reported - Arab (%)
Ancestries Reported - Czech (%)
Ancestries Reported - Danish (%)
Ancestries Reported - Dutch (%)
Ancestries Reported - English (%)
Ancestries Reported - French (%)
Ancestries Reported - French Canadian (%)
Ancestries Reported - German (%)
Ancestries Reported - Greek (%)
Ancestries Reported - Hungarian (%)
Ancestries Reported - Irish (%)
Ancestries Reported - Italian (%)
Ancestries Reported - Lithuanian (%)
Ancestries Reported - Norwegian (%)
Ancestries Reported - Polish (%)
Ancestries Reported - Portuguese (%)
Ancestries Reported - Russian (%)
Ancestries Reported - Scotch-Irish (%)
Ancestries Reported - Scottish (%)
Ancestries Reported - Slovak (%)
Ancestries Reported - Subsaharan African (%)
Ancestries Reported - Swedish (%)
Ancestries Reported - Swiss (%)
Ancestries Reported - Ukrainian (%)
Ancestries Reported - United States (%)
Ancestries Reported - Welsh (%)
Ancestries Reported - West Indian (%)
Ancestries Reported - Other (%)
Geographical mobility - Same house 1 year ago (%)
Geographical mobility - Same house 1 year ago (%) - White
Geographical mobility - Same house 1 year ago (%) - Black or African American
Geographical mobility - Same house 1 year ago (%) - Asian
Geographical mobility - Same house 1 year ago (%) - Hispanic or Latino
Geographical mobility - Same house 1 year ago (%) - American Indian and Alaska Native
Geographical mobility - Same house 1 year ago (%) - Multirace
Geographical mobility - Same house 1 year ago (%) - Other Race
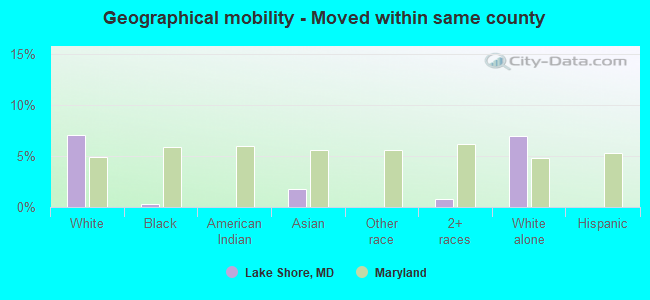
Geographical mobility - Moved within same county (%)
Geographical mobility - Moved within same county (%) - White
Geographical mobility - Moved within same county (%) - Black or African American
Geographical mobility - Moved within same county (%) - Asian
Geographical mobility - Moved within same county (%) - Hispanic or Latino
Geographical mobility - Moved within same county (%) - American Indian and Alaska Native
Geographical mobility - Moved within same county (%) - Multirace
Geographical mobility - Moved within same county (%) - Other Race
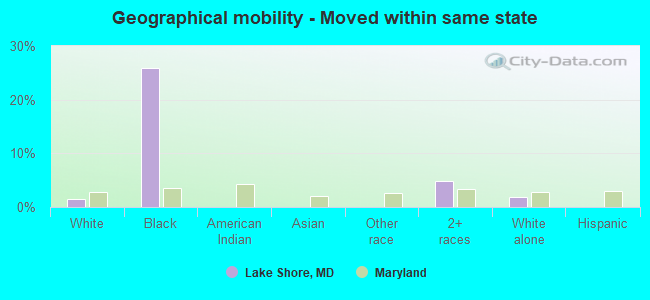
Geographical mobility - Moved from different county within same state (%)
Geographical mobility - Moved from different county within same state (%) - White
Geographical mobility - Moved from different county within same state (%) - Black or African American
Geographical mobility - Moved from different county within same state (%) - Asian
Geographical mobility - Moved from different county within same state (%) - Hispanic or Latino
Geographical mobility - Moved from different county within same state (%) - American Indian and Alaska Native
Geographical mobility - Moved from different county within same state (%) - Multirace
Geographical mobility - Moved from different county within same state (%) - Other Race
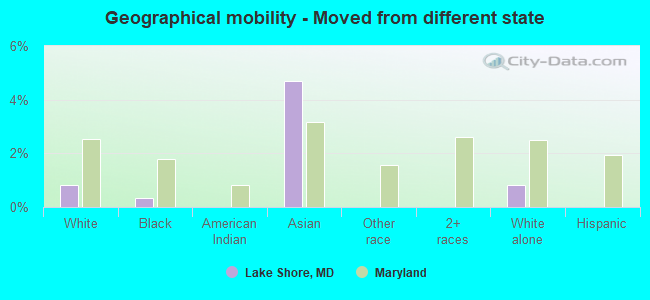
Geographical mobility - Moved from different state (%)
Geographical mobility - Moved from different state (%) - White
Geographical mobility - Moved from different state (%) - Black or African American
Geographical mobility - Moved from different state (%) - Asian
Geographical mobility - Moved from different state (%) - Hispanic or Latino
Geographical mobility - Moved from different state (%) - American Indian and Alaska Native
Geographical mobility - Moved from different state (%) - Multirace
Geographical mobility - Moved from different state (%) - Other Race
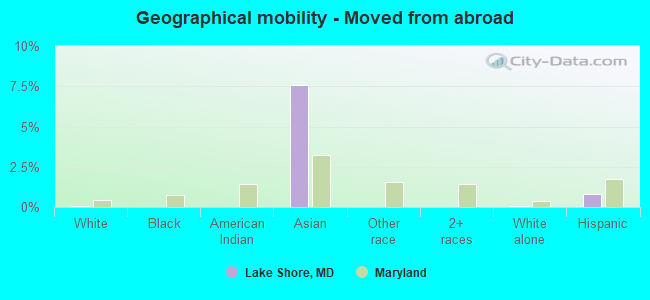
Geographical mobility - Moved from abroad (%)
Geographical mobility - Moved from abroad (%) - White
Geographical mobility - Moved from abroad (%) - Black or African American
Geographical mobility - Moved from abroad (%) - Asian
Geographical mobility - Moved from abroad (%) - Hispanic or Latino
Geographical mobility - Moved from abroad (%) - American Indian and Alaska Native
Geographical mobility - Moved from abroad (%) - Multirace
Geographical mobility - Moved from abroad (%) - Other Race
Place of birth for the foreign-born population - Ireland (%)
Place of birth for the foreign-born population - Denmark (%)
Place of birth for the foreign-born population - Norway (%)
Place of birth for the foreign-born population - Sweden (%)
Place of birth for the foreign-born population - United Kingdom (%)
Place of birth for the foreign-born population - England (%)
Place of birth for the foreign-born population - Scotland (%)
Place of birth for the foreign-born population - Other Northern Europe (%)
Place of birth for the foreign-born population - Austria (%)
Place of birth for the foreign-born population - Belgium (%)
Place of birth for the foreign-born population - France (%)
Place of birth for the foreign-born population - Germany (%)
Place of birth for the foreign-born population - Netherlands (%)
Place of birth for the foreign-born population - Switzerland (%)
Place of birth for the foreign-born population - Other Western Europe (%)
Place of birth for the foreign-born population - Greece (%)
Place of birth for the foreign-born population - Italy (%)
Place of birth for the foreign-born population - Portugal (%)
Place of birth for the foreign-born population - Spain (%)
Place of birth for the foreign-born population - Other Southern Europe (%)
Place of birth for the foreign-born population - Albania (%)
Place of birth for the foreign-born population - Belarus (%)
Place of birth for the foreign-born population - Bosnia and Herzegovina (%)
Place of birth for the foreign-born population - Bulgaria (%)
Place of birth for the foreign-born population - Croatia (%)
Place of birth for the foreign-born population - Czechoslovakia (%)
Place of birth for the foreign-born population - Hungary (%)
Place of birth for the foreign-born population - Latvia (%)
Place of birth for the foreign-born population - Lithuania (%)
Place of birth for the foreign-born population - North Macedonia (Macedonia) (%)
Place of birth for the foreign-born population - Moldova (%)
Place of birth for the foreign-born population - Poland (%)
Place of birth for the foreign-born population - Romania (%)
Place of birth for the foreign-born population - Russia (%)
Place of birth for the foreign-born population - Serbia (%)
Place of birth for the foreign-born population - Ukraine (%)
Place of birth for the foreign-born population - Other Eastern Europe (%)
Place of birth for the foreign-born population - China (%)
Place of birth for the foreign-born population - Hong Kong (%)
Place of birth for the foreign-born population - Taiwan (%)
Place of birth for the foreign-born population - Japan (%)
Place of birth for the foreign-born population - Korea (%)
Place of birth for the foreign-born population - Other Eastern Asia (%)
Place of birth for the foreign-born population - Afghanistan (%)
Place of birth for the foreign-born population - Bangladesh (%)
Place of birth for the foreign-born population - India (%)
Place of birth for the foreign-born population - Iran (%)
Place of birth for the foreign-born population - Kazakhstan (%)
Place of birth for the foreign-born population - Nepal (%)
Place of birth for the foreign-born population - Pakistan (%)
Place of birth for the foreign-born population - Sri Lanka (%)
Place of birth for the foreign-born population - Uzbekistan (%)
Place of birth for the foreign-born population - Other South Central Asia (%)
Place of birth for the foreign-born population - Burma (%)
Place of birth for the foreign-born population - Cambodia (%)
Place of birth for the foreign-born population - Indonesia (%)
Place of birth for the foreign-born population - Laos (%)
Place of birth for the foreign-born population - Malaysia (%)
Place of birth for the foreign-born population - Philippines (%)
Place of birth for the foreign-born population - Singapore (%)
Place of birth for the foreign-born population - Thailand (%)
Place of birth for the foreign-born population - Vietnam (%)
Place of birth for the foreign-born population - Other South Eastern Asia (%)
Place of birth for the foreign-born population - Armenia (%)
Place of birth for the foreign-born population - Iraq (%)
Place of birth for the foreign-born population - Israel (%)
Place of birth for the foreign-born population - Jordan (%)
Place of birth for the foreign-born population - Kuwait (%)
Place of birth for the foreign-born population - Lebanon (%)
Place of birth for the foreign-born population - Saudi Arabia (%)
Place of birth for the foreign-born population - Syria (%)
Place of birth for the foreign-born population - Turkey (%)
Place of birth for the foreign-born population - Yemen (%)
Place of birth for the foreign-born population - Other Western Asia (%)
Place of birth for the foreign-born population - Eritrea (%)
Place of birth for the foreign-born population - Ethiopia (%)
Place of birth for the foreign-born population - Kenya (%)
Place of birth for the foreign-born population - Somalia (%)
Place of birth for the foreign-born population - Uganda (%)
Place of birth for the foreign-born population - Zimbabwe (%)
Place of birth for the foreign-born population - Other Eastern Africa (%)
Place of birth for the foreign-born population - Cameroon (%)
Place of birth for the foreign-born population - Congo (%)
Place of birth for the foreign-born population - Democratic Republic of Congo (Zaire) (%)
Place of birth for the foreign-born population - Other Middle Africa (%)
Place of birth for the foreign-born population - Egypt (%)
Place of birth for the foreign-born population - Morocco (%)
Place of birth for the foreign-born population - Sudan (%)
Place of birth for the foreign-born population - Other Northern Africa (%)
Place of birth for the foreign-born population - South Africa (%)
Place of birth for the foreign-born population - Other Southern Africa (%)
Place of birth for the foreign-born population - Cabo Verde (%)
Place of birth for the foreign-born population - Ghana (%)
Place of birth for the foreign-born population - Liberia (%)
Place of birth for the foreign-born population - Nigeria (%)
Place of birth for the foreign-born population - Senegal (%)
Place of birth for the foreign-born population - Sierra Leone (%)
Place of birth for the foreign-born population - Other Western Africa (%)
Place of birth for the foreign-born population - Australia (%)
Place of birth for the foreign-born population - New Zealand (%)
Place of birth for the foreign-born population - Fiji (%)
Place of birth for the foreign-born population - Micronesia (%)
Place of birth for the foreign-born population - Bahamas (%)
Place of birth for the foreign-born population - Barbados (%)
Place of birth for the foreign-born population - Cuba (%)
Place of birth for the foreign-born population - Dominica (%)
Place of birth for the foreign-born population - Dominican Republic (%)
Place of birth for the foreign-born population - Grenada (%)
Place of birth for the foreign-born population - Haiti (%)
Place of birth for the foreign-born population - Jamaica (%)
Place of birth for the foreign-born population - St. Vincent and the Grenadines (%)
Place of birth for the foreign-born population - Trinidad and Tobago (%)
Place of birth for the foreign-born population - West Indies (%)
Place of birth for the foreign-born population - Other Caribbean (%)
Place of birth for the foreign-born population - Belize (%)
Place of birth for the foreign-born population - Costa Rica (%)
Place of birth for the foreign-born population - El Salvador (%)
Place of birth for the foreign-born population - Guatemala (%)
Place of birth for the foreign-born population - Honduras (%)
Place of birth for the foreign-born population - Mexico (%)
Place of birth for the foreign-born population - Nicaragua (%)
Place of birth for the foreign-born population - Panama (%)
Place of birth for the foreign-born population - Other Central America (%)
Place of birth for the foreign-born population - Argentina (%)
Place of birth for the foreign-born population - Bolivia (%)
Place of birth for the foreign-born population - Brazil (%)
Place of birth for the foreign-born population - Chile (%)
Place of birth for the foreign-born population - Colombia (%)
Place of birth for the foreign-born population - Ecuador (%)
Place of birth for the foreign-born population - Guyana (%)
Place of birth for the foreign-born population - Peru (%)
Place of birth for the foreign-born population - Uruguay (%)
Place of birth for the foreign-born population - Venezuela (%)
Place of birth for the foreign-born population - Other South America (%)
Place of birth for the foreign-born population - Canada (%)
Place of birth for the foreign-born population - Other Northern America (%)
Place of birth for the foreign-born population - Other (%)
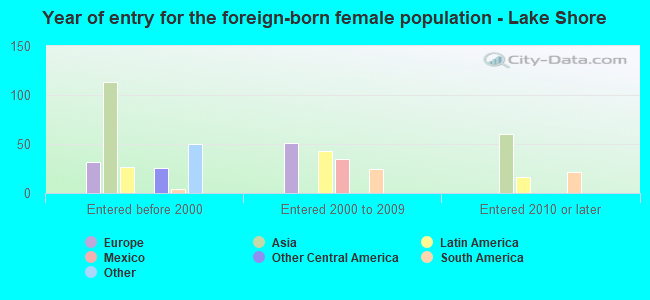
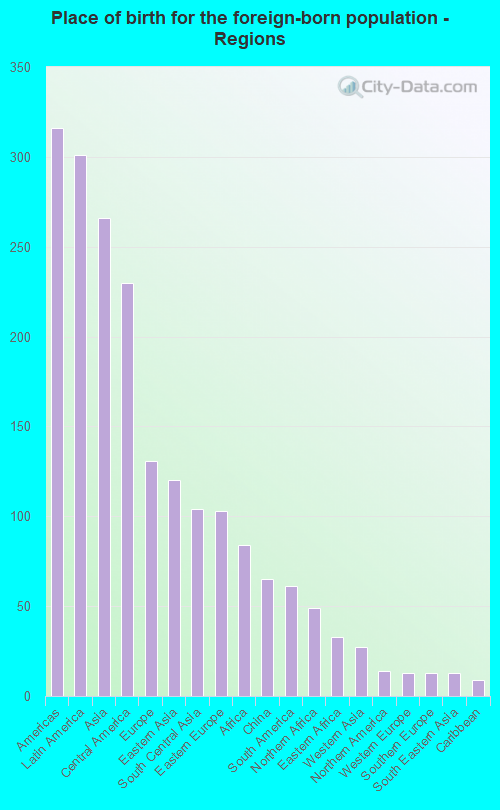
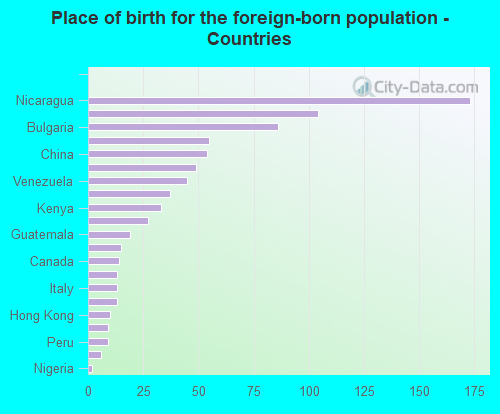
According to 2022 data, the most numerous races in Lake Shore, MD are White alone (15,804 residents), Black alone (584 residents), and Hispanic (961 residents). 91.8% of Lake Shore residents speak English at home. 4.2% of Lake Shore, MD residents are foreign-born (1.5% born in Latin America, 1.3% born in Asia, 0.7% born in Europe), which is 281.7% less than the foreign-born rate of 16.0% across the entire state of Maryland.
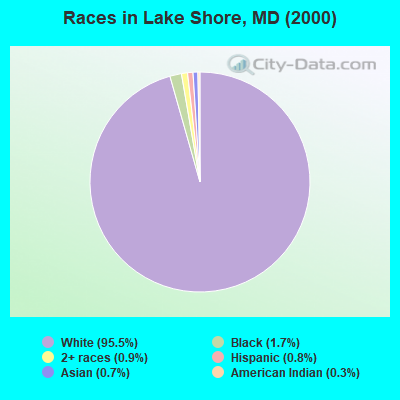
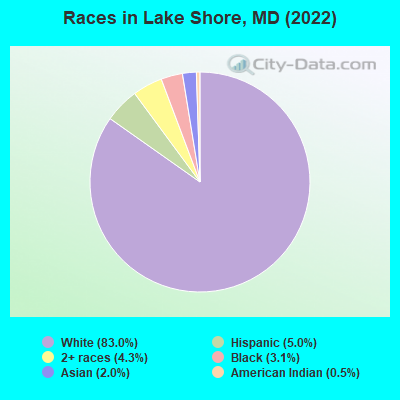
Race distribution in Lake Shore
2000 2022
3,286,547 62.1% White alone 1,464,735 27.7% Black alone 227,916 4.3% Hispanic 209,738 4.0% Asian alone 82,946 1.6% Two or more races 13,312 0.3% American Indian alone 9,379 0.2% Other race alone 1,913 0.04% Native Hawaiian and Other
2,906,492 47.1% White alone 1,800,914 29.2% Black alone 705,842 11.4% Hispanic 401,818 6.5% Asian alone 291,317 4.7% Two or more races 46,930 0.8% Other race alone 8,930 0.1% American Indian alone 2,417 0.04% Native Hawaiian and Other
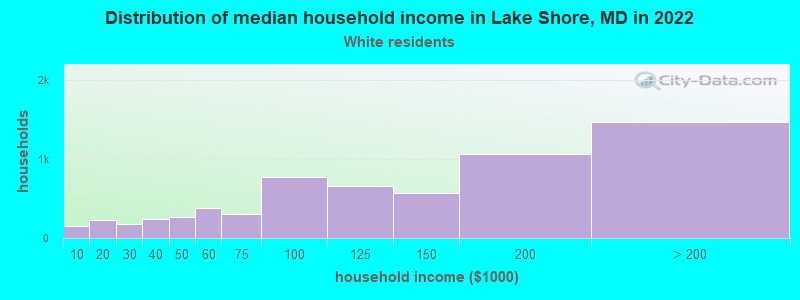
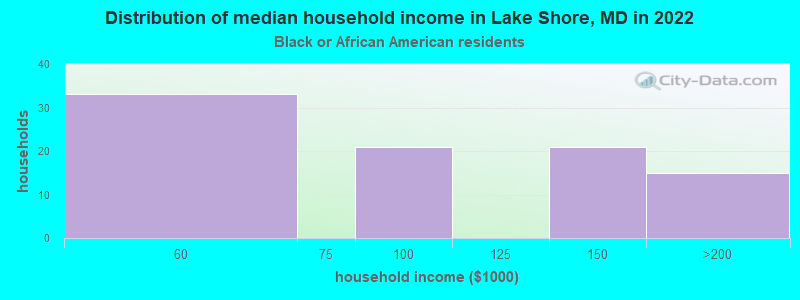
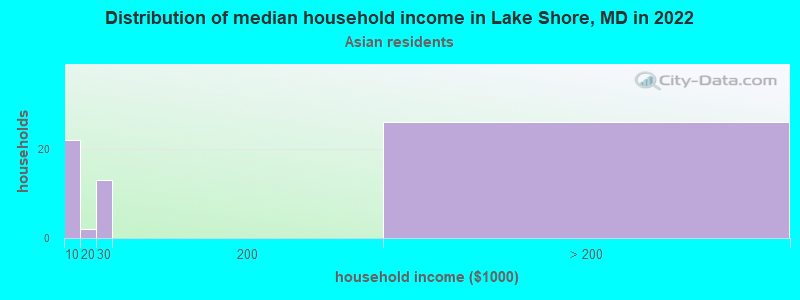
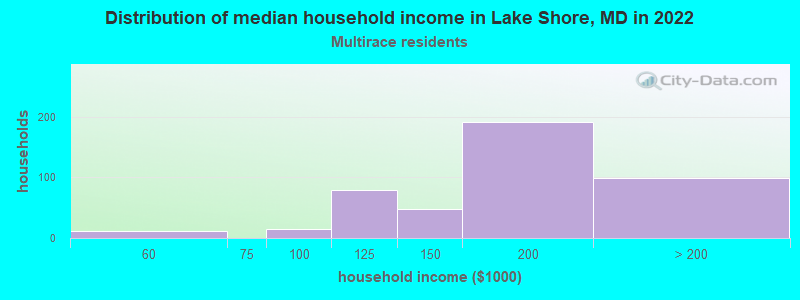
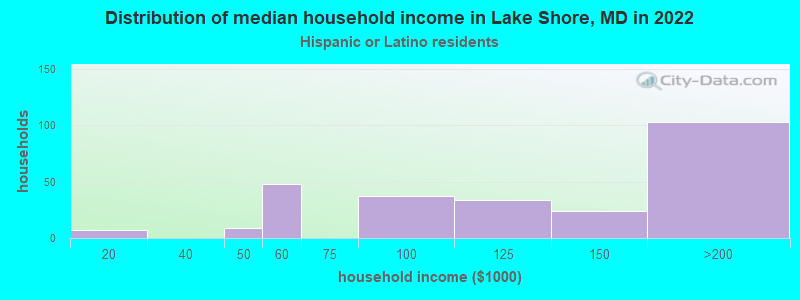
Income and house value in Lake Shore Median household income in 2022 $125,282 White non-Hispanic householders$123,947 Black householdersover $200,000 Asian householders$151,895 Two or more races householders$158,903 Hispanic or Latino race householdersMedian 2022 house value $479,733 White Non-Hispanic householders$365,865 Black or African American householders$448,026 American Indian or Alaska Native householders $408,600 Asian householders$407,773 Two or more races householders
Median age by race in Lake Shore
44.5 Median age for White residents45.3 43.1 25.0 Median age for Black or African American residents39.0 13.8 -836,842,104.4 Median age for American Indian / Alaska Native residents-674,418,604.0 -1,072,276,158.6 53.5 Median age for Asian residents56.9 52.4 -534,101,824.6 Median age for Native Hawaiian / Pacific Islander residents-720,061,021.4 -760,942,760.2 18.5 Median age for Other race residents8.9 18.1 35.4 Median age for Two or more races residents44.5 16.5 44.5 Median age for White alone residents44.9 42.8 29.7 Median age for Hispanic or Latino residents34.0 29.5
Owner/renter occupied households by race in Lake Shore
House owners and renters - White residents 5,768 91.1% Owner occupied566 8.9% Renter occupiedHouse owners and renters - Black or African American residents 39 40.1% Owner occupied59 59.9% Renter occupiedHouse owners and renters - American Indian / Alaska Native residents 66 100.0% Owner occupiedHouse owners and renters - Asian residents 79 100.0% Owner occupiedHouse owners and renters - Other race residents 31 100.0% Renter occupiedHouse owners and renters - Two or more races residents 425 90.3% Owner occupied45 9.7% Renter occupiedHouse owners and renters - White alone residents 5,792 91.2% Owner occupied559 8.8% Renter occupiedHouse owners and renters - Hispanic or Latino residents 264 80.2% Owner occupied65 19.8% Renter occupied
Language usage in Lake Shore
English speakers - Total 91.8% of residents of Lake Shore speak English at home.
4.3% of residents speak Spanish at home 744 96.1% Speak English very well30 3.9% Speak English less than very well3.3% of residents speak other language at home 448 75.5% Speak English very well145 24.5% Speak English less than very well
English speakers - Born in the United States 97.1% of residents of Lake Shore speak English at home.
1.0% of residents speak Spanish at home 47 100.0% Speak English very well1.9% of residents speak other language at home 91 100.0% Speak English very well
English speakers - Native, born elsewhere 72.9% of residents of Lake Shore speak English at home.
23.9% of residents speak Spanish at home 75 100.0% Speak English very well
English speakers - Foreign-born 9.4% of residents of Lake Shore speak English at home.
29.6% of residents speak Spanish at home 218 95.2% Speak English very well11 4.8% Speak English less than very well54.7% of residents speak other language at home 293 69.3% Speak English very well130 30.7% Speak English less than very well
White (Caucasian) - Speak only English Native:
98.2% (14,665)Foreign-born:
34.6% (45)
White (Caucasian) - Speak another language Native:
2.0% (300)Foreign-born:
63.3% (82)
Black or African American - Speak only English Native:
91.8% (434)Foreign-born:
73.1% (10)
Black or African American - Speak another language Native:
9.0% (43)Foreign-born:
19.6% (3)
Asian - Speak another language Native:
37.2% (42)Foreign-born:
100.0% (259)
Other race - Speak another language Native:
96.4% (174)Foreign-born:
100.0% (47)
Two or more races - Speak another language Native:
1.8% (22)Foreign-born:
88.6% (272)
White alone - Speak only English Native:
97.8% (14,630)Foreign-born:
29.8% (48)
White alone - Speak another language Native:
2.2% (322)Foreign-born:
70.2% (113)
Hispanic or Latino - Speak another language Native:
32.3% (198)Foreign-born:
100.0% (291)
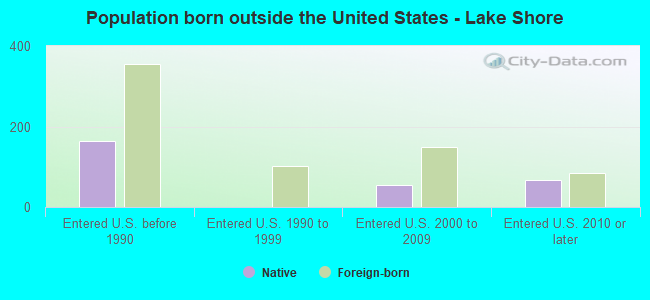
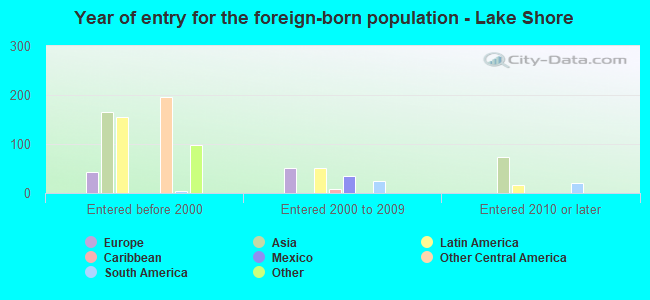
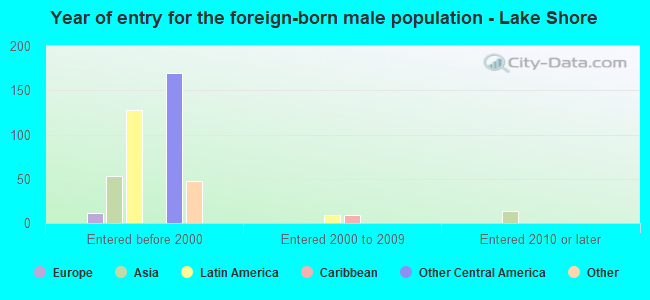
Foreign-born residents in Lake Shore 798 residents are foreign born (1.5% Latin America , 1.3% Asia , 0.7% Europe ).
This city:
4.2%Maryland:
15.7%
Marital status for residents in Lake Shore Marital status - White (Caucasian) population 15 years and over
Males 26.4% Never married61.7% Now married1.2% Separated2.7% Widowed8.0% DivorcedFemales 23.5% Never married59.2% Now married1.4% Separated6.5% Widowed9.4% DivorcedWomen who gave birth in the past 12 months Now married:
72.4% (92)Unmarried:
27.6% (35)
Women who did not give birth in the past 12 months Now married:
49.6% (1,678)Unmarried:
50.4% (1,707)
Marital status - Black or African American population 15 years and over
Males 6.3% Never married78.5% Now married1.0% Separated0.0% Widowed14.1% DivorcedFemales 47.1% Never married41.4% Now married0.0% Separated0.0% Widowed11.5% DivorcedWomen who did not give birth in the past 12 months Now married:
37.0% (51)Unmarried:
63.0% (87)
Marital status - Asian population 15 years and over
Males 26.4% Never married73.6% Now married0.0% Separated0.0% Widowed0.0% DivorcedFemales 33.5% Never married66.5% Now married0.0% Separated0.0% Widowed0.0% DivorcedWomen who gave birth in the past 12 months Now married:
100.0% (9)Unmarried:
0.0% (0)
Women who did not give birth in the past 12 months Now married:
12.9% (13)Unmarried:
87.1% (84)
Marital status - Other race population 15 years and over
Males 0.0% Never married100.0% Now married0.0% Separated0.0% Widowed0.0% DivorcedFemales 35.8% Never married64.2% Now married0.0% Separated0.0% Widowed0.0% DivorcedWomen who did not give birth in the past 12 months Now married:
64.2% (62)Unmarried:
35.8% (34)
Marital status - Two or more races population 15 years and over
Males 32.0% Never married55.9% Now married3.4% Separated0.0% Widowed8.7% DivorcedFemales 44.1% Never married45.0% Now married0.0% Separated0.0% Widowed10.9% DivorcedWomen who did not give birth in the past 12 months Now married:
41.3% (96)Unmarried:
58.7% (137)
Marital status - White alone, not Hispanic / Latino population 15 years and over
Males 26.1% Never married62.0% Now married1.2% Separated2.8% Widowed8.0% DivorcedFemales 23.3% Never married59.5% Now married1.4% Separated6.5% Widowed9.2% DivorcedWomen who gave birth in the past 12 months Now married:
72.4% (94)Unmarried:
27.6% (36)
Women who did not give birth in the past 12 months Now married:
49.7% (1,701)Unmarried:
50.3% (1,720)
Marital status - Hispanic or Latino population 15 years and over
Males 17.7% Never married75.4% Now married6.9% Separated0.0% Widowed0.0% DivorcedFemales 44.0% Never married42.0% Now married0.0% Separated1.7% Widowed12.3% DivorcedWomen who did not give birth in the past 12 months Now married:
47.6% (130)Unmarried:
52.4% (144)
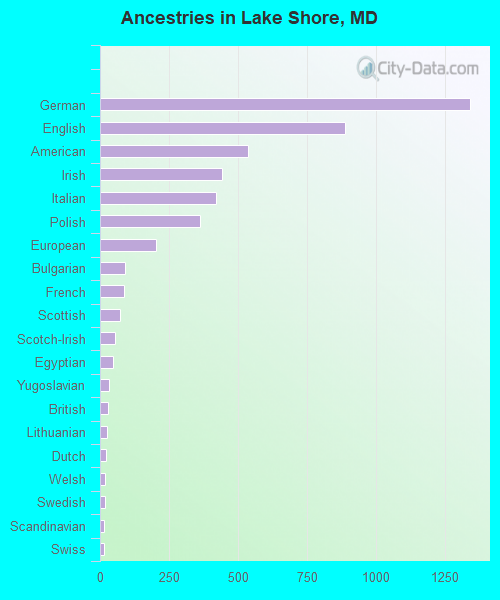
Ancestries in Lake Shore
1,343 22.0% German888 14.5% English535 8.7% American442 7.2% Irish421 6.9% Italian361 5.9% Polish202 3.3% European92 1.5% Bulgarian87 1.4% French71 1.2% Scottish53 0.9% Scotch-Irish46 0.8% Egyptian33 0.5% Yugoslavian30 0.5% British26 0.4% Lithuanian21 0.3% Dutch19 0.3% Welsh18 0.3% Swedish16 0.3% Scandinavian16 0.3% Swiss12 0.2% Estonian12 0.2% French Canadian12 0.2% Ukrainian11 0.2% Canadian10 0.2% Trinidadian and Tobagonian8 0.1% Czechoslovakian7 0.1% Eastern European1 0.02% African
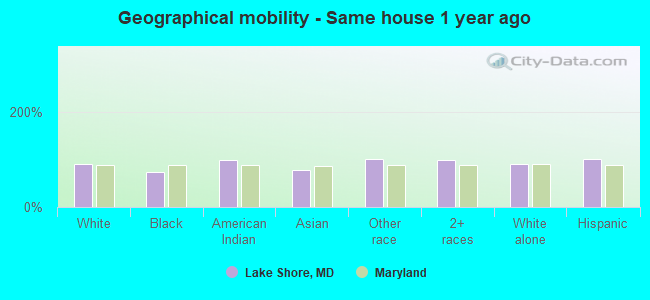
Geographical mobility in Lake Shore Same house 1 year ago 14,058 90.8% White (Caucasian)455 73.2% Black or African American115 98.9% American Indian / Alaska Native295 77.1% Asian275 100.0% Other race1,521 97.6% Two or more races14,152 90.6% White alone, not Hispanic / Latino975 100.0% Hispanic or LatinoMoved within same county 1,088 7.0% White / Caucasian2 0.3% Black or African American7 1.8% Asian12 0.8% Two or more races1,086 6.9% White alone, not Hispanic / LatinoMoved within same state 242 1.6% White / Caucasian161 25.9% Black or African American76 4.9% Two or more races284 1.8% White alone, not Hispanic / LatinoMoved from different state 126 0.8% White / Caucasian2 0.3% Black or African American18 4.7% Asian129 0.8% White alone, not Hispanic / LatinoMoved from abroad 13 0.1% White29 7.6% Asian10 0.1% White alone, not Hispanic / Latino8 0.8% Hispanic or Latino
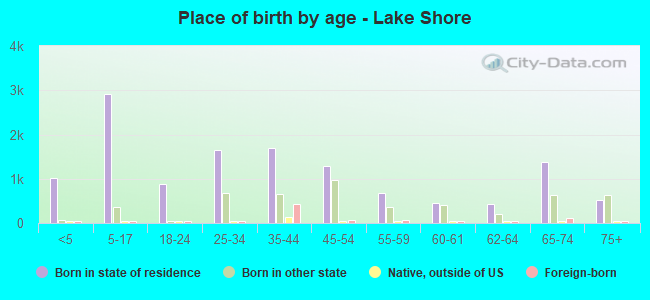
Children Nativity (place of birth) in Lake Shore
Children under 6 years - Living with two parents Both parents native 930 100.0% NativeOne native, one foreign-born parent 39 100.0% NativeChildren under 6 years - Living with one parent Native parent 181 100.0% NativeChildren 6 to 17 years - Living with two parents Both parents native 1,787 100.0% NativeBoth parents foreign-born 300 100.0% NativeOne native, one foreign-born parent 92 100.0% NativeChildren 6 to 17 years - Living with one parent Native parent 811 100.0% NativeForeign-born parent 49 52.0% Native45 48.0% Foreign-born
Grandparents responsible for own grandchildren in Lake Shore
Grandparents (30 to 59 years) White / Caucasian 34 17.2% Responsible for grandchildren162 82.8% Not responsible for grandchildrenBlack or African American 21 100.0% Not responsible for grandchildrenWhite alone, not Hispanic / Latino 34 16.8% Responsible for grandchildren167 83.2% Not responsible for grandchildrenGrandparents (60 years and over) White / Caucasian 78 26.6% Responsible for grandchildren216 73.4% Not responsible for grandchildrenBlack or African American 28 100.0% Responsible for grandchildrenWhite alone, not Hispanic / Latino 81 26.7% Responsible for grandchildren222 73.3% Not responsible for grandchildren