Races in Liberty, Missouri (MO) Detailed Stats
Data:
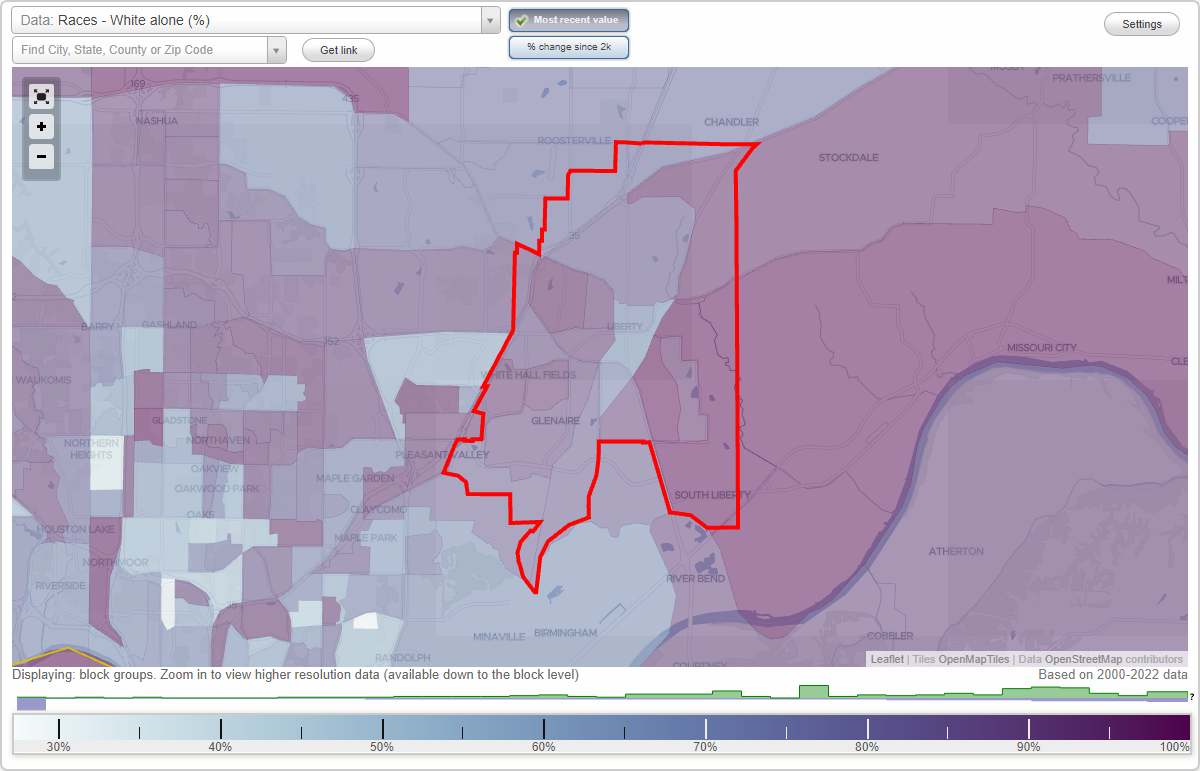
Races - White alone (%)
Races - White alone (% change since 2000)
Races - Black alone (%)
Races - Black alone (% change since 2000)
Races - American Indian alone (%)
Races - American Indian alone (% change since 2000)
Races - Asian alone (%)
Races - Asian alone (% change since 2000)
Races - Hispanic (%)
Races - Hispanic (% change since 2000)
Races - Native Hawaiian and Other Pacific Islander alone (%)
Races - Native Hawaiian and Other Pacific Islander alone (% change since 2000)
Races - Two or more races(%)
Races - Two or more races(% change since 2000)
Races - Other race alone (%)
Races - Other race alone (% change since 2000)
Racial diversity
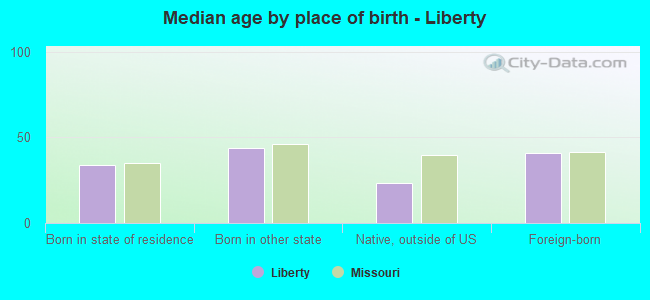
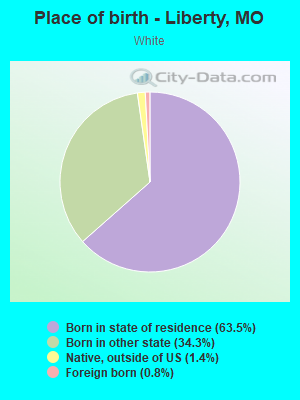
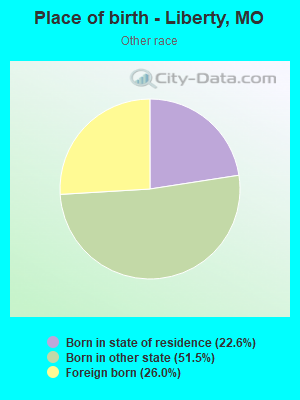
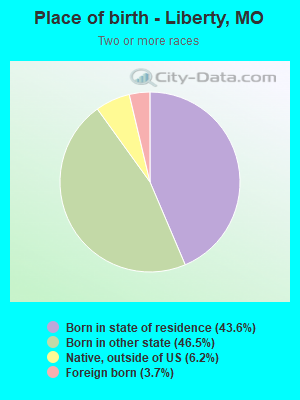
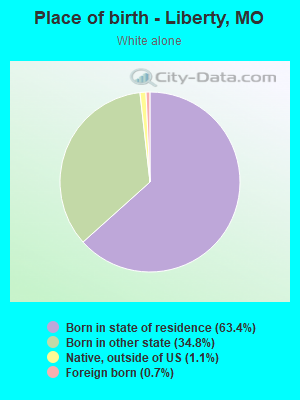
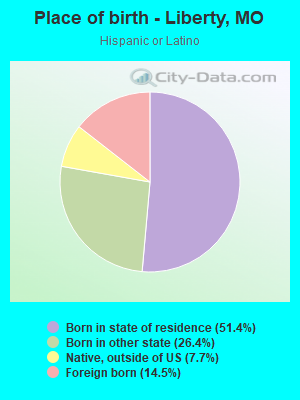
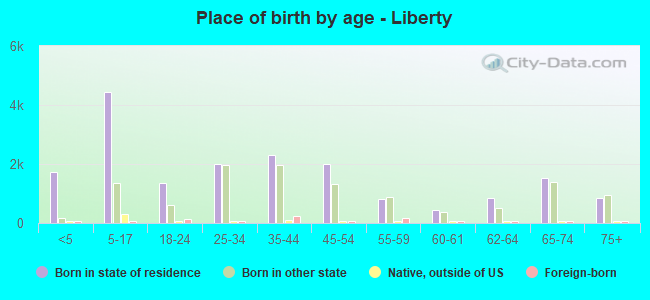
Place of birth - Born in state of residence (%)
Place of birth - Born in state of residence (%) - White
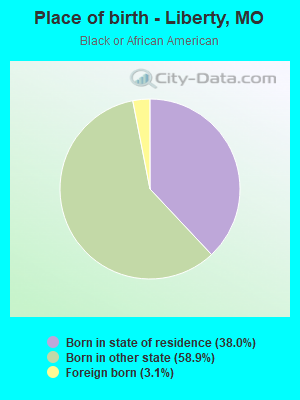
Place of birth - Born in state of residence (%) - Black or African American
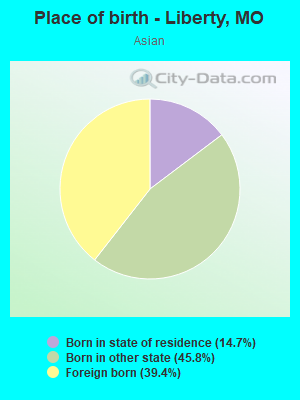
Place of birth - Born in state of residence (%) - Asian
Place of birth - Born in state of residence (%) - Hispanic or Latino
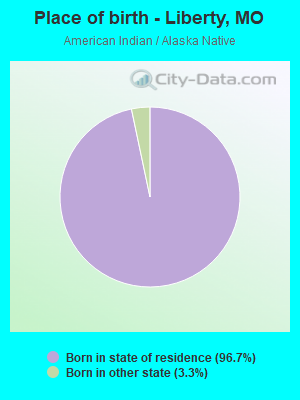
Place of birth - Born in state of residence (%) - American Indian and Alaska Native
Place of birth - Born in state of residence (%) - Multirace
Place of birth - Born in state of residence (%) - Other Race
Place of birth - Born in other state (%)
Place of birth - Born in other state (%) - White
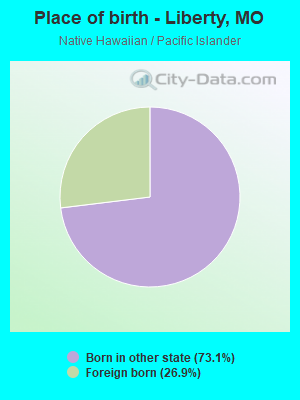
Place of birth - Born in other state (%) - Black or African American
Place of birth - Born in other state (%) - Asian
Place of birth - Born in other state (%) - Hispanic or Latino
Place of birth - Born in other state (%) - American Indian and Alaska Native
Place of birth - Born in other state (%) - Multirace
Place of birth - Born in other state (%) - Other Race
Place of birth - Native, outside of US (%)
Place of birth - Native, outside of US (%) - White
Place of birth - Native, outside of US (%) - Black or African American
Place of birth - Native, outside of US (%) - Asian
Place of birth - Native, outside of US (%) - Hispanic or Latino
Place of birth - Native, outside of US (%) - American Indian and Alaska Native
Place of birth - Native, outside of US (%) - Multirace
Place of birth - Native, outside of US (%) - Other Race
Place of birth - Foreign born (%)
Place of birth - Foreign born (%) - White
Place of birth - Foreign born (%) - Black or African American
Place of birth - Foreign born (%) - Asian
Place of birth - Foreign born (%) - Hispanic or Latino
Place of birth - Foreign born (%) - American Indian and Alaska Native
Place of birth - Foreign born (%) - Multirace
Place of birth - Foreign born (%) - Other Race
Residents speaking English at home (%)
Residents speaking English at home - Born in the United States (%)
Residents speaking English at home - Native, born elsewhere (%)
Residents speaking English at home - Foreign born (%)
Residents speaking Spanish at home (%)
Residents speaking Spanish at home - Born in the United States (%)
Residents speaking Spanish at home - Native, born elsewhere (%)
Residents speaking Spanish at home - Foreign born (%)
Residents speaking other language at home (%)
Residents speaking other language at home - Born in the United States (%)
Residents speaking other language at home - Native, born elsewhere (%)
Residents speaking other language at home - Foreign born (%)
Marital status - Never married (%)
Marital status - Now married (%)
Marital status - Separated (%)
Marital status - Widowed (%)
Marital status - Divorced (%)
Ancestries Reported - Arab (%)
Ancestries Reported - Czech (%)
Ancestries Reported - Danish (%)
Ancestries Reported - Dutch (%)
Ancestries Reported - English (%)
Ancestries Reported - French (%)
Ancestries Reported - French Canadian (%)
Ancestries Reported - German (%)
Ancestries Reported - Greek (%)
Ancestries Reported - Hungarian (%)
Ancestries Reported - Irish (%)
Ancestries Reported - Italian (%)
Ancestries Reported - Lithuanian (%)
Ancestries Reported - Norwegian (%)
Ancestries Reported - Polish (%)
Ancestries Reported - Portuguese (%)
Ancestries Reported - Russian (%)
Ancestries Reported - Scotch-Irish (%)
Ancestries Reported - Scottish (%)
Ancestries Reported - Slovak (%)
Ancestries Reported - Subsaharan African (%)
Ancestries Reported - Swedish (%)
Ancestries Reported - Swiss (%)
Ancestries Reported - Ukrainian (%)
Ancestries Reported - United States (%)
Ancestries Reported - Welsh (%)
Ancestries Reported - West Indian (%)
Ancestries Reported - Other (%)
Geographical mobility - Same house 1 year ago (%)
Geographical mobility - Same house 1 year ago (%) - White
Geographical mobility - Same house 1 year ago (%) - Black or African American
Geographical mobility - Same house 1 year ago (%) - Asian
Geographical mobility - Same house 1 year ago (%) - Hispanic or Latino
Geographical mobility - Same house 1 year ago (%) - American Indian and Alaska Native
Geographical mobility - Same house 1 year ago (%) - Multirace
Geographical mobility - Same house 1 year ago (%) - Other Race
Geographical mobility - Moved within same county (%)
Geographical mobility - Moved within same county (%) - White
Geographical mobility - Moved within same county (%) - Black or African American
Geographical mobility - Moved within same county (%) - Asian
Geographical mobility - Moved within same county (%) - Hispanic or Latino
Geographical mobility - Moved within same county (%) - American Indian and Alaska Native
Geographical mobility - Moved within same county (%) - Multirace
Geographical mobility - Moved within same county (%) - Other Race
Geographical mobility - Moved from different county within same state (%)
Geographical mobility - Moved from different county within same state (%) - White
Geographical mobility - Moved from different county within same state (%) - Black or African American
Geographical mobility - Moved from different county within same state (%) - Asian
Geographical mobility - Moved from different county within same state (%) - Hispanic or Latino
Geographical mobility - Moved from different county within same state (%) - American Indian and Alaska Native
Geographical mobility - Moved from different county within same state (%) - Multirace
Geographical mobility - Moved from different county within same state (%) - Other Race
Geographical mobility - Moved from different state (%)
Geographical mobility - Moved from different state (%) - White
Geographical mobility - Moved from different state (%) - Black or African American
Geographical mobility - Moved from different state (%) - Asian
Geographical mobility - Moved from different state (%) - Hispanic or Latino
Geographical mobility - Moved from different state (%) - American Indian and Alaska Native
Geographical mobility - Moved from different state (%) - Multirace
Geographical mobility - Moved from different state (%) - Other Race
Geographical mobility - Moved from abroad (%)
Geographical mobility - Moved from abroad (%) - White
Geographical mobility - Moved from abroad (%) - Black or African American
Geographical mobility - Moved from abroad (%) - Asian
Geographical mobility - Moved from abroad (%) - Hispanic or Latino
Geographical mobility - Moved from abroad (%) - American Indian and Alaska Native
Geographical mobility - Moved from abroad (%) - Multirace
Geographical mobility - Moved from abroad (%) - Other Race
Place of birth for the foreign-born population - Ireland (%)
Place of birth for the foreign-born population - Denmark (%)
Place of birth for the foreign-born population - Norway (%)
Place of birth for the foreign-born population - Sweden (%)
Place of birth for the foreign-born population - United Kingdom (%)
Place of birth for the foreign-born population - England (%)
Place of birth for the foreign-born population - Scotland (%)
Place of birth for the foreign-born population - Other Northern Europe (%)
Place of birth for the foreign-born population - Austria (%)
Place of birth for the foreign-born population - Belgium (%)
Place of birth for the foreign-born population - France (%)
Place of birth for the foreign-born population - Germany (%)
Place of birth for the foreign-born population - Netherlands (%)
Place of birth for the foreign-born population - Switzerland (%)
Place of birth for the foreign-born population - Other Western Europe (%)
Place of birth for the foreign-born population - Greece (%)
Place of birth for the foreign-born population - Italy (%)
Place of birth for the foreign-born population - Portugal (%)
Place of birth for the foreign-born population - Spain (%)
Place of birth for the foreign-born population - Other Southern Europe (%)
Place of birth for the foreign-born population - Albania (%)
Place of birth for the foreign-born population - Belarus (%)
Place of birth for the foreign-born population - Bosnia and Herzegovina (%)
Place of birth for the foreign-born population - Bulgaria (%)
Place of birth for the foreign-born population - Croatia (%)
Place of birth for the foreign-born population - Czechoslovakia (%)
Place of birth for the foreign-born population - Hungary (%)
Place of birth for the foreign-born population - Latvia (%)
Place of birth for the foreign-born population - Lithuania (%)
Place of birth for the foreign-born population - North Macedonia (Macedonia) (%)
Place of birth for the foreign-born population - Moldova (%)
Place of birth for the foreign-born population - Poland (%)
Place of birth for the foreign-born population - Romania (%)
Place of birth for the foreign-born population - Russia (%)
Place of birth for the foreign-born population - Serbia (%)
Place of birth for the foreign-born population - Ukraine (%)
Place of birth for the foreign-born population - Other Eastern Europe (%)
Place of birth for the foreign-born population - China (%)
Place of birth for the foreign-born population - Hong Kong (%)
Place of birth for the foreign-born population - Taiwan (%)
Place of birth for the foreign-born population - Japan (%)
Place of birth for the foreign-born population - Korea (%)
Place of birth for the foreign-born population - Other Eastern Asia (%)
Place of birth for the foreign-born population - Afghanistan (%)
Place of birth for the foreign-born population - Bangladesh (%)
Place of birth for the foreign-born population - India (%)
Place of birth for the foreign-born population - Iran (%)
Place of birth for the foreign-born population - Kazakhstan (%)
Place of birth for the foreign-born population - Nepal (%)
Place of birth for the foreign-born population - Pakistan (%)
Place of birth for the foreign-born population - Sri Lanka (%)
Place of birth for the foreign-born population - Uzbekistan (%)
Place of birth for the foreign-born population - Other South Central Asia (%)
Place of birth for the foreign-born population - Burma (%)
Place of birth for the foreign-born population - Cambodia (%)
Place of birth for the foreign-born population - Indonesia (%)
Place of birth for the foreign-born population - Laos (%)
Place of birth for the foreign-born population - Malaysia (%)
Place of birth for the foreign-born population - Philippines (%)
Place of birth for the foreign-born population - Singapore (%)
Place of birth for the foreign-born population - Thailand (%)
Place of birth for the foreign-born population - Vietnam (%)
Place of birth for the foreign-born population - Other South Eastern Asia (%)
Place of birth for the foreign-born population - Armenia (%)
Place of birth for the foreign-born population - Iraq (%)
Place of birth for the foreign-born population - Israel (%)
Place of birth for the foreign-born population - Jordan (%)
Place of birth for the foreign-born population - Kuwait (%)
Place of birth for the foreign-born population - Lebanon (%)
Place of birth for the foreign-born population - Saudi Arabia (%)
Place of birth for the foreign-born population - Syria (%)
Place of birth for the foreign-born population - Turkey (%)
Place of birth for the foreign-born population - Yemen (%)
Place of birth for the foreign-born population - Other Western Asia (%)
Place of birth for the foreign-born population - Eritrea (%)
Place of birth for the foreign-born population - Ethiopia (%)
Place of birth for the foreign-born population - Kenya (%)
Place of birth for the foreign-born population - Somalia (%)
Place of birth for the foreign-born population - Uganda (%)
Place of birth for the foreign-born population - Zimbabwe (%)
Place of birth for the foreign-born population - Other Eastern Africa (%)
Place of birth for the foreign-born population - Cameroon (%)
Place of birth for the foreign-born population - Congo (%)
Place of birth for the foreign-born population - Democratic Republic of Congo (Zaire) (%)
Place of birth for the foreign-born population - Other Middle Africa (%)
Place of birth for the foreign-born population - Egypt (%)
Place of birth for the foreign-born population - Morocco (%)
Place of birth for the foreign-born population - Sudan (%)
Place of birth for the foreign-born population - Other Northern Africa (%)
Place of birth for the foreign-born population - South Africa (%)
Place of birth for the foreign-born population - Other Southern Africa (%)
Place of birth for the foreign-born population - Cabo Verde (%)
Place of birth for the foreign-born population - Ghana (%)
Place of birth for the foreign-born population - Liberia (%)
Place of birth for the foreign-born population - Nigeria (%)
Place of birth for the foreign-born population - Senegal (%)
Place of birth for the foreign-born population - Sierra Leone (%)
Place of birth for the foreign-born population - Other Western Africa (%)
Place of birth for the foreign-born population - Australia (%)
Place of birth for the foreign-born population - New Zealand (%)
Place of birth for the foreign-born population - Fiji (%)
Place of birth for the foreign-born population - Micronesia (%)
Place of birth for the foreign-born population - Bahamas (%)
Place of birth for the foreign-born population - Barbados (%)
Place of birth for the foreign-born population - Cuba (%)
Place of birth for the foreign-born population - Dominica (%)
Place of birth for the foreign-born population - Dominican Republic (%)
Place of birth for the foreign-born population - Grenada (%)
Place of birth for the foreign-born population - Haiti (%)
Place of birth for the foreign-born population - Jamaica (%)
Place of birth for the foreign-born population - St. Vincent and the Grenadines (%)
Place of birth for the foreign-born population - Trinidad and Tobago (%)
Place of birth for the foreign-born population - West Indies (%)
Place of birth for the foreign-born population - Other Caribbean (%)
Place of birth for the foreign-born population - Belize (%)
Place of birth for the foreign-born population - Costa Rica (%)
Place of birth for the foreign-born population - El Salvador (%)
Place of birth for the foreign-born population - Guatemala (%)
Place of birth for the foreign-born population - Honduras (%)
Place of birth for the foreign-born population - Mexico (%)
Place of birth for the foreign-born population - Nicaragua (%)
Place of birth for the foreign-born population - Panama (%)
Place of birth for the foreign-born population - Other Central America (%)
Place of birth for the foreign-born population - Argentina (%)
Place of birth for the foreign-born population - Bolivia (%)
Place of birth for the foreign-born population - Brazil (%)
Place of birth for the foreign-born population - Chile (%)
Place of birth for the foreign-born population - Colombia (%)
Place of birth for the foreign-born population - Ecuador (%)
Place of birth for the foreign-born population - Guyana (%)
Place of birth for the foreign-born population - Peru (%)
Place of birth for the foreign-born population - Uruguay (%)
Place of birth for the foreign-born population - Venezuela (%)
Place of birth for the foreign-born population - Other South America (%)
Place of birth for the foreign-born population - Canada (%)
Place of birth for the foreign-born population - Other Northern America (%)
Place of birth for the foreign-born population - Other (%)
Latest news about races in Liberty, MO collected exclusively by city-data.com from local newspapers, TV, and radio stations
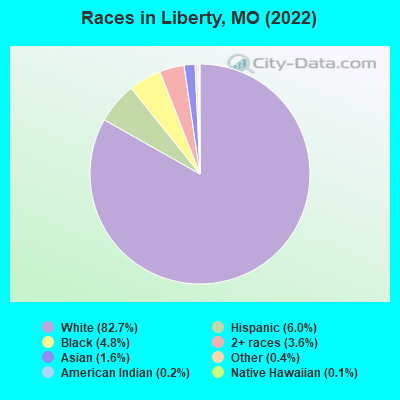
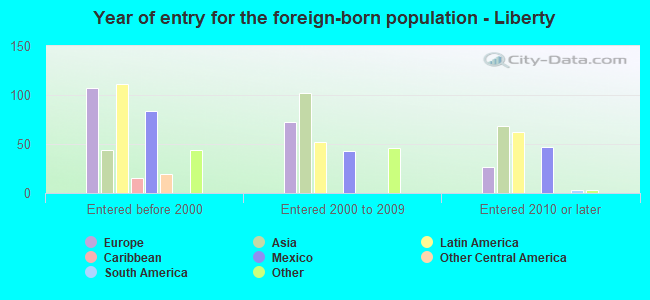
According to 2022 data, the most numerous races in Liberty, MO are White alone (25,439 residents), Black alone (1,470 residents), and Two or more races (1,111 residents). 96.7% of Liberty residents speak English at home. 2.5% of Liberty, MO residents are foreign-born (0.7% born in Europe, 0.7% born in Latin America, 0.7% born in Asia), which is 58.2% less than the foreign-born rate of 4.0% across the entire state of Missouri.
Race distribution in Liberty
2000 2022
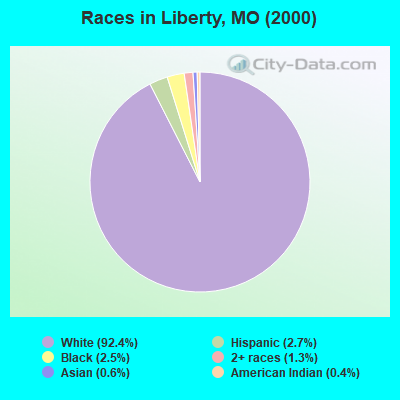
4,686,474 83.8% White alone 625,667 11.2% Black alone 118,592 2.1% Hispanic 71,905 1.3% Two or more races 61,041 1.1% Asian alone 23,302 0.4% American Indian alone 5,291 0.09% Other race alone 2,939 0.05% Native Hawaiian and Other
4,733,411 76.6% White alone 656,739 10.6% Black alone 316,300 5.1% Two or more races 291,763 4.7% Hispanic 132,436 2.1% Asian alone 27,467 0.4% Other race alone 12,313 0.2% American Indian alone 7,528 0.1% Native Hawaiian and Other
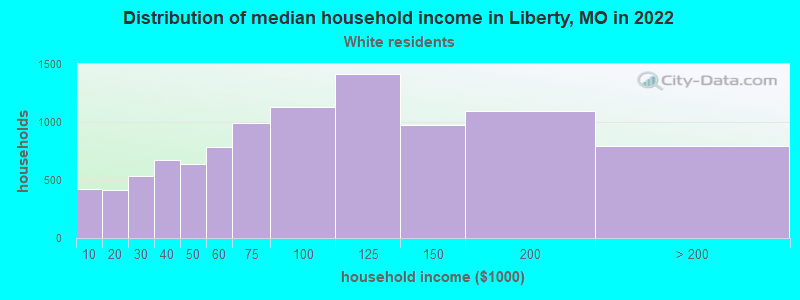
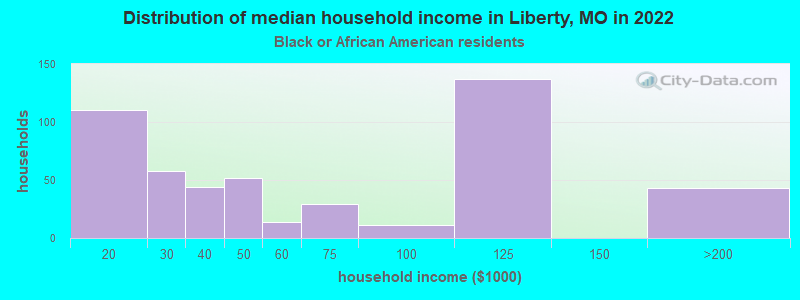
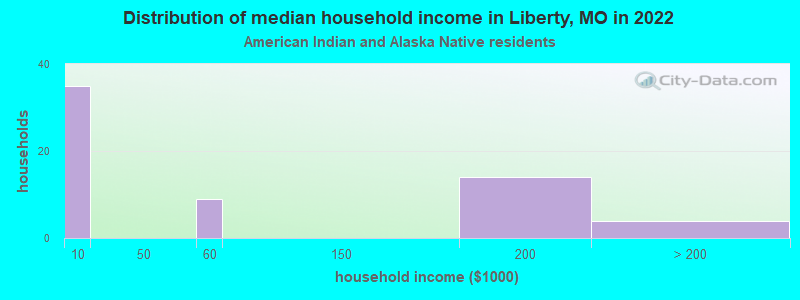
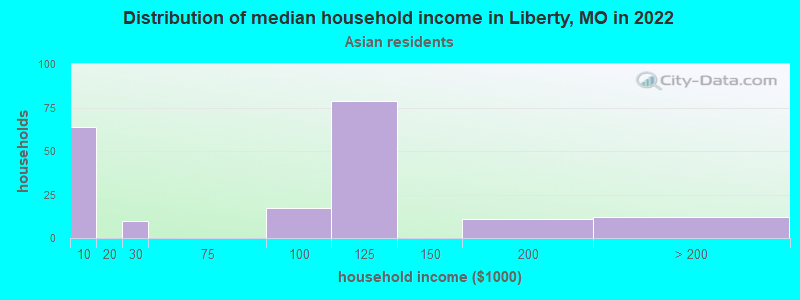
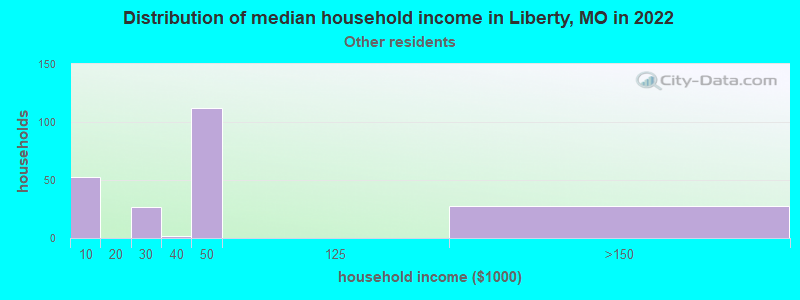
Income and house value in Liberty Median household income in 2022 $89,447 White non-Hispanic householders$45,840 Black householders$97,752 Asian householders$47,490 Some other race householders$80,052 Two or more races householdersMedian 2022 house value $286,077 White Non-Hispanic householders$201,192 Black or African American householders$325,237 American Indian or Alaska Native householders $385,970 Asian householders$263,801 Some other race householders$238,710 Two or more races householders$291,002 Hispanic or Latino householders
Median age by race in Liberty
39.7 Median age for White residents36.8 41.7 33.0 Median age for Black or African American residents34.5 33.6 45.3 Median age for American Indian / Alaska Native residents47.4 12.3 27.9 Median age for Asian residents32.9 25.8 33.1 Median age for Native Hawaiian / Pacific Islander residents-683,513,838.1 23.6 30.8 Median age for Other race residents30.4 26.8 39.5 Median age for Two or more races residents46.6 22.7 39.8 Median age for White alone residents38.2 41.9 29.3 Median age for Hispanic or Latino residents29.7 20.6
Owner/renter occupied households by race in Liberty
House owners and renters - White residents 7,562 76.3% Owner occupied2,342 23.7% Renter occupiedHouse owners and renters - Black or African American residents 179 33.4% Owner occupied356 66.6% Renter occupiedHouse owners and renters - American Indian / Alaska Native residents 33 51.6% Owner occupied31 48.4% Renter occupiedHouse owners and renters - Asian residents 55 24.2% Owner occupied172 75.8% Renter occupiedHouse owners and renters - Native Hawaiian / Pacific Islander residents 16 100.0% Renter occupiedHouse owners and renters - Other race residents 24 26.6% Owner occupied67 73.4% Renter occupiedHouse owners and renters - Two or more races residents 288 79.1% Owner occupied76 20.9% Renter occupiedHouse owners and renters - White alone residents 7,450 76.4% Owner occupied2,306 23.6% Renter occupiedHouse owners and renters - Hispanic or Latino residents 177 58.1% Owner occupied128 41.9% Renter occupied
Language usage in Liberty
English speakers - Total 96.7% of residents of Liberty speak English at home.
2.2% of residents speak Spanish at home 372 58.7% Speak English very well262 41.3% Speak English less than very well1.3% of residents speak other language at home 278 76.6% Speak English very well85 23.4% Speak English less than very well
English speakers - Born in the United States 97.3% of residents of Liberty speak English at home.
1.4% of residents speak Spanish at home 119 73.0% Speak English very well44 27.0% Speak English less than very well0.9% of residents speak other language at home 103 100.0% Speak English very well
English speakers - Native, born elsewhere 87.0% of residents of Liberty speak English at home.
23.4% of residents speak Spanish at home 22 22.7% Speak English very well75 77.3% Speak English less than very well
English speakers - Foreign-born 26.5% of residents of Liberty speak English at home.
30.1% of residents speak Spanish at home 98 46.4% Speak English very well113 53.6% Speak English less than very well27.7% of residents speak other language at home 126 64.9% Speak English very well68 35.1% Speak English less than very well
White (Caucasian) - Speak only English Native:
98.8% (24,072)Foreign-born:
54.6% (121)
White (Caucasian) - Speak another language Native:
1.2% (303)Foreign-born:
39.4% (87)
Black or African American - Speak another language Native:
1.5% (19)Foreign-born:
89.4% (42)
Asian - Speak only English Native:
92.6% (295)Foreign-born:
29.2% (54)
Asian - Speak another language Native:
13.3% (42)Foreign-born:
38.4% (70)
Native Hawaiian / Pacific Islander - Speak another language Native:
29.7% (6)Foreign-born:
94.6% (8)
Other race - Speak another language Native:
2.0% (8)Foreign-born:
98.4% (141)
Two or more races - Speak only English Native:
89.6% (1,329)Foreign-born:
18.5% (12)
Two or more races - Speak another language Native:
11.1% (165)Foreign-born:
100.0% (65)
White alone - Speak only English Native:
99.0% (23,445)Foreign-born:
55.6% (103)
White alone - Speak another language Native:
1.0% (237)Foreign-born:
28.4% (52)
Hispanic or Latino - Speak only English Native:
83.3% (1,298)Foreign-born:
7.9% (21)
Hispanic or Latino - Speak another language Native:
16.1% (251)Foreign-born:
85.1% (224)
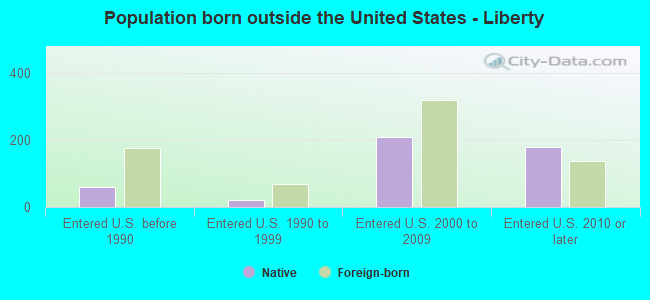
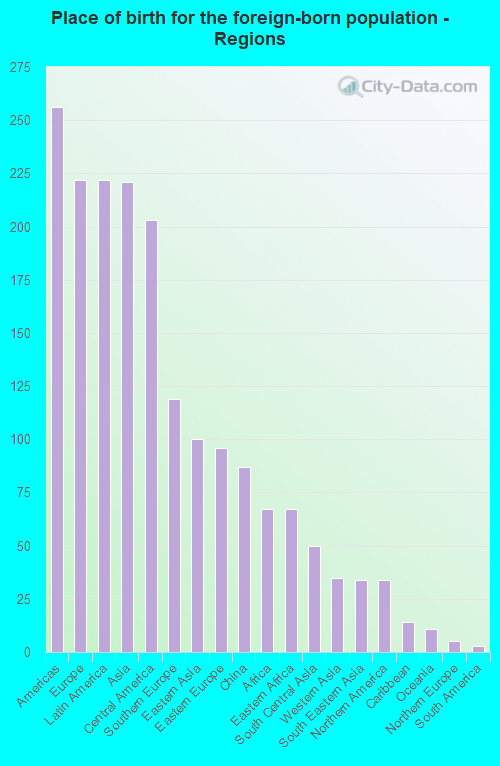
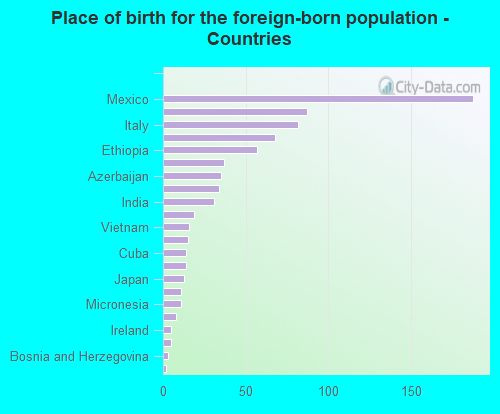
Foreign-born residents in Liberty 778 residents are foreign born (0.7% Europe , 0.7% Latin America , 0.7% Asia ).
This city:
2.5%Missouri:
4.2%
Marital status for residents in Liberty Marital status - White (Caucasian) population 15 years and over
Males 26.5% Never married60.9% Now married1.3% Separated1.5% Widowed9.7% DivorcedFemales 20.5% Never married53.9% Now married3.0% Separated9.0% Widowed13.5% DivorcedWomen who gave birth in the past 12 months Now married:
97.5% (228)Unmarried:
2.5% (6)
Women who did not give birth in the past 12 months Now married:
49.9% (2,757)Unmarried:
50.1% (2,766)
Marital status - Black or African American population 15 years and over
Males 45.1% Never married46.5% Now married0.0% Separated0.0% Widowed8.4% DivorcedFemales 41.8% Never married47.2% Now married2.7% Separated4.1% Widowed4.3% DivorcedWomen who gave birth in the past 12 months Now married:
45.8% (31)Unmarried:
54.2% (37)
Women who did not give birth in the past 12 months Now married:
56.2% (229)Unmarried:
43.8% (178)
Marital status - American Indian / Alaska Native population 15 years and over
Males 63.4% Never married31.7% Now married0.0% Separated0.0% Widowed4.9% DivorcedFemales 56.2% Never married18.8% Now married0.0% Separated25.0% Widowed0.0% DivorcedWomen who did not give birth in the past 12 months Now married:
0.0% (0)Unmarried:
100.0% (9)
Marital status - Asian population 15 years and over
Males 46.6% Never married51.1% Now married0.0% Separated0.0% Widowed2.2% DivorcedFemales 11.7% Never married83.1% Now married0.0% Separated1.4% Widowed3.8% DivorcedWomen who did not give birth in the past 12 months Now married:
82.4% (166)Unmarried:
17.6% (36)
Marital status - Native Hawaiian / Pacific Islander population 15 years and over
Males 0.0% Never married100.0% Now married0.0% Separated0.0% Widowed0.0% DivorcedFemales 100.0% Never married0.0% Now married0.0% Separated0.0% Widowed0.0% DivorcedWomen who did not give birth in the past 12 months Now married:
0.0% (0)Unmarried:
100.0% (18)
Marital status - Other race population 15 years and over
Males 48.9% Never married30.6% Now married0.0% Separated0.0% Widowed20.4% DivorcedFemales 46.4% Never married41.8% Now married0.0% Separated0.0% Widowed11.8% DivorcedWomen who did not give birth in the past 12 months Now married:
16.9% (16)Unmarried:
83.1% (78)
Marital status - Two or more races population 15 years and over
Males 31.8% Never married50.3% Now married0.0% Separated1.0% Widowed16.8% DivorcedFemales 25.4% Never married43.0% Now married0.0% Separated8.9% Widowed22.7% DivorcedWomen who did not give birth in the past 12 months Now married:
44.6% (146)Unmarried:
55.4% (181)
Marital status - White alone, not Hispanic / Latino population 15 years and over
Males 25.3% Never married61.6% Now married1.4% Separated1.6% Widowed10.1% DivorcedFemales 20.7% Never married53.9% Now married2.4% Separated9.1% Widowed13.9% DivorcedWomen who gave birth in the past 12 months Now married:
97.5% (229)Unmarried:
2.5% (6)
Women who did not give birth in the past 12 months Now married:
49.3% (2,670)Unmarried:
50.7% (2,740)
Marital status - Hispanic or Latino population 15 years and over
Males 49.8% Never married36.1% Now married0.0% Separated0.0% Widowed14.1% DivorcedFemales 28.6% Never married47.7% Now married16.3% Separated4.4% Widowed3.0% DivorcedWomen who did not give birth in the past 12 months Now married:
42.1% (108)Unmarried:
57.9% (149)
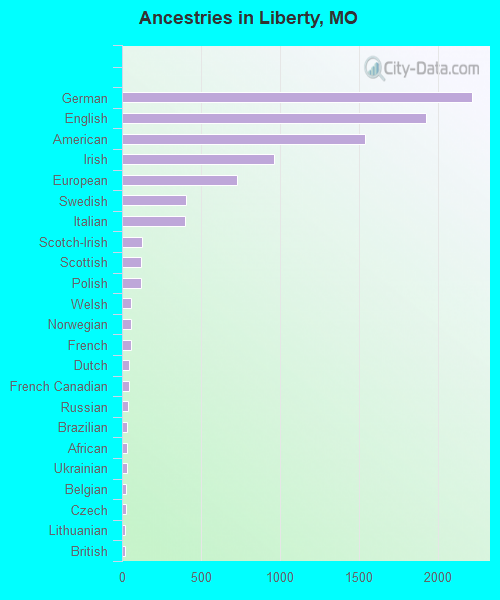
Ancestries in Liberty
2,214 18.4% German1,923 16.0% English1,539 12.8% American963 8.0% Irish728 6.1% European407 3.4% Swedish400 3.3% Italian125 1.0% Scotch-Irish119 1.0% Scottish118 1.0% Polish57 0.5% Welsh56 0.5% Norwegian55 0.5% French46 0.4% Dutch45 0.4% French Canadian35 0.3% Russian33 0.3% Brazilian33 0.3% African33 0.3% Ukrainian28 0.2% Belgian25 0.2% Czech22 0.2% Lithuanian21 0.2% British19 0.2% Czechoslovakian18 0.1% Portuguese14 0.1% Danish13 0.1% Greek12 0.10% Guyanese9 0.07% Albanian8 0.07% Eastern European5 0.04% Ethiopian3 0.02% Scandinavian3 0.02% Assyrian3 0.02% Yugoslavian2 0.02% Kenyan
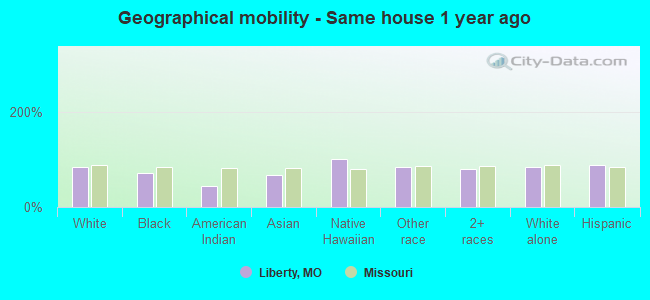
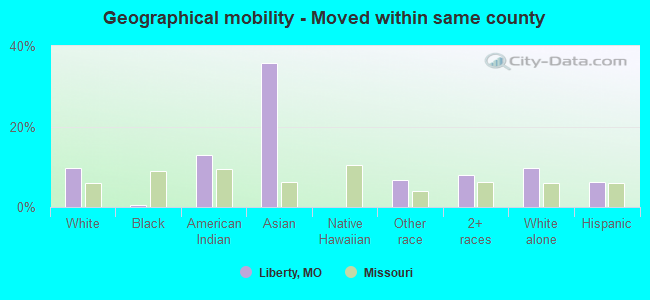
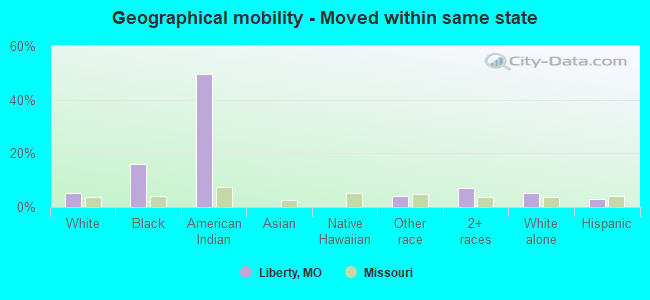
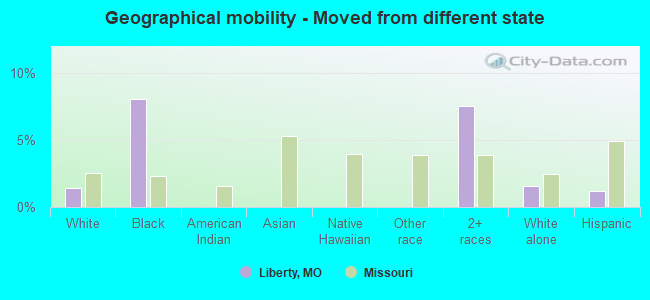
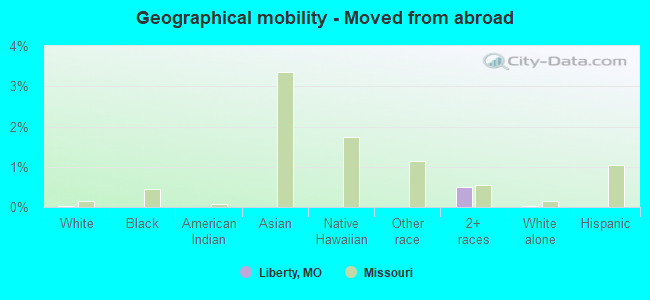
Geographical mobility in Liberty Same house 1 year ago 21,497 82.9% White (Caucasian)1,001 71.2% Black or African American45 45.3% American Indian / Alaska Native294 67.0% Asian37 100.0% Native Hawaiian / Pacific Islander448 84.4% Other race1,307 79.5% Two or more races20,796 82.5% White alone, not Hispanic / Latino1,620 87.6% Hispanic or LatinoMoved within same county 2,538 9.8% White / Caucasian8 0.5% Black or African American13 13.0% American Indian / Alaska Native157 35.9% Asian35 6.7% Other race131 8.0% Two or more races2,429 9.6% White alone, not Hispanic / Latino117 6.3% Hispanic or LatinoMoved within same state 1,342 5.2% White / Caucasian225 16.0% Black or African American50 49.6% American Indian / Alaska Native22 4.2% Other race114 6.9% Two or more races1,310 5.2% White alone, not Hispanic / Latino55 3.0% Hispanic or LatinoMoved from different state 375 1.4% White / Caucasian113 8.0% Black or African American123 7.5% Two or more races386 1.5% White alone, not Hispanic / Latino23 1.2% Hispanic or LatinoMoved from abroad 7 0.0% White8 0.5% Two or more races7 0.0% White alone, not Hispanic / Latino
Children Nativity (place of birth) in Liberty
Children under 6 years - Living with two parents Both parents native 1,505 100.0% NativeOne native, one foreign-born parent 10 100.0% NativeChildren under 6 years - Living with one parent Native parent 589 100.0% NativeForeign-born parent 69 100.0% NativeChildren 6 to 17 years - Living with two parents Both parents native 3,683 99.3% Native25 0.7% Foreign-bornBoth parents foreign-born 48 100.0% NativeOne native, one foreign-born parent 7 100.0% NativeChildren 6 to 17 years - Living with one parent Native parent 1,509 97.4% Native40 2.6% Foreign-bornForeign-born parent 3 44.1% Native4 55.9% Foreign-born
Grandparents responsible for own grandchildren in Liberty
Grandparents (30 to 59 years) White / Caucasian 67 53.4% Responsible for grandchildren58 46.6% Not responsible for grandchildrenTwo or more races 11 100.0% Responsible for grandchildrenWhite alone, not Hispanic / Latino 67 57.6% Responsible for grandchildren50 42.4% Not responsible for grandchildrenHispanic or Latino 10 100.0% Not responsible for grandchildrenGrandparents (60 years and over) White / Caucasian 113 32.4% Responsible for grandchildren236 67.6% Not responsible for grandchildrenWhite alone, not Hispanic / Latino 117 38.9% Responsible for grandchildren184 61.1% Not responsible for grandchildrenHispanic or Latino 51 100.0% Not responsible for grandchildren