Races in Madison, Wisconsin (WI) Detailed Stats
Data:
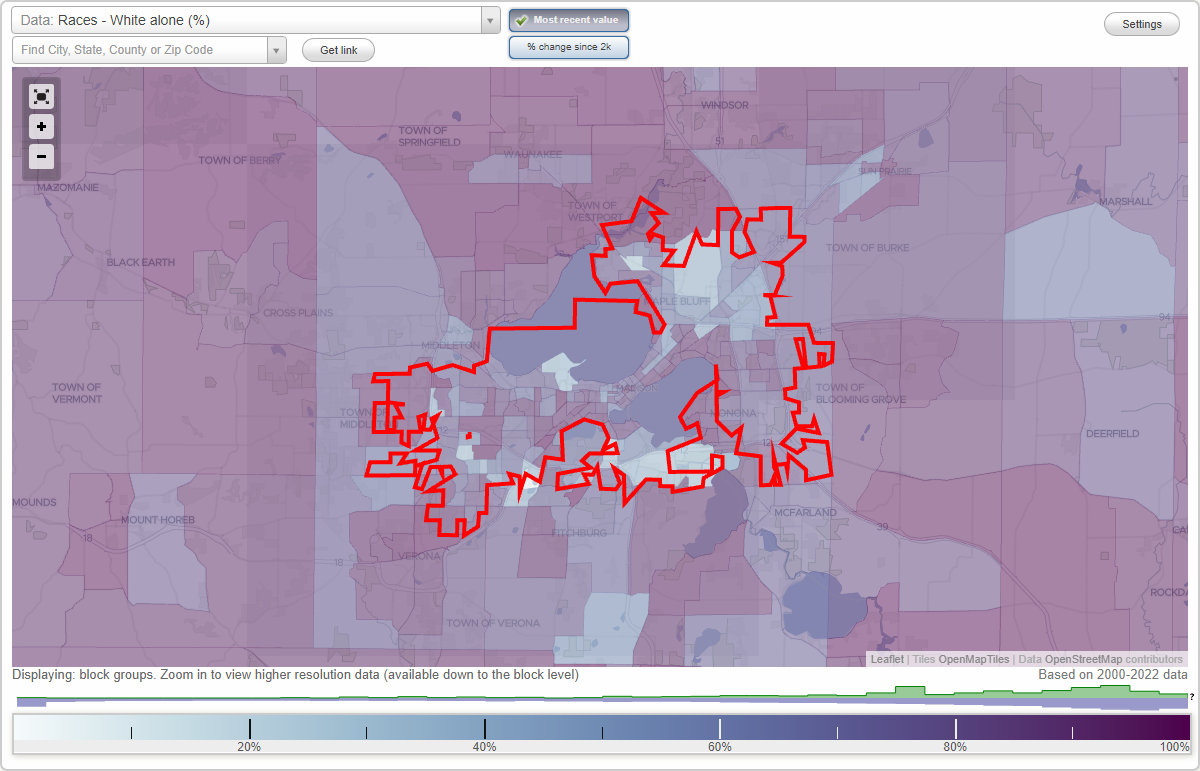
Races - White alone (%)
Races - White alone (% change since 2000)
Races - Black alone (%)
Races - Black alone (% change since 2000)
Races - American Indian alone (%)
Races - American Indian alone (% change since 2000)
Races - Asian alone (%)
Races - Asian alone (% change since 2000)
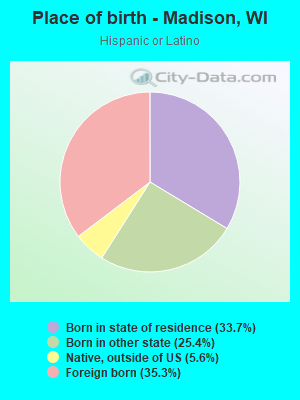
Races - Hispanic (%)
Races - Hispanic (% change since 2000)
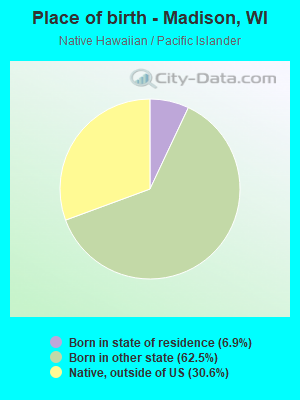
Races - Native Hawaiian and Other Pacific Islander alone (%)
Races - Native Hawaiian and Other Pacific Islander alone (% change since 2000)
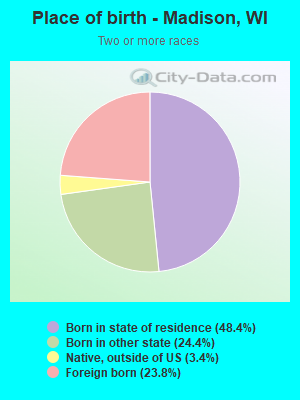
Races - Two or more races(%)
Races - Two or more races(% change since 2000)
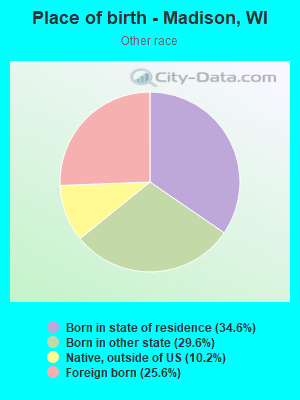
Races - Other race alone (%)
Races - Other race alone (% change since 2000)
Racial diversity
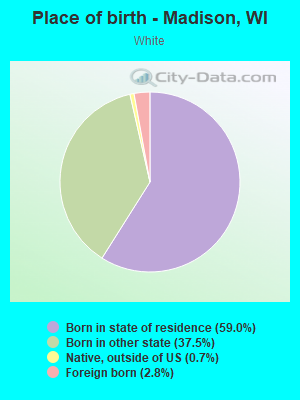
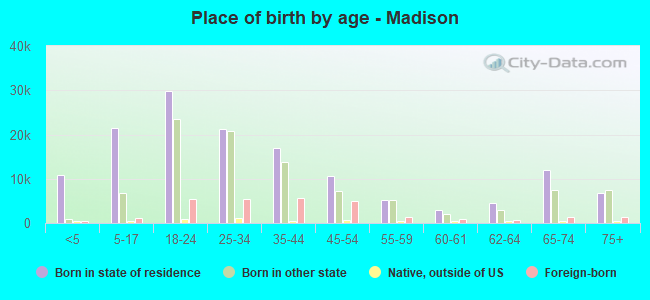
Place of birth - Born in state of residence (%)
Place of birth - Born in state of residence (%) - White
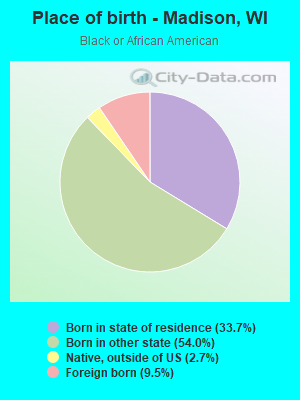
Place of birth - Born in state of residence (%) - Black or African American
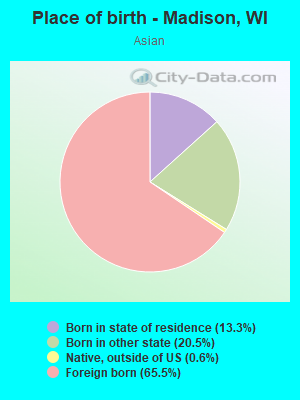
Place of birth - Born in state of residence (%) - Asian
Place of birth - Born in state of residence (%) - Hispanic or Latino
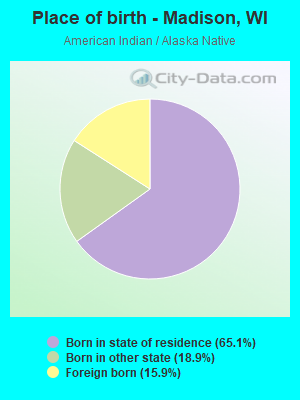
Place of birth - Born in state of residence (%) - American Indian and Alaska Native
Place of birth - Born in state of residence (%) - Multirace
Place of birth - Born in state of residence (%) - Other Race
Place of birth - Born in other state (%)
Place of birth - Born in other state (%) - White
Place of birth - Born in other state (%) - Black or African American
Place of birth - Born in other state (%) - Asian
Place of birth - Born in other state (%) - Hispanic or Latino
Place of birth - Born in other state (%) - American Indian and Alaska Native
Place of birth - Born in other state (%) - Multirace
Place of birth - Born in other state (%) - Other Race
Place of birth - Native, outside of US (%)
Place of birth - Native, outside of US (%) - White
Place of birth - Native, outside of US (%) - Black or African American
Place of birth - Native, outside of US (%) - Asian
Place of birth - Native, outside of US (%) - Hispanic or Latino
Place of birth - Native, outside of US (%) - American Indian and Alaska Native
Place of birth - Native, outside of US (%) - Multirace
Place of birth - Native, outside of US (%) - Other Race
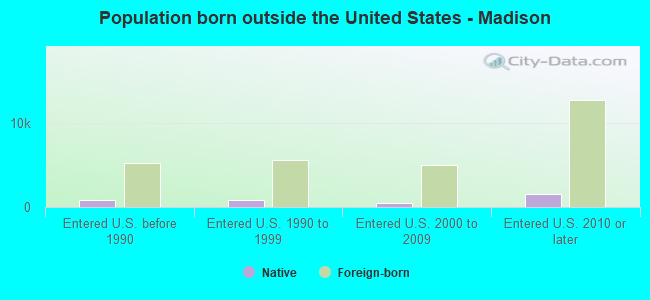
Place of birth - Foreign born (%)
Place of birth - Foreign born (%) - White
Place of birth - Foreign born (%) - Black or African American
Place of birth - Foreign born (%) - Asian
Place of birth - Foreign born (%) - Hispanic or Latino
Place of birth - Foreign born (%) - American Indian and Alaska Native
Place of birth - Foreign born (%) - Multirace
Place of birth - Foreign born (%) - Other Race
Residents speaking English at home (%)
Residents speaking English at home - Born in the United States (%)
Residents speaking English at home - Native, born elsewhere (%)
Residents speaking English at home - Foreign born (%)
Residents speaking Spanish at home (%)
Residents speaking Spanish at home - Born in the United States (%)
Residents speaking Spanish at home - Native, born elsewhere (%)
Residents speaking Spanish at home - Foreign born (%)
Residents speaking other language at home (%)
Residents speaking other language at home - Born in the United States (%)
Residents speaking other language at home - Native, born elsewhere (%)
Residents speaking other language at home - Foreign born (%)
Marital status - Never married (%)
Marital status - Now married (%)
Marital status - Separated (%)
Marital status - Widowed (%)
Marital status - Divorced (%)
Ancestries Reported - Arab (%)
Ancestries Reported - Czech (%)
Ancestries Reported - Danish (%)
Ancestries Reported - Dutch (%)
Ancestries Reported - English (%)
Ancestries Reported - French (%)
Ancestries Reported - French Canadian (%)
Ancestries Reported - German (%)
Ancestries Reported - Greek (%)
Ancestries Reported - Hungarian (%)
Ancestries Reported - Irish (%)
Ancestries Reported - Italian (%)
Ancestries Reported - Lithuanian (%)
Ancestries Reported - Norwegian (%)
Ancestries Reported - Polish (%)
Ancestries Reported - Portuguese (%)
Ancestries Reported - Russian (%)
Ancestries Reported - Scotch-Irish (%)
Ancestries Reported - Scottish (%)
Ancestries Reported - Slovak (%)
Ancestries Reported - Subsaharan African (%)
Ancestries Reported - Swedish (%)
Ancestries Reported - Swiss (%)
Ancestries Reported - Ukrainian (%)
Ancestries Reported - United States (%)
Ancestries Reported - Welsh (%)
Ancestries Reported - West Indian (%)
Ancestries Reported - Other (%)
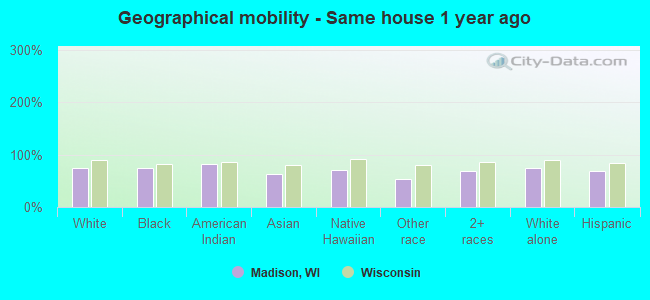
Geographical mobility - Same house 1 year ago (%)
Geographical mobility - Same house 1 year ago (%) - White
Geographical mobility - Same house 1 year ago (%) - Black or African American
Geographical mobility - Same house 1 year ago (%) - Asian
Geographical mobility - Same house 1 year ago (%) - Hispanic or Latino
Geographical mobility - Same house 1 year ago (%) - American Indian and Alaska Native
Geographical mobility - Same house 1 year ago (%) - Multirace
Geographical mobility - Same house 1 year ago (%) - Other Race
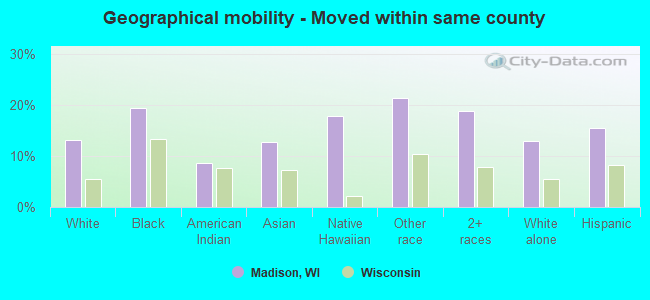
Geographical mobility - Moved within same county (%)
Geographical mobility - Moved within same county (%) - White
Geographical mobility - Moved within same county (%) - Black or African American
Geographical mobility - Moved within same county (%) - Asian
Geographical mobility - Moved within same county (%) - Hispanic or Latino
Geographical mobility - Moved within same county (%) - American Indian and Alaska Native
Geographical mobility - Moved within same county (%) - Multirace
Geographical mobility - Moved within same county (%) - Other Race
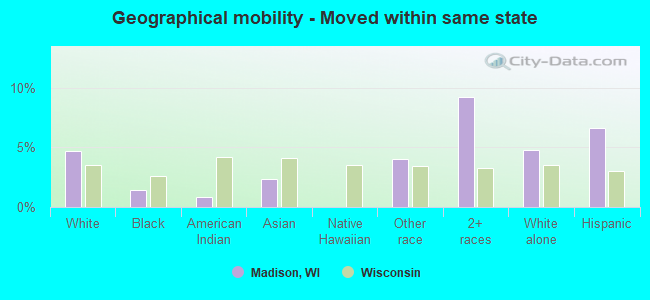
Geographical mobility - Moved from different county within same state (%)
Geographical mobility - Moved from different county within same state (%) - White
Geographical mobility - Moved from different county within same state (%) - Black or African American
Geographical mobility - Moved from different county within same state (%) - Asian
Geographical mobility - Moved from different county within same state (%) - Hispanic or Latino
Geographical mobility - Moved from different county within same state (%) - American Indian and Alaska Native
Geographical mobility - Moved from different county within same state (%) - Multirace
Geographical mobility - Moved from different county within same state (%) - Other Race
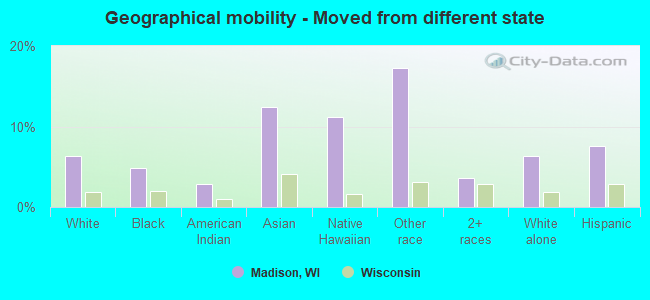
Geographical mobility - Moved from different state (%)
Geographical mobility - Moved from different state (%) - White
Geographical mobility - Moved from different state (%) - Black or African American
Geographical mobility - Moved from different state (%) - Asian
Geographical mobility - Moved from different state (%) - Hispanic or Latino
Geographical mobility - Moved from different state (%) - American Indian and Alaska Native
Geographical mobility - Moved from different state (%) - Multirace
Geographical mobility - Moved from different state (%) - Other Race
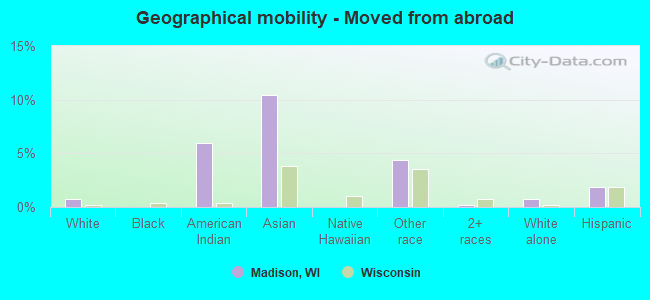
Geographical mobility - Moved from abroad (%)
Geographical mobility - Moved from abroad (%) - White
Geographical mobility - Moved from abroad (%) - Black or African American
Geographical mobility - Moved from abroad (%) - Asian
Geographical mobility - Moved from abroad (%) - Hispanic or Latino
Geographical mobility - Moved from abroad (%) - American Indian and Alaska Native
Geographical mobility - Moved from abroad (%) - Multirace
Geographical mobility - Moved from abroad (%) - Other Race
Place of birth for the foreign-born population - Ireland (%)
Place of birth for the foreign-born population - Denmark (%)
Place of birth for the foreign-born population - Norway (%)
Place of birth for the foreign-born population - Sweden (%)
Place of birth for the foreign-born population - United Kingdom (%)
Place of birth for the foreign-born population - England (%)
Place of birth for the foreign-born population - Scotland (%)
Place of birth for the foreign-born population - Other Northern Europe (%)
Place of birth for the foreign-born population - Austria (%)
Place of birth for the foreign-born population - Belgium (%)
Place of birth for the foreign-born population - France (%)
Place of birth for the foreign-born population - Germany (%)
Place of birth for the foreign-born population - Netherlands (%)
Place of birth for the foreign-born population - Switzerland (%)
Place of birth for the foreign-born population - Other Western Europe (%)
Place of birth for the foreign-born population - Greece (%)
Place of birth for the foreign-born population - Italy (%)
Place of birth for the foreign-born population - Portugal (%)
Place of birth for the foreign-born population - Spain (%)
Place of birth for the foreign-born population - Other Southern Europe (%)
Place of birth for the foreign-born population - Albania (%)
Place of birth for the foreign-born population - Belarus (%)
Place of birth for the foreign-born population - Bosnia and Herzegovina (%)
Place of birth for the foreign-born population - Bulgaria (%)
Place of birth for the foreign-born population - Croatia (%)
Place of birth for the foreign-born population - Czechoslovakia (%)
Place of birth for the foreign-born population - Hungary (%)
Place of birth for the foreign-born population - Latvia (%)
Place of birth for the foreign-born population - Lithuania (%)
Place of birth for the foreign-born population - North Macedonia (Macedonia) (%)
Place of birth for the foreign-born population - Moldova (%)
Place of birth for the foreign-born population - Poland (%)
Place of birth for the foreign-born population - Romania (%)
Place of birth for the foreign-born population - Russia (%)
Place of birth for the foreign-born population - Serbia (%)
Place of birth for the foreign-born population - Ukraine (%)
Place of birth for the foreign-born population - Other Eastern Europe (%)
Place of birth for the foreign-born population - China (%)
Place of birth for the foreign-born population - Hong Kong (%)
Place of birth for the foreign-born population - Taiwan (%)
Place of birth for the foreign-born population - Japan (%)
Place of birth for the foreign-born population - Korea (%)
Place of birth for the foreign-born population - Other Eastern Asia (%)
Place of birth for the foreign-born population - Afghanistan (%)
Place of birth for the foreign-born population - Bangladesh (%)
Place of birth for the foreign-born population - India (%)
Place of birth for the foreign-born population - Iran (%)
Place of birth for the foreign-born population - Kazakhstan (%)
Place of birth for the foreign-born population - Nepal (%)
Place of birth for the foreign-born population - Pakistan (%)
Place of birth for the foreign-born population - Sri Lanka (%)
Place of birth for the foreign-born population - Uzbekistan (%)
Place of birth for the foreign-born population - Other South Central Asia (%)
Place of birth for the foreign-born population - Burma (%)
Place of birth for the foreign-born population - Cambodia (%)
Place of birth for the foreign-born population - Indonesia (%)
Place of birth for the foreign-born population - Laos (%)
Place of birth for the foreign-born population - Malaysia (%)
Place of birth for the foreign-born population - Philippines (%)
Place of birth for the foreign-born population - Singapore (%)
Place of birth for the foreign-born population - Thailand (%)
Place of birth for the foreign-born population - Vietnam (%)
Place of birth for the foreign-born population - Other South Eastern Asia (%)
Place of birth for the foreign-born population - Armenia (%)
Place of birth for the foreign-born population - Iraq (%)
Place of birth for the foreign-born population - Israel (%)
Place of birth for the foreign-born population - Jordan (%)
Place of birth for the foreign-born population - Kuwait (%)
Place of birth for the foreign-born population - Lebanon (%)
Place of birth for the foreign-born population - Saudi Arabia (%)
Place of birth for the foreign-born population - Syria (%)
Place of birth for the foreign-born population - Turkey (%)
Place of birth for the foreign-born population - Yemen (%)
Place of birth for the foreign-born population - Other Western Asia (%)
Place of birth for the foreign-born population - Eritrea (%)
Place of birth for the foreign-born population - Ethiopia (%)
Place of birth for the foreign-born population - Kenya (%)
Place of birth for the foreign-born population - Somalia (%)
Place of birth for the foreign-born population - Uganda (%)
Place of birth for the foreign-born population - Zimbabwe (%)
Place of birth for the foreign-born population - Other Eastern Africa (%)
Place of birth for the foreign-born population - Cameroon (%)
Place of birth for the foreign-born population - Congo (%)
Place of birth for the foreign-born population - Democratic Republic of Congo (Zaire) (%)
Place of birth for the foreign-born population - Other Middle Africa (%)
Place of birth for the foreign-born population - Egypt (%)
Place of birth for the foreign-born population - Morocco (%)
Place of birth for the foreign-born population - Sudan (%)
Place of birth for the foreign-born population - Other Northern Africa (%)
Place of birth for the foreign-born population - South Africa (%)
Place of birth for the foreign-born population - Other Southern Africa (%)
Place of birth for the foreign-born population - Cabo Verde (%)
Place of birth for the foreign-born population - Ghana (%)
Place of birth for the foreign-born population - Liberia (%)
Place of birth for the foreign-born population - Nigeria (%)
Place of birth for the foreign-born population - Senegal (%)
Place of birth for the foreign-born population - Sierra Leone (%)
Place of birth for the foreign-born population - Other Western Africa (%)
Place of birth for the foreign-born population - Australia (%)
Place of birth for the foreign-born population - New Zealand (%)
Place of birth for the foreign-born population - Fiji (%)
Place of birth for the foreign-born population - Micronesia (%)
Place of birth for the foreign-born population - Bahamas (%)
Place of birth for the foreign-born population - Barbados (%)
Place of birth for the foreign-born population - Cuba (%)
Place of birth for the foreign-born population - Dominica (%)
Place of birth for the foreign-born population - Dominican Republic (%)
Place of birth for the foreign-born population - Grenada (%)
Place of birth for the foreign-born population - Haiti (%)
Place of birth for the foreign-born population - Jamaica (%)
Place of birth for the foreign-born population - St. Vincent and the Grenadines (%)
Place of birth for the foreign-born population - Trinidad and Tobago (%)
Place of birth for the foreign-born population - West Indies (%)
Place of birth for the foreign-born population - Other Caribbean (%)
Place of birth for the foreign-born population - Belize (%)
Place of birth for the foreign-born population - Costa Rica (%)
Place of birth for the foreign-born population - El Salvador (%)
Place of birth for the foreign-born population - Guatemala (%)
Place of birth for the foreign-born population - Honduras (%)
Place of birth for the foreign-born population - Mexico (%)
Place of birth for the foreign-born population - Nicaragua (%)
Place of birth for the foreign-born population - Panama (%)
Place of birth for the foreign-born population - Other Central America (%)
Place of birth for the foreign-born population - Argentina (%)
Place of birth for the foreign-born population - Bolivia (%)
Place of birth for the foreign-born population - Brazil (%)
Place of birth for the foreign-born population - Chile (%)
Place of birth for the foreign-born population - Colombia (%)
Place of birth for the foreign-born population - Ecuador (%)
Place of birth for the foreign-born population - Guyana (%)
Place of birth for the foreign-born population - Peru (%)
Place of birth for the foreign-born population - Uruguay (%)
Place of birth for the foreign-born population - Venezuela (%)
Place of birth for the foreign-born population - Other South America (%)
Place of birth for the foreign-born population - Canada (%)
Place of birth for the foreign-born population - Other Northern America (%)
Place of birth for the foreign-born population - Other (%)
Latest news about races in Madison, WI collected exclusively by city-data.com from local newspapers, TV, and radio stations
According to 2022 data, the most numerous races in Madison, WI are White alone (193,392 residents), Hispanic (22,509 residents), and Black alone (21,663 residents). 86.6% of Madison residents speak English at home. 11.1% of Madison, WI residents are foreign-born (5.7% born in Asia, 2.9% born in Latin America, 1.5% born in Europe), which is 55.2% greater than the foreign-born rate of 5.0% across the entire state of Wisconsin.
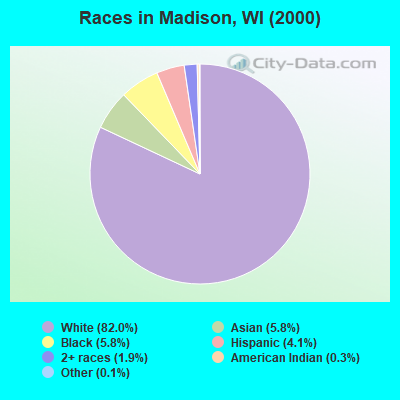
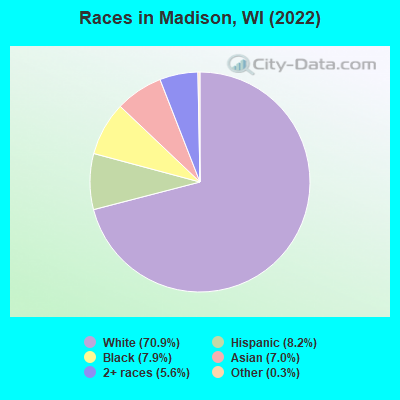
Race distribution in Madison
2000 2022
170,509 82.0% White alone 11,987 5.8% Black alone 12,000 5.8% Asian alone 8,512 4.1% Hispanic 4,025 1.9% Two or more races 648 0.3% American Indian alone 300 0.1% Other race alone 73 0.04% Native Hawaiian and Other
193,392 70.9% White alone 22,509 8.2% Hispanic 21,663 7.9% Black alone 19,078 7.0% Asian alone 15,329 5.6% Two or more races 772 0.3% Other race alone 87 0.03% American Indian alone 77 0.03% Native Hawaiian and Other
2000 2022
4,681,630 87.3% White alone 300,245 5.6% Black alone 192,921 3.6% Hispanic 87,995 1.6% Asian alone 51,921 1.0% Two or more races 43,980 0.8% American Indian alone 3,637 0.07% Other race alone 1,346 0.03% Native Hawaiian and Other
4,654,031 79.0% White alone 447,022 7.6% Hispanic 345,678 5.9% Black alone 217,532 3.7% Two or more races 172,242 2.9% Asian alone 33,762 0.6% American Indian alone 19,680 0.3% Other race alone 2,592 0.04% Native Hawaiian and Other
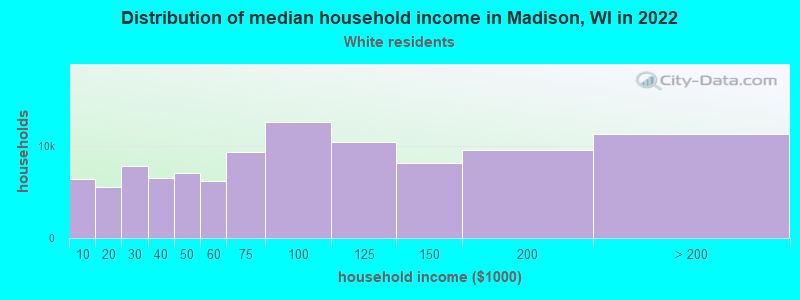
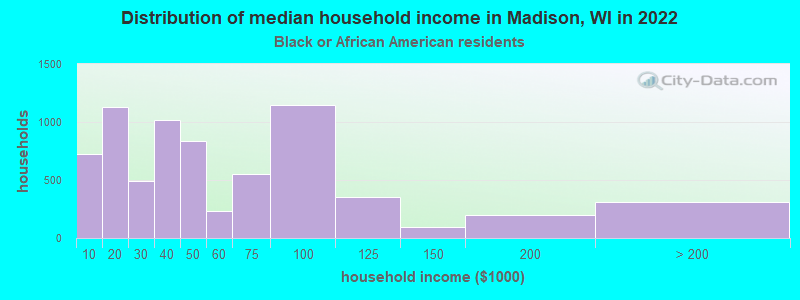
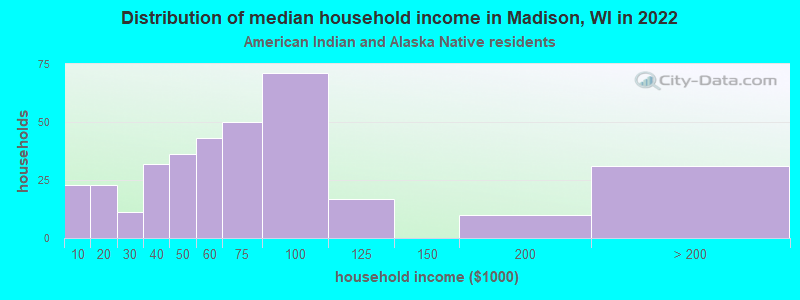
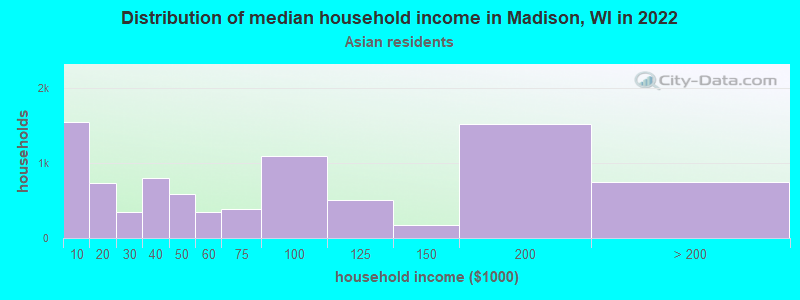
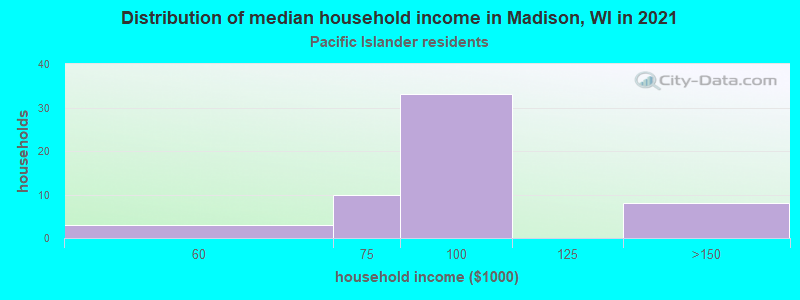
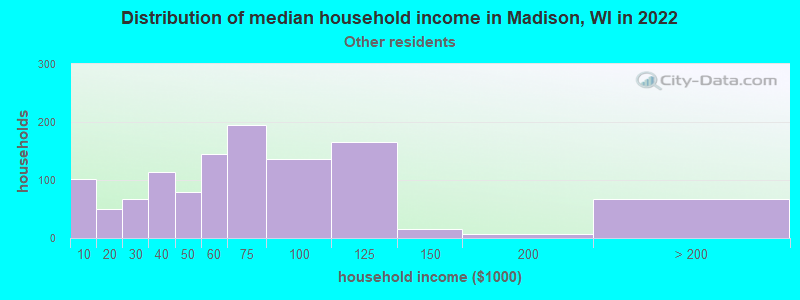
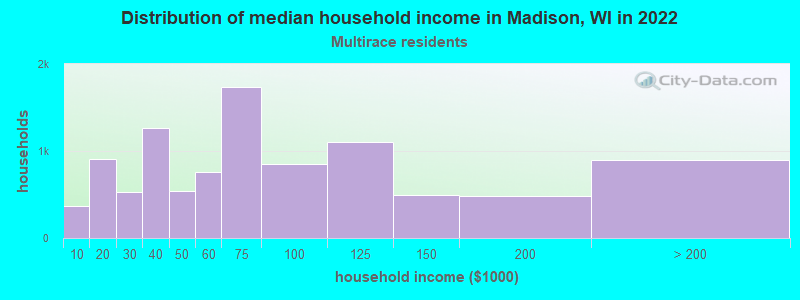
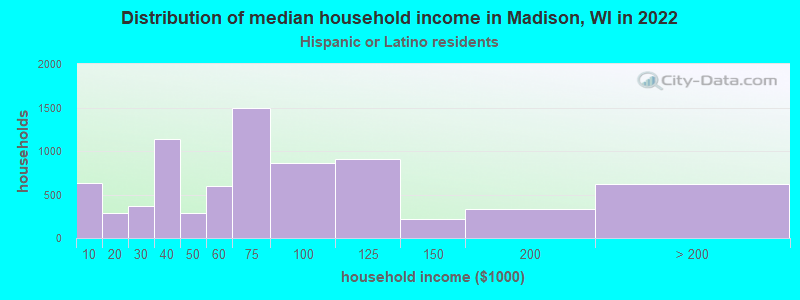
Income and house value in Madison Median household income in 2022 $77,648 White non-Hispanic householders$44,141 Black householders$35,523 American Indian and Alaska Native householders$61,202 Asian householders$70,402 Some other race householders$62,702 Two or more races householders$62,618 Hispanic or Latino race householdersMedian 2022 house value $362,925 White Non-Hispanic householders$345,742 Black or African American householders$357,979 American Indian or Alaska Native householders $375,422 Asian householders$445,716 Native Hawaiian and other Pacific Islander householders$307,732 Some other race householders$333,246 Two or more races householders$332,985 Hispanic or Latino householders
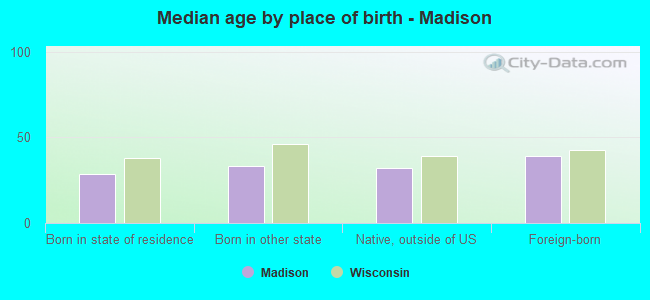
Median age by race in Madison
34.5 Median age for White residents33.8 35.4 24.3 Median age for Black or African American residents24.2 26.1 31.4 Median age for American Indian / Alaska Native residents37.4 32.9 28.4 Median age for Asian residents25.3 30.5 -666,666,666.0 Median age for Native Hawaiian / Pacific Islander residents-666,666,666.0 -666,666,666.0 26.2 Median age for Other race residents27.0 26.2 25.0 Median age for Two or more races residents27.0 22.4 34.7 Median age for White alone residents34.1 35.6 25.9 Median age for Hispanic or Latino residents25.7 26.3
Owner/renter occupied households by race in Madison
House owners and renters - White residents 51,064 50.6% Owner occupied49,879 49.4% Renter occupiedHouse owners and renters - Black or African American residents 1,656 21.1% Owner occupied6,206 78.9% Renter occupiedHouse owners and renters - American Indian / Alaska Native residents 67 19.9% Owner occupied270 80.1% Renter occupiedHouse owners and renters - Asian residents 2,968 33.9% Owner occupied5,797 66.1% Renter occupiedHouse owners and renters - Native Hawaiian / Pacific Islander residents 15 48.2% Owner occupied16 51.8% Renter occupiedHouse owners and renters - Other race residents 248 13.3% Owner occupied1,614 86.7% Renter occupiedHouse owners and renters - Two or more races residents 3,413 34.3% Owner occupied6,523 65.7% Renter occupiedHouse owners and renters - White alone residents 50,218 50.4% Owner occupied49,400 49.6% Renter occupiedHouse owners and renters - Hispanic or Latino residents 2,548 33.0% Owner occupied5,171 67.0% Renter occupied
Language usage in Madison
English speakers - Total 86.6% of residents of Madison speak English at home.
5.2% of residents speak Spanish at home 9,440 69.7% Speak English very well4,095 30.3% Speak English less than very well8.2% of residents speak other language at home 15,570 72.4% Speak English very well5,948 27.6% Speak English less than very well
English speakers - Born in the United States 93.2% of residents of Madison speak English at home.
2.9% of residents speak Spanish at home 2,151 77.4% Speak English very well629 22.6% Speak English less than very well3.9% of residents speak other language at home 3,702 97.5% Speak English very well96 2.5% Speak English less than very well
English speakers - Native, born elsewhere 58.7% of residents of Madison speak English at home.
30.2% of residents speak Spanish at home 644 59.9% Speak English very well431 40.1% Speak English less than very well11.2% of residents speak other language at home 398 100.0% Speak English very well
English speakers - Foreign-born 29.3% of residents of Madison speak English at home.
21.1% of residents speak Spanish at home 3,524 58.6% Speak English very well2,489 41.4% Speak English less than very well49.6% of residents speak other language at home 8,911 62.9% Speak English very well5,261 37.1% Speak English less than very well
White (Caucasian) - Speak only English Native:
97.0% (180,109)Foreign-born:
44.8% (2,510)
White (Caucasian) - Speak another language Native:
3.0% (5,645)Foreign-born:
55.2% (3,094)
Black or African American - Speak only English Native:
97.6% (17,935)Foreign-born:
51.0% (1,056)
Black or African American - Speak another language Native:
2.4% (439)Foreign-born:
49.0% (1,015)
American Indian / Alaska Native - Speak only English Native:
85.4% (544)Foreign-born:
14.7% (18)
American Indian / Alaska Native - Speak another language Native:
14.5% (92)Foreign-born:
85.8% (106)
Asian - Speak only English Native:
56.3% (3,417)Foreign-born:
21.8% (2,733)
Asian - Speak another language Native:
43.7% (2,651)Foreign-born:
78.2% (9,802)
Other race - Speak only English Native:
26.4% (808)Foreign-born:
13.3% (152)
Other race - Speak another language Native:
73.6% (2,256)Foreign-born:
86.7% (988)
Two or more races - Speak only English Native:
80.3% (15,180)Foreign-born:
27.3% (1,920)
Two or more races - Speak another language Native:
19.7% (3,731)Foreign-born:
72.7% (5,101)
White alone - Speak only English Native:
97.6% (177,718)Foreign-born:
45.7% (2,510)
White alone - Speak another language Native:
2.4% (4,409)Foreign-born:
54.3% (2,984)
Hispanic or Latino - Speak only English Native:
51.2% (6,684)Foreign-born:
23.9% (1,901)
Hispanic or Latino - Speak another language Native:
48.8% (6,366)Foreign-born:
76.1% (6,049)
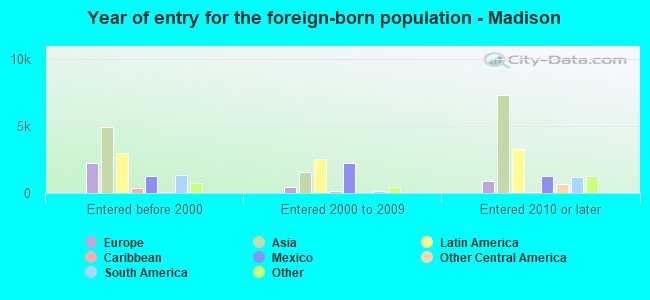
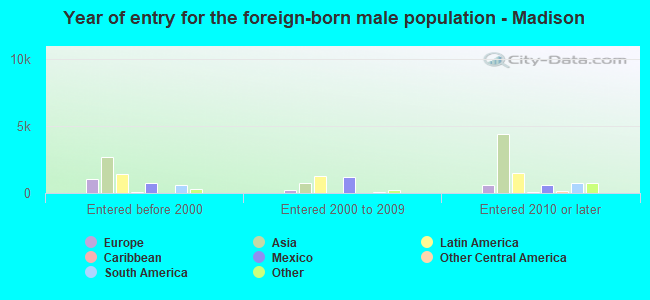
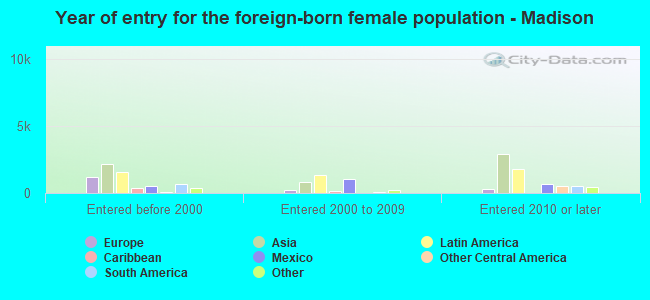
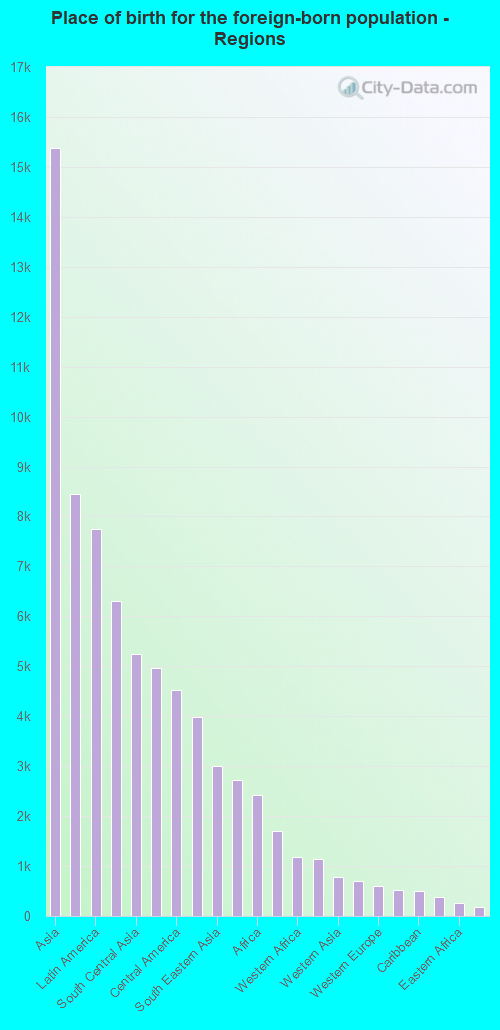
Foreign-born residents in Madison 30,380 residents are foreign born (5.7% Asia , 2.9% Latin America , 1.5% Europe ).
This city:
11.1%Wisconsin:
5.0%
Marital status for residents in Madison Marital status - White (Caucasian) population 15 years and over
Males 52.7% Never married38.8% Now married0.1% Separated1.5% Widowed7.0% DivorcedFemales 45.4% Never married39.1% Now married0.3% Separated4.7% Widowed10.4% DivorcedWomen who gave birth in the past 12 months Now married:
71.8% (1,115)Unmarried:
28.2% (438)
Women who did not give birth in the past 12 months Now married:
31.2% (17,236)Unmarried:
68.8% (37,987)
Marital status - Black or African American population 15 years and over
Males 52.8% Never married28.5% Now married3.5% Separated1.5% Widowed13.8% DivorcedFemales 55.7% Never married30.0% Now married0.0% Separated4.2% Widowed10.2% DivorcedWomen who gave birth in the past 12 months Now married:
21.8% (80)Unmarried:
78.2% (289)
Women who did not give birth in the past 12 months Now married:
24.8% (1,423)Unmarried:
75.2% (4,307)
Marital status - American Indian / Alaska Native population 15 years and over
Males 38.3% Never married26.6% Now married8.7% Separated0.9% Widowed25.4% DivorcedFemales 43.7% Never married15.7% Now married13.2% Separated17.6% Widowed9.7% DivorcedWomen who did not give birth in the past 12 months Now married:
28.4% (80)Unmarried:
71.6% (201)
Marital status - Asian population 15 years and over
Males 56.7% Never married40.4% Now married1.9% Separated0.0% Widowed1.1% DivorcedFemales 47.2% Never married38.7% Now married1.7% Separated1.8% Widowed10.6% DivorcedWomen who gave birth in the past 12 months Now married:
100.0% (150)Unmarried:
0.0% (0)
Women who did not give birth in the past 12 months Now married:
38.8% (2,551)Unmarried:
61.2% (4,030)
Marital status - Native Hawaiian / Pacific Islander population 15 years and over
Males 0.0% Never married100.0% Now married0.0% Separated0.0% Widowed0.0% DivorcedFemales 23.8% Never married76.2% Now married0.0% Separated0.0% Widowed0.0% DivorcedWomen who gave birth in the past 12 months Now married:
0.0% (0)Unmarried:
100.0% (5)
Marital status - Other race population 15 years and over
Males 52.6% Never married28.8% Now married2.3% Separated0.8% Widowed15.6% DivorcedFemales 63.5% Never married29.8% Now married0.5% Separated0.9% Widowed5.4% DivorcedWomen who gave birth in the past 12 months Now married:
100.0% (40)Unmarried:
0.0% (0)
Women who did not give birth in the past 12 months Now married:
24.9% (234)Unmarried:
75.1% (707)
Marital status - Two or more races population 15 years and over
Males 57.4% Never married33.1% Now married1.8% Separated0.0% Widowed7.8% DivorcedFemales 54.3% Never married37.8% Now married4.5% Separated1.2% Widowed2.1% DivorcedWomen who gave birth in the past 12 months Now married:
91.0% (274)Unmarried:
9.0% (27)
Women who did not give birth in the past 12 months Now married:
33.3% (2,913)Unmarried:
66.7% (5,829)
Marital status - White alone, not Hispanic / Latino population 15 years and over
Males 52.1% Never married39.1% Now married0.1% Separated1.5% Widowed7.2% DivorcedFemales 45.3% Never married39.2% Now married0.3% Separated4.8% Widowed10.4% DivorcedWomen who gave birth in the past 12 months Now married:
72.4% (1,115)Unmarried:
27.6% (426)
Women who did not give birth in the past 12 months Now married:
31.1% (16,886)Unmarried:
68.9% (37,421)
Marital status - Hispanic or Latino population 15 years and over
Males 64.1% Never married29.6% Now married1.9% Separated0.0% Widowed4.4% DivorcedFemales 54.8% Never married36.0% Now married5.1% Separated0.7% Widowed3.4% DivorcedWomen who gave birth in the past 12 months Now married:
75.2% (128)Unmarried:
24.8% (42)
Women who did not give birth in the past 12 months Now married:
35.4% (2,203)Unmarried:
64.6% (4,026)
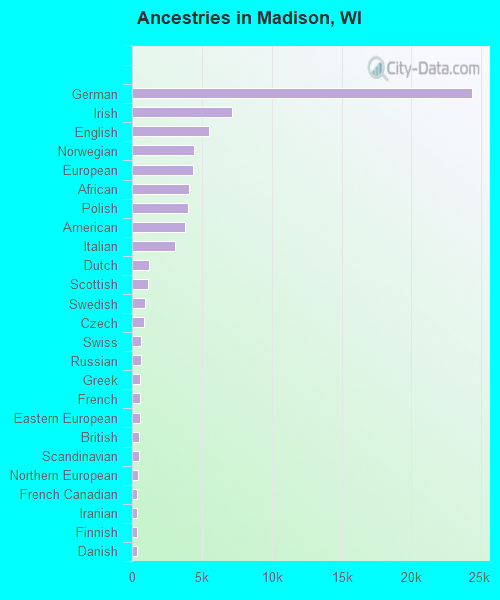
Ancestries in Madison
24,336 19.3% German7,176 5.7% Irish5,514 4.4% English4,455 3.5% Norwegian4,388 3.5% European4,105 3.3% African3,985 3.2% Polish3,808 3.0% American3,047 2.4% Italian1,216 1.0% Dutch1,153 0.9% Scottish911 0.7% Swedish891 0.7% Czech646 0.5% Swiss611 0.5% Russian600 0.5% Greek580 0.5% French549 0.4% Eastern European533 0.4% British513 0.4% Scandinavian445 0.4% Northern European393 0.3% French Canadian382 0.3% Iranian380 0.3% Finnish352 0.3% Danish329 0.3% Brazilian308 0.2% Scotch-Irish301 0.2% Lithuanian268 0.2% Ukrainian260 0.2% Romanian237 0.2% Hungarian220 0.2% Nigerian204 0.2% Welsh196 0.2% Somali175 0.1% Turkish165 0.1% Canadian159 0.1% Jamaican151 0.1% Belgian151 0.1% Liberian151 0.1% Senegalese140 0.1% Austrian135 0.1% Croatian131 0.1% Albanian129 0.1% Egyptian126 0.10% Luxembourger120 0.10% Ethiopian103 0.08% Slavic100 0.08% Arab95 0.08% Portuguese82 0.06% Latvian81 0.06% Slovene78 0.06% Ghanaian58 0.05% Israeli55 0.04% Slovak54 0.04% Czechoslovakian50 0.04% Palestinian46 0.04% West Indian45 0.04% German Russian45 0.04% Serbian41 0.03% Iraqi41 0.03% Afghan39 0.03% Haitian37 0.03% Lebanese36 0.03% Sudanese36 0.03% Jordanian35 0.03% Pennsylvania German34 0.03% Celtic28 0.02% Icelander26 0.02% Bulgarian23 0.02% Macedonian22 0.02% Australian13 0.01% Cajun9 0.01% Yugoslavian9 0.01% Cape Verdean8 0.01% Kenyan8 0.01% Guyanese8 0.01% Zimbabwean
Geographical mobility in Madison Same house 1 year ago 147,356 75.1% White (Caucasian)15,998 74.3% Black or African American624 81.1% American Indian / Alaska Native11,843 62.1% Asian40 70.6% Native Hawaiian / Pacific Islander2,358 53.0% Other race19,823 68.3% Two or more races144,480 75.2% White alone, not Hispanic / Latino15,243 68.5% Hispanic or LatinoMoved within same county 25,668 13.1% White / Caucasian4,187 19.4% Black or African American67 8.7% American Indian / Alaska Native2,414 12.7% Asian10 17.8% Native Hawaiian / Pacific Islander952 21.4% Other race5,446 18.8% Two or more races24,931 13.0% White alone, not Hispanic / Latino3,456 15.5% Hispanic or LatinoMoved within same state 9,208 4.7% White / Caucasian308 1.4% Black or African American7 0.8% American Indian / Alaska Native449 2.4% Asian179 4.0% Other race2,675 9.2% Two or more races9,196 4.8% White alone, not Hispanic / Latino1,467 6.6% Hispanic or LatinoMoved from different state 12,364 6.3% White / Caucasian1,038 4.8% Black or African American22 2.9% American Indian / Alaska Native2,377 12.5% Asian6 11.2% Native Hawaiian / Pacific Islander769 17.3% Other race1,036 3.6% Two or more races12,117 6.3% White alone, not Hispanic / Latino1,680 7.5% Hispanic or LatinoMoved from abroad 1,502 0.8% White46 5.9% American Indian / Alaska Native1,990 10.4% Asian193 4.3% Other race63 0.2% Two or more races1,408 0.7% White alone, not Hispanic / Latino422 1.9% Hispanic or Latino
Children Nativity (place of birth) in Madison
Children under 6 years - Living with two parents Both parents native 6,574 99.0% Native65 1.0% Foreign-bornBoth parents foreign-born 1,472 97.4% Native39 2.6% Foreign-bornOne native, one foreign-born parent 856 100.0% NativeChildren under 6 years - Living with one parent Native parent 3,984 100.0% NativeForeign-born parent 322 100.0% NativeChildren 6 to 17 years - Living with two parents Both parents native 11,742 98.9% Native136 1.1% Foreign-bornBoth parents foreign-born 2,308 81.0% Native542 19.0% Foreign-bornOne native, one foreign-born parent 1,586 100.0% NativeChildren 6 to 17 years - Living with one parent Native parent 8,904 100.0% NativeForeign-born parent 1,456 52.4% Native1,322 47.6% Foreign-born
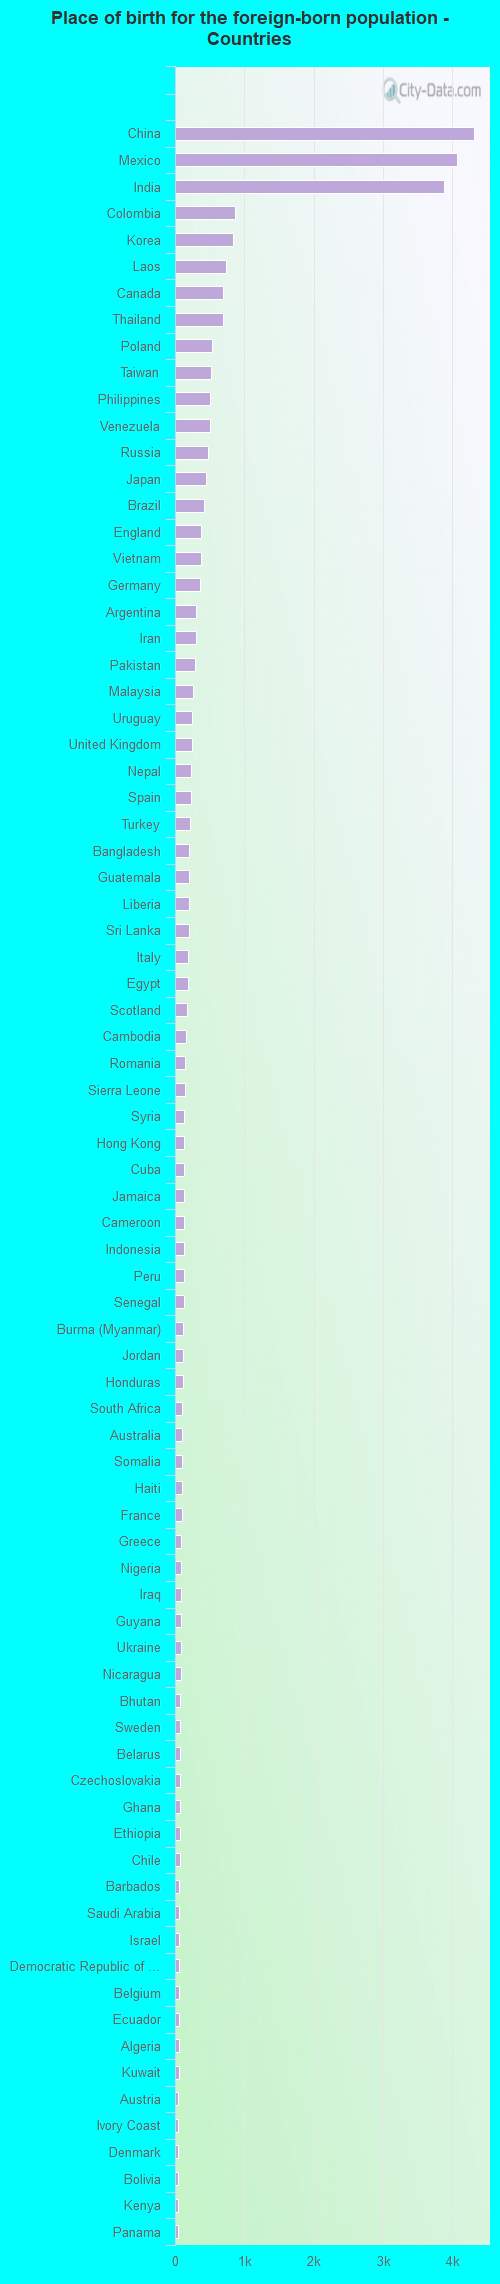
Place of birth for residents in Madison 15,387 Asia8,449 Americas7,745 Latin America6,306 Eastern Asia5,253 South Central Asia4,970 China4,520 Central America3,993 Europe2,996 South Eastern Asia2,730 South America2,426 Africa1,703 Eastern Europe1,190 Western Africa1,148 Northern Europe776 Western Asia703 Northern America610 Western Europe530 Southern Europe494 Caribbean371 Northern Africa269 Eastern Africa187 Middle Africa123 Oceania123 Australia and New Zealand Subregion101 Southern Africa4,311 China4,068 Mexico3,877 India862 Colombia837 Korea731 Laos692 Canada691 Thailand531 Poland525 Taiwan504 Philippines498 Venezuela476 Russia440 Japan422 Brazil370 England370 Vietnam365 Germany307 Argentina304 Iran292 Pakistan266 Malaysia243 Uruguay239 United Kingdom237 Nepal234 Spain214 Turkey208 Bangladesh199 Guatemala199 Liberia198 Sri Lanka190 Italy183 Egypt171 Scotland158 Cambodia141 Romania139 Sierra Leone133 Syria132 Hong Kong131 Cuba130 Jamaica130 Cameroon129 Indonesia127 Peru125 Senegal122 Burma (Myanmar)122 Jordan119 Honduras101 South Africa98 Australia95 Somalia94 Haiti94 France89 Greece83 Nigeria81 Iraq81 Guyana81 Ukraine80 Nicaragua76 Bhutan74 Sweden72 Belarus71 Czechoslovakia68 Ghana66 Ethiopia65 Chile63 Barbados62 Saudi Arabia60 Israel56 Democratic Republic of Congo (Zaire)55 Belgium54 Ecuador51 Algeria51 Kuwait50 Austria49 Ivory Coast49 Denmark48 Bolivia46 Kenya45 Panama39 Sudan38 Ireland38 Bahamas37 Bulgaria34 Dominican Republic32 Afghanistan31 Moldova29 Zimbabwe29 Hungary28 Latvia27 Switzerland24 New Zealand23 Bosnia and Herzegovina20 Singapore18 Morocco15 Netherlands15 Portugal14 United Arab Emirates14 Azerbaijan9 Lebanon9 Togo8 Albania7 Eritrea7 Lithuania5 Tanzania5 El Salvador4 Kazakhstan
Grandparents responsible for own grandchildren in Madison
Grandparents (30 to 59 years) White / Caucasian 105 43.9% Responsible for grandchildren134 56.1% Not responsible for grandchildrenBlack or African American 64 35.4% Responsible for grandchildren116 64.6% Not responsible for grandchildrenAmerican Indian / Alaska Native 7 100.0% Responsible for grandchildrenAsian 7 8.0% Responsible for grandchildren75 92.0% Not responsible for grandchildrenTwo or more races 215 45.6% Responsible for grandchildren257 54.4% Not responsible for grandchildrenWhite alone, not Hispanic / Latino 101 49.0% Responsible for grandchildren105 51.0% Not responsible for grandchildrenHispanic or Latino 124 40.0% Responsible for grandchildren187 60.0% Not responsible for grandchildrenGrandparents (60 years and over) White / Caucasian 224 36.0% Responsible for grandchildren398 64.0% Not responsible for grandchildrenBlack or African American 25 28.0% Responsible for grandchildren64 72.0% Not responsible for grandchildrenAsian 28 20.8% Responsible for grandchildren105 79.2% Not responsible for grandchildrenTwo or more races 48 100.0% Not responsible for grandchildrenWhite alone, not Hispanic / Latino 231 38.1% Responsible for grandchildren375 61.9% Not responsible for grandchildrenHispanic or Latino 82 100.0% Not responsible for grandchildren
Zip codes: 53562 , 53590 , 53597 , 53703 , 53704 , 53705 , 53706 , 53714 , 53715 , 53716 , 53717 , 53726 , 53792.