Races in Midland, Washington (WA) Detailed Stats
Data:
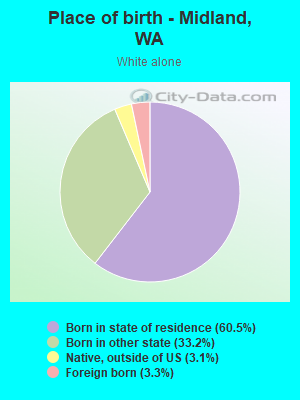
Races - White alone (%)
Races - White alone (% change since 2000)
Races - Black alone (%)
Races - Black alone (% change since 2000)
Races - American Indian alone (%)
Races - American Indian alone (% change since 2000)
Races - Asian alone (%)
Races - Asian alone (% change since 2000)
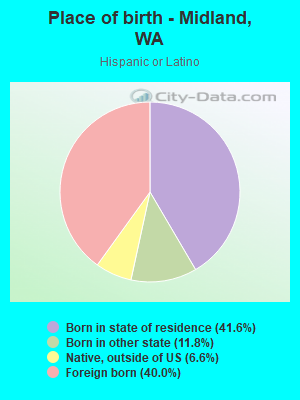
Races - Hispanic (%)
Races - Hispanic (% change since 2000)
Races - Native Hawaiian and Other Pacific Islander alone (%)
Races - Native Hawaiian and Other Pacific Islander alone (% change since 2000)
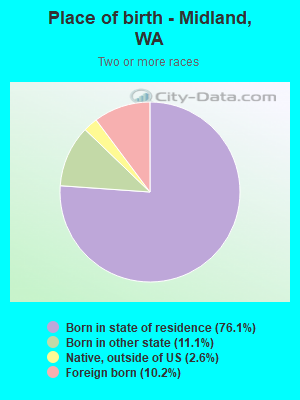
Races - Two or more races(%)
Races - Two or more races(% change since 2000)
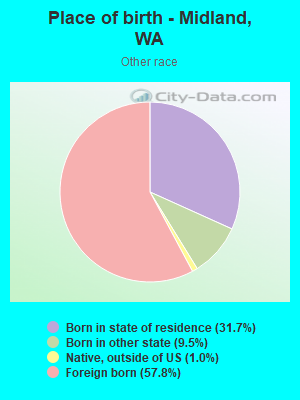
Races - Other race alone (%)
Races - Other race alone (% change since 2000)
Racial diversity
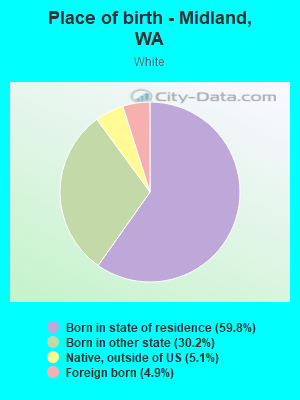
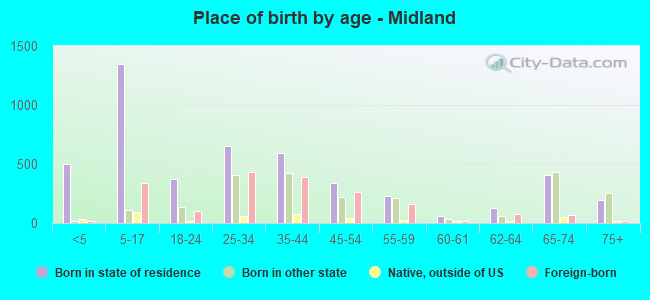
Place of birth - Born in state of residence (%)
Place of birth - Born in state of residence (%) - White
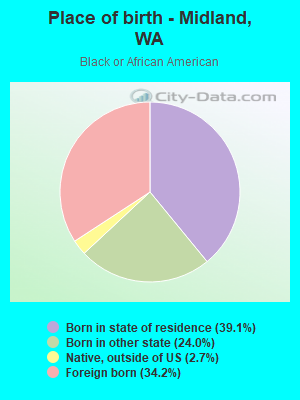
Place of birth - Born in state of residence (%) - Black or African American
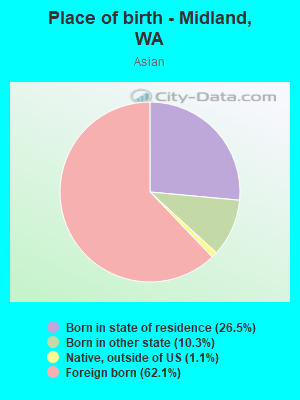
Place of birth - Born in state of residence (%) - Asian
Place of birth - Born in state of residence (%) - Hispanic or Latino
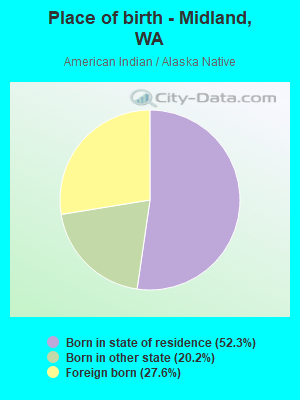
Place of birth - Born in state of residence (%) - American Indian and Alaska Native
Place of birth - Born in state of residence (%) - Multirace
Place of birth - Born in state of residence (%) - Other Race
Place of birth - Born in other state (%)
Place of birth - Born in other state (%) - White
Place of birth - Born in other state (%) - Black or African American
Place of birth - Born in other state (%) - Asian
Place of birth - Born in other state (%) - Hispanic or Latino
Place of birth - Born in other state (%) - American Indian and Alaska Native
Place of birth - Born in other state (%) - Multirace
Place of birth - Born in other state (%) - Other Race
Place of birth - Native, outside of US (%)
Place of birth - Native, outside of US (%) - White
Place of birth - Native, outside of US (%) - Black or African American
Place of birth - Native, outside of US (%) - Asian
Place of birth - Native, outside of US (%) - Hispanic or Latino
Place of birth - Native, outside of US (%) - American Indian and Alaska Native
Place of birth - Native, outside of US (%) - Multirace
Place of birth - Native, outside of US (%) - Other Race
Place of birth - Foreign born (%)
Place of birth - Foreign born (%) - White
Place of birth - Foreign born (%) - Black or African American
Place of birth - Foreign born (%) - Asian
Place of birth - Foreign born (%) - Hispanic or Latino
Place of birth - Foreign born (%) - American Indian and Alaska Native
Place of birth - Foreign born (%) - Multirace
Place of birth - Foreign born (%) - Other Race
Residents speaking English at home (%)
Residents speaking English at home - Born in the United States (%)
Residents speaking English at home - Native, born elsewhere (%)
Residents speaking English at home - Foreign born (%)
Residents speaking Spanish at home (%)
Residents speaking Spanish at home - Born in the United States (%)
Residents speaking Spanish at home - Native, born elsewhere (%)
Residents speaking Spanish at home - Foreign born (%)
Residents speaking other language at home (%)
Residents speaking other language at home - Born in the United States (%)
Residents speaking other language at home - Native, born elsewhere (%)
Residents speaking other language at home - Foreign born (%)
Marital status - Never married (%)
Marital status - Now married (%)
Marital status - Separated (%)
Marital status - Widowed (%)
Marital status - Divorced (%)
Ancestries Reported - Arab (%)
Ancestries Reported - Czech (%)
Ancestries Reported - Danish (%)
Ancestries Reported - Dutch (%)
Ancestries Reported - English (%)
Ancestries Reported - French (%)
Ancestries Reported - French Canadian (%)
Ancestries Reported - German (%)
Ancestries Reported - Greek (%)
Ancestries Reported - Hungarian (%)
Ancestries Reported - Irish (%)
Ancestries Reported - Italian (%)
Ancestries Reported - Lithuanian (%)
Ancestries Reported - Norwegian (%)
Ancestries Reported - Polish (%)
Ancestries Reported - Portuguese (%)
Ancestries Reported - Russian (%)
Ancestries Reported - Scotch-Irish (%)
Ancestries Reported - Scottish (%)
Ancestries Reported - Slovak (%)
Ancestries Reported - Subsaharan African (%)
Ancestries Reported - Swedish (%)
Ancestries Reported - Swiss (%)
Ancestries Reported - Ukrainian (%)
Ancestries Reported - United States (%)
Ancestries Reported - Welsh (%)
Ancestries Reported - West Indian (%)
Ancestries Reported - Other (%)
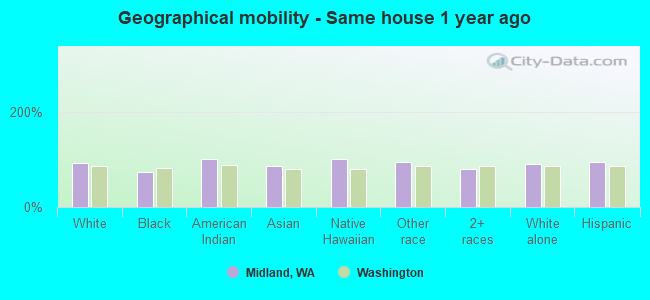
Geographical mobility - Same house 1 year ago (%)
Geographical mobility - Same house 1 year ago (%) - White
Geographical mobility - Same house 1 year ago (%) - Black or African American
Geographical mobility - Same house 1 year ago (%) - Asian
Geographical mobility - Same house 1 year ago (%) - Hispanic or Latino
Geographical mobility - Same house 1 year ago (%) - American Indian and Alaska Native
Geographical mobility - Same house 1 year ago (%) - Multirace
Geographical mobility - Same house 1 year ago (%) - Other Race
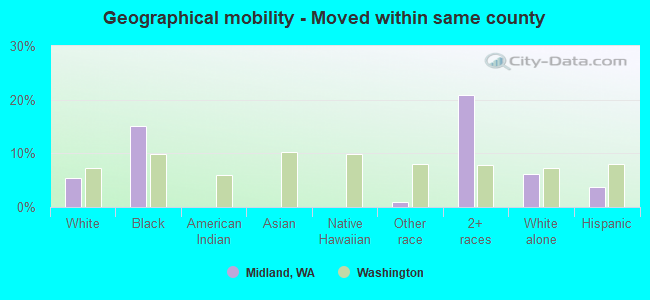
Geographical mobility - Moved within same county (%)
Geographical mobility - Moved within same county (%) - White
Geographical mobility - Moved within same county (%) - Black or African American
Geographical mobility - Moved within same county (%) - Asian
Geographical mobility - Moved within same county (%) - Hispanic or Latino
Geographical mobility - Moved within same county (%) - American Indian and Alaska Native
Geographical mobility - Moved within same county (%) - Multirace
Geographical mobility - Moved within same county (%) - Other Race
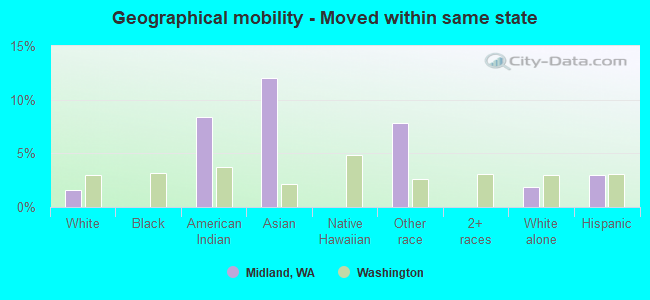
Geographical mobility - Moved from different county within same state (%)
Geographical mobility - Moved from different county within same state (%) - White
Geographical mobility - Moved from different county within same state (%) - Black or African American
Geographical mobility - Moved from different county within same state (%) - Asian
Geographical mobility - Moved from different county within same state (%) - Hispanic or Latino
Geographical mobility - Moved from different county within same state (%) - American Indian and Alaska Native
Geographical mobility - Moved from different county within same state (%) - Multirace
Geographical mobility - Moved from different county within same state (%) - Other Race
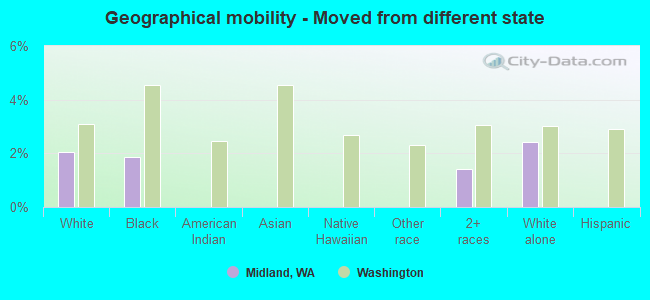
Geographical mobility - Moved from different state (%)
Geographical mobility - Moved from different state (%) - White
Geographical mobility - Moved from different state (%) - Black or African American
Geographical mobility - Moved from different state (%) - Asian
Geographical mobility - Moved from different state (%) - Hispanic or Latino
Geographical mobility - Moved from different state (%) - American Indian and Alaska Native
Geographical mobility - Moved from different state (%) - Multirace
Geographical mobility - Moved from different state (%) - Other Race
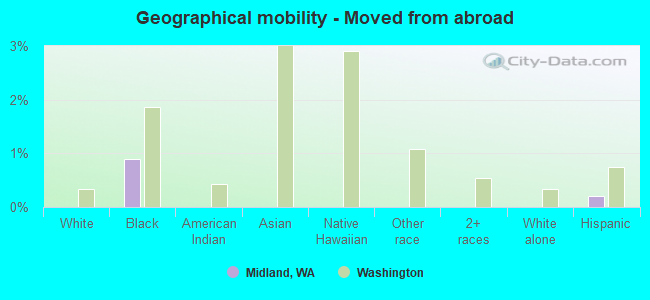
Geographical mobility - Moved from abroad (%)
Geographical mobility - Moved from abroad (%) - White
Geographical mobility - Moved from abroad (%) - Black or African American
Geographical mobility - Moved from abroad (%) - Asian
Geographical mobility - Moved from abroad (%) - Hispanic or Latino
Geographical mobility - Moved from abroad (%) - American Indian and Alaska Native
Geographical mobility - Moved from abroad (%) - Multirace
Geographical mobility - Moved from abroad (%) - Other Race
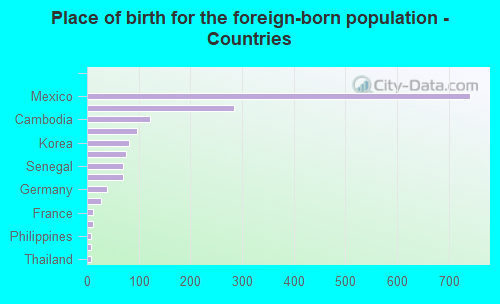
Place of birth for the foreign-born population - Ireland (%)
Place of birth for the foreign-born population - Denmark (%)
Place of birth for the foreign-born population - Norway (%)
Place of birth for the foreign-born population - Sweden (%)
Place of birth for the foreign-born population - United Kingdom (%)
Place of birth for the foreign-born population - England (%)
Place of birth for the foreign-born population - Scotland (%)
Place of birth for the foreign-born population - Other Northern Europe (%)
Place of birth for the foreign-born population - Austria (%)
Place of birth for the foreign-born population - Belgium (%)
Place of birth for the foreign-born population - France (%)
Place of birth for the foreign-born population - Germany (%)
Place of birth for the foreign-born population - Netherlands (%)
Place of birth for the foreign-born population - Switzerland (%)
Place of birth for the foreign-born population - Other Western Europe (%)
Place of birth for the foreign-born population - Greece (%)
Place of birth for the foreign-born population - Italy (%)
Place of birth for the foreign-born population - Portugal (%)
Place of birth for the foreign-born population - Spain (%)
Place of birth for the foreign-born population - Other Southern Europe (%)
Place of birth for the foreign-born population - Albania (%)
Place of birth for the foreign-born population - Belarus (%)
Place of birth for the foreign-born population - Bosnia and Herzegovina (%)
Place of birth for the foreign-born population - Bulgaria (%)
Place of birth for the foreign-born population - Croatia (%)
Place of birth for the foreign-born population - Czechoslovakia (%)
Place of birth for the foreign-born population - Hungary (%)
Place of birth for the foreign-born population - Latvia (%)
Place of birth for the foreign-born population - Lithuania (%)
Place of birth for the foreign-born population - North Macedonia (Macedonia) (%)
Place of birth for the foreign-born population - Moldova (%)
Place of birth for the foreign-born population - Poland (%)
Place of birth for the foreign-born population - Romania (%)
Place of birth for the foreign-born population - Russia (%)
Place of birth for the foreign-born population - Serbia (%)
Place of birth for the foreign-born population - Ukraine (%)
Place of birth for the foreign-born population - Other Eastern Europe (%)
Place of birth for the foreign-born population - China (%)
Place of birth for the foreign-born population - Hong Kong (%)
Place of birth for the foreign-born population - Taiwan (%)
Place of birth for the foreign-born population - Japan (%)
Place of birth for the foreign-born population - Korea (%)
Place of birth for the foreign-born population - Other Eastern Asia (%)
Place of birth for the foreign-born population - Afghanistan (%)
Place of birth for the foreign-born population - Bangladesh (%)
Place of birth for the foreign-born population - India (%)
Place of birth for the foreign-born population - Iran (%)
Place of birth for the foreign-born population - Kazakhstan (%)
Place of birth for the foreign-born population - Nepal (%)
Place of birth for the foreign-born population - Pakistan (%)
Place of birth for the foreign-born population - Sri Lanka (%)
Place of birth for the foreign-born population - Uzbekistan (%)
Place of birth for the foreign-born population - Other South Central Asia (%)
Place of birth for the foreign-born population - Burma (%)
Place of birth for the foreign-born population - Cambodia (%)
Place of birth for the foreign-born population - Indonesia (%)
Place of birth for the foreign-born population - Laos (%)
Place of birth for the foreign-born population - Malaysia (%)
Place of birth for the foreign-born population - Philippines (%)
Place of birth for the foreign-born population - Singapore (%)
Place of birth for the foreign-born population - Thailand (%)
Place of birth for the foreign-born population - Vietnam (%)
Place of birth for the foreign-born population - Other South Eastern Asia (%)
Place of birth for the foreign-born population - Armenia (%)
Place of birth for the foreign-born population - Iraq (%)
Place of birth for the foreign-born population - Israel (%)
Place of birth for the foreign-born population - Jordan (%)
Place of birth for the foreign-born population - Kuwait (%)
Place of birth for the foreign-born population - Lebanon (%)
Place of birth for the foreign-born population - Saudi Arabia (%)
Place of birth for the foreign-born population - Syria (%)
Place of birth for the foreign-born population - Turkey (%)
Place of birth for the foreign-born population - Yemen (%)
Place of birth for the foreign-born population - Other Western Asia (%)
Place of birth for the foreign-born population - Eritrea (%)
Place of birth for the foreign-born population - Ethiopia (%)
Place of birth for the foreign-born population - Kenya (%)
Place of birth for the foreign-born population - Somalia (%)
Place of birth for the foreign-born population - Uganda (%)
Place of birth for the foreign-born population - Zimbabwe (%)
Place of birth for the foreign-born population - Other Eastern Africa (%)
Place of birth for the foreign-born population - Cameroon (%)
Place of birth for the foreign-born population - Congo (%)
Place of birth for the foreign-born population - Democratic Republic of Congo (Zaire) (%)
Place of birth for the foreign-born population - Other Middle Africa (%)
Place of birth for the foreign-born population - Egypt (%)
Place of birth for the foreign-born population - Morocco (%)
Place of birth for the foreign-born population - Sudan (%)
Place of birth for the foreign-born population - Other Northern Africa (%)
Place of birth for the foreign-born population - South Africa (%)
Place of birth for the foreign-born population - Other Southern Africa (%)
Place of birth for the foreign-born population - Cabo Verde (%)
Place of birth for the foreign-born population - Ghana (%)
Place of birth for the foreign-born population - Liberia (%)
Place of birth for the foreign-born population - Nigeria (%)
Place of birth for the foreign-born population - Senegal (%)
Place of birth for the foreign-born population - Sierra Leone (%)
Place of birth for the foreign-born population - Other Western Africa (%)
Place of birth for the foreign-born population - Australia (%)
Place of birth for the foreign-born population - New Zealand (%)
Place of birth for the foreign-born population - Fiji (%)
Place of birth for the foreign-born population - Micronesia (%)
Place of birth for the foreign-born population - Bahamas (%)
Place of birth for the foreign-born population - Barbados (%)
Place of birth for the foreign-born population - Cuba (%)
Place of birth for the foreign-born population - Dominica (%)
Place of birth for the foreign-born population - Dominican Republic (%)
Place of birth for the foreign-born population - Grenada (%)
Place of birth for the foreign-born population - Haiti (%)
Place of birth for the foreign-born population - Jamaica (%)
Place of birth for the foreign-born population - St. Vincent and the Grenadines (%)
Place of birth for the foreign-born population - Trinidad and Tobago (%)
Place of birth for the foreign-born population - West Indies (%)
Place of birth for the foreign-born population - Other Caribbean (%)
Place of birth for the foreign-born population - Belize (%)
Place of birth for the foreign-born population - Costa Rica (%)
Place of birth for the foreign-born population - El Salvador (%)
Place of birth for the foreign-born population - Guatemala (%)
Place of birth for the foreign-born population - Honduras (%)
Place of birth for the foreign-born population - Mexico (%)
Place of birth for the foreign-born population - Nicaragua (%)
Place of birth for the foreign-born population - Panama (%)
Place of birth for the foreign-born population - Other Central America (%)
Place of birth for the foreign-born population - Argentina (%)
Place of birth for the foreign-born population - Bolivia (%)
Place of birth for the foreign-born population - Brazil (%)
Place of birth for the foreign-born population - Chile (%)
Place of birth for the foreign-born population - Colombia (%)
Place of birth for the foreign-born population - Ecuador (%)
Place of birth for the foreign-born population - Guyana (%)
Place of birth for the foreign-born population - Peru (%)
Place of birth for the foreign-born population - Uruguay (%)
Place of birth for the foreign-born population - Venezuela (%)
Place of birth for the foreign-born population - Other South America (%)
Place of birth for the foreign-born population - Canada (%)
Place of birth for the foreign-born population - Other Northern America (%)
Place of birth for the foreign-born population - Other (%)
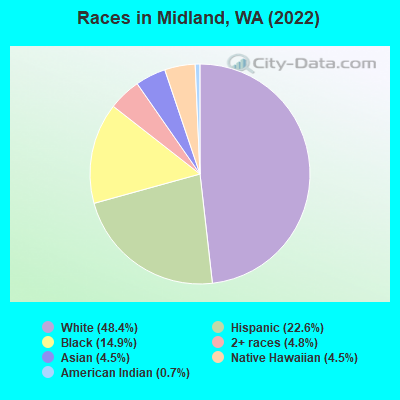
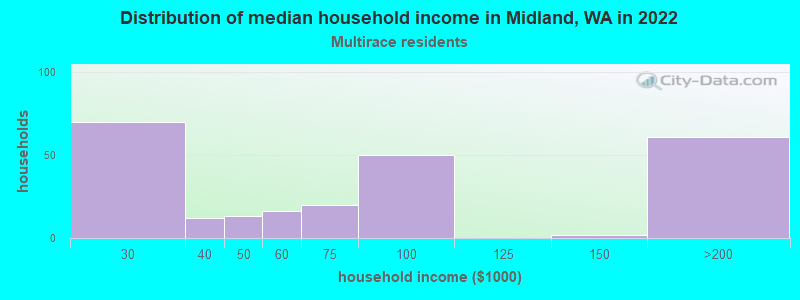
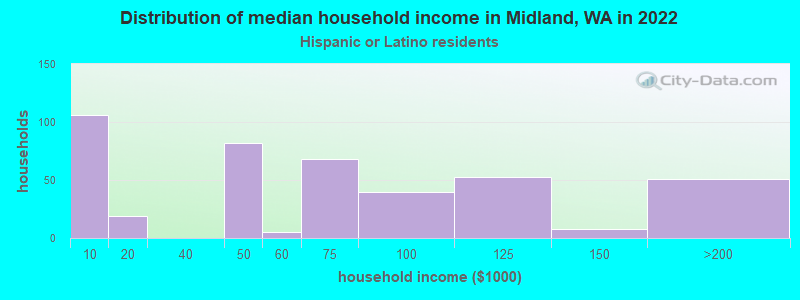
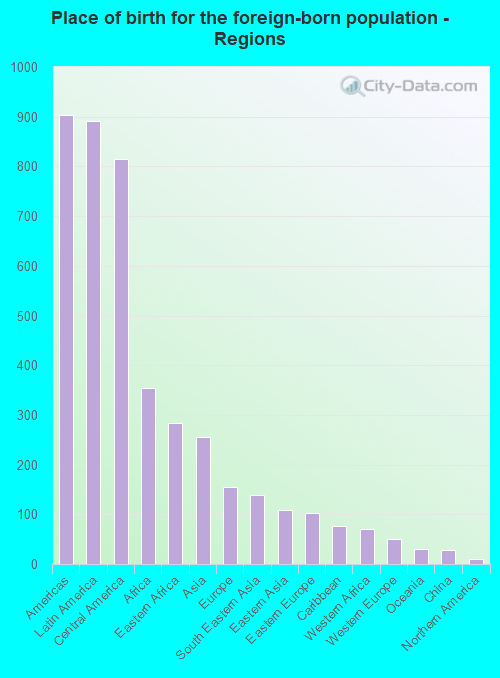
According to 2022 data, the most numerous races in Midland, WA are White alone (4,434 residents), Hispanic (2,067 residents), and Asian alone (416 residents). 72.5% of Midland residents speak English at home. 18.6% of Midland, WA residents are foreign-born (9.5% born in Latin America, 3.8% born in Africa, 2.7% born in Asia), which is 19.2% greater than the foreign-born rate of 15.0% across the entire state of Washington.
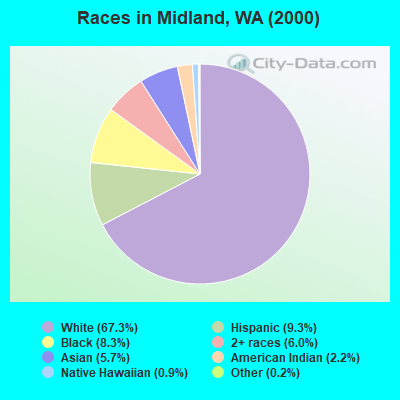
Race distribution in Midland
2000 2022
4,652,490 78.9% White alone 441,509 7.5% Hispanic 319,401 5.4% Asian alone 184,631 3.1% Black alone 175,926 3.0% Two or more races 85,396 1.4% American Indian alone 22,779 0.4% Native Hawaiian and Other 11,989 0.2% Other race alone
4,941,456 63.5% White alone 1,093,313 14.0% Hispanic 755,832 9.7% Asian alone 523,448 6.7% Two or more races 299,537 3.8% Black alone 69,024 0.9% American Indian alone 52,231 0.7% Native Hawaiian and Other 50,945 0.7% Other race alone
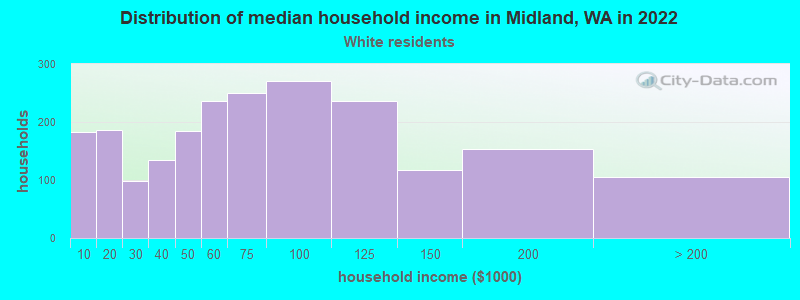
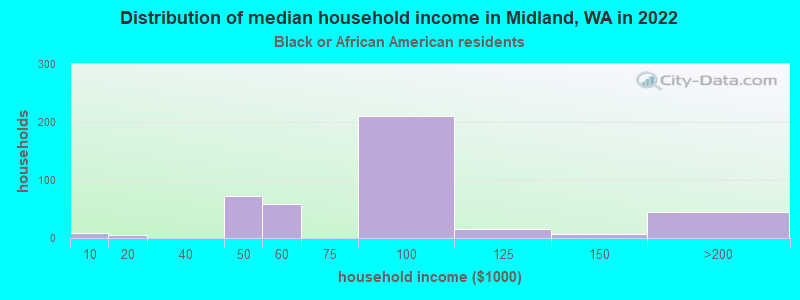
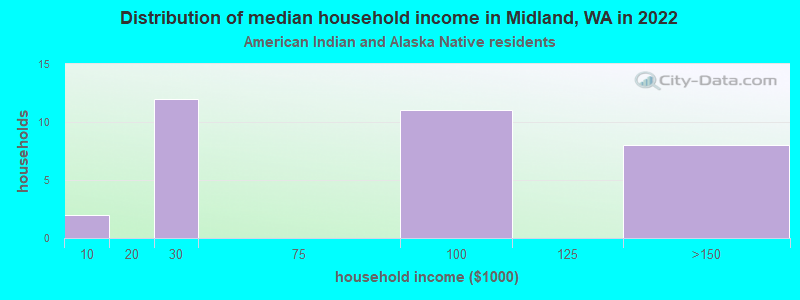
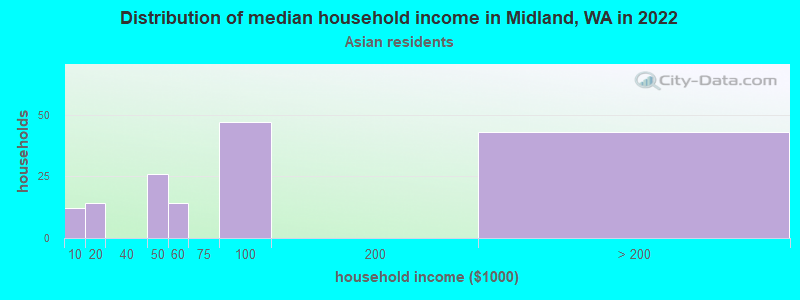
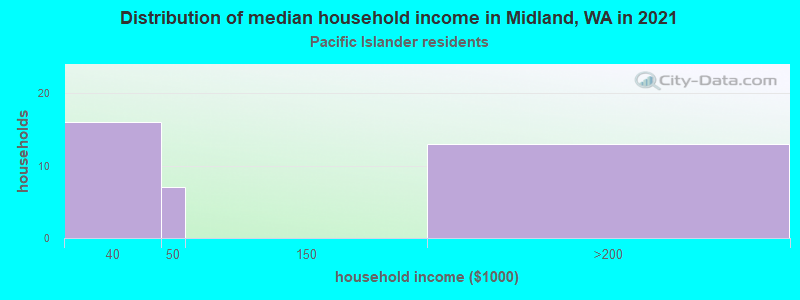
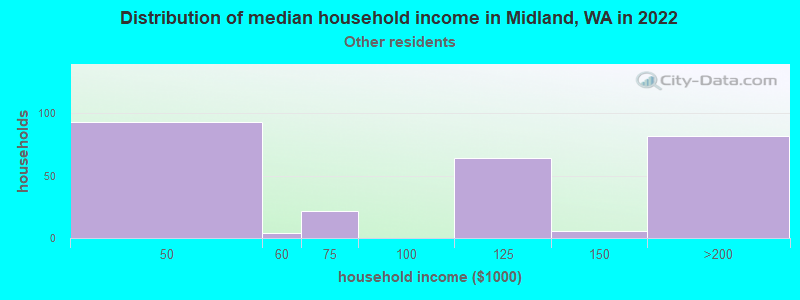
Income and house value in Midland Median household income in 2022 $69,024 White non-Hispanic householders$82,099 Black householders$79,178 Asian householders$100,149 Native Hawaiian and other Pacific Islander householders$84,356 Two or more races householders$66,565 Hispanic or Latino race householdersMedian 2022 house value $470,612 White Non-Hispanic householders$272,766 Black or African American householders $467,703 Asian householders$409,149 Native Hawaiian and other Pacific Islander householders$500,071 Some other race householders$367,325 Two or more races householders$465,157 Hispanic or Latino householders
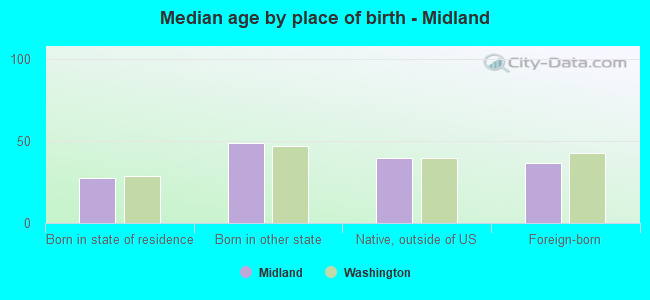
Median age by race in Midland
41.0 Median age for White residents36.2 43.4 28.4 Median age for Black or African American residents29.8 28.5 46.8 Median age for American Indian / Alaska Native residents51.9 47.1 38.2 Median age for Asian residents39.7 37.5 16.7 Median age for Native Hawaiian / Pacific Islander residents17.3 15.8 29.0 Median age for Other race residents31.8 24.6 37.7 Median age for Two or more races residents30.4 39.6 45.6 Median age for White alone residents42.8 49.6 24.1 Median age for Hispanic or Latino residents27.1 22.9
Owner/renter occupied households by race in Midland
House owners and renters - White residents 1,326 61.9% Owner occupied818 38.1% Renter occupiedHouse owners and renters - Black or African American residents 214 51.4% Owner occupied202 48.6% Renter occupiedHouse owners and renters - American Indian / Alaska Native residents 23 90.2% Owner occupied2 9.8% Renter occupiedHouse owners and renters - Asian residents 109 79.5% Owner occupied28 20.5% Renter occupiedHouse owners and renters - Native Hawaiian / Pacific Islander residents 58 58.5% Owner occupied41 41.5% Renter occupiedHouse owners and renters - Other race residents 84 37.5% Owner occupied140 62.5% Renter occupiedHouse owners and renters - Two or more races residents 181 65.6% Owner occupied95 34.4% Renter occupiedHouse owners and renters - White alone residents 1,290 65.2% Owner occupied688 34.8% Renter occupiedHouse owners and renters - Hispanic or Latino residents 147 32.5% Owner occupied306 67.5% Renter occupied
Language usage in Midland
English speakers - Total 72.5% of residents of Midland speak English at home.
14.5% of residents speak Spanish at home 593 47.4% Speak English very well657 52.6% Speak English less than very well12.7% of residents speak other language at home 580 52.9% Speak English very well516 47.1% Speak English less than very well
English speakers - Born in the United States 88.9% of residents of Midland speak English at home.
10.6% of residents speak Spanish at home 223 94.1% Speak English very well14 5.9% Speak English less than very well0.4% of residents speak other language at home 10 100.0% Speak English very well
English speakers - Native, born elsewhere 77.8% of residents of Midland speak English at home.
5.8% of residents speak Spanish at home 21 100.0% Speak English less than very well14.5% of residents speak other language at home 11 20.8% Speak English very well42 79.2% Speak English less than very well
English speakers - Foreign-born 10.8% of residents of Midland speak English at home.
42.3% of residents speak Spanish at home 235 31.7% Speak English very well507 68.3% Speak English less than very well45.2% of residents speak other language at home 369 46.6% Speak English very well423 53.4% Speak English less than very well
White (Caucasian) - Speak only English Native:
90.7% (4,242)Foreign-born:
18.7% (48)
White (Caucasian) - Speak another language Native:
7.1% (332)Foreign-born:
83.4% (213)
Black or African American - Speak only English Native:
99.6% (857)Foreign-born:
9.1% (46)
American Indian / Alaska Native - Speak only English Native:
92.8% (45)Foreign-born:
59.1% (11)
Asian - Speak only English Native:
61.9% (94)Foreign-born:
19.7% (50)
Asian - Speak another language Native:
37.8% (57)Foreign-born:
80.0% (202)
Native Hawaiian / Pacific Islander - Speak another language Native:
47.1% (198)Foreign-born:
91.9% (22)
Other race - Speak another language Native:
68.0% (149)Foreign-born:
99.0% (474)
Two or more races - Speak only English Native:
97.9% (493)Foreign-born:
23.0% (13)
White alone - Speak only English Native:
96.3% (3,961)Foreign-born:
9.7% (14)
White alone - Speak another language Native:
3.3% (138)Foreign-born:
98.9% (144)
Hispanic or Latino - Speak only English Native:
48.2% (456)Foreign-born:
4.3% (36)
Hispanic or Latino - Speak another language Native:
50.0% (472)Foreign-born:
96.5% (800)
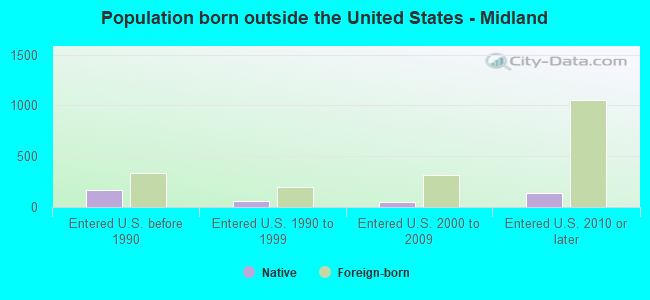
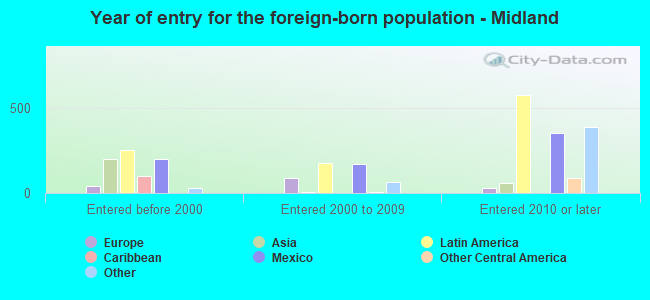
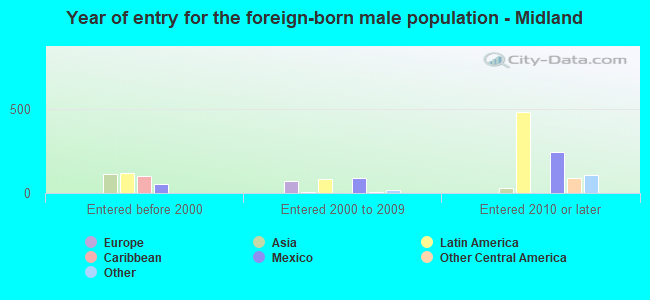
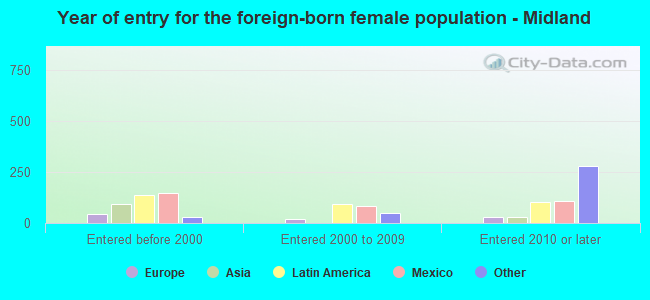
Foreign-born residents in Midland 1,701 residents are foreign born (9.5% Latin America , 3.8% Africa , 2.7% Asia ).
This city:
18.6%Washington:
14.9%
Marital status for residents in Midland Marital status - White (Caucasian) population 15 years and over
Males 37.6% Never married44.5% Now married1.7% Separated4.9% Widowed11.3% DivorcedFemales 26.8% Never married39.0% Now married4.0% Separated10.7% Widowed19.4% DivorcedWomen who gave birth in the past 12 months Now married:
29.8% (23)Unmarried:
70.2% (55)
Women who did not give birth in the past 12 months Now married:
43.0% (462)Unmarried:
57.0% (612)
Marital status - Black or African American population 15 years and over
Males 60.7% Never married39.3% Now married0.0% Separated0.0% Widowed0.0% DivorcedFemales 31.0% Never married48.3% Now married0.0% Separated1.6% Widowed19.1% DivorcedWomen who gave birth in the past 12 months Now married:
19.2% (10)Unmarried:
80.8% (41)
Women who did not give birth in the past 12 months Now married:
52.8% (178)Unmarried:
47.2% (159)
Marital status - American Indian / Alaska Native population 15 years and over
Males 40.0% Never married60.0% Now married0.0% Separated0.0% Widowed0.0% DivorcedFemales 0.0% Never married77.4% Now married16.1% Separated0.0% Widowed6.5% DivorcedWomen who did not give birth in the past 12 months Now married:
100.0% (11)Unmarried:
0.0% (0)
Marital status - Asian population 15 years and over
Males 46.0% Never married39.9% Now married3.5% Separated0.0% Widowed10.6% DivorcedFemales 32.7% Never married52.0% Now married15.2% Separated0.0% Widowed0.0% DivorcedWomen who did not give birth in the past 12 months Now married:
48.6% (55)Unmarried:
51.4% (58)
Marital status - Native Hawaiian / Pacific Islander population 15 years and over
Males 45.8% Never married54.2% Now married0.0% Separated0.0% Widowed0.0% DivorcedFemales 48.9% Never married51.1% Now married0.0% Separated0.0% Widowed0.0% DivorcedWomen who did not give birth in the past 12 months Now married:
26.9% (28)Unmarried:
73.1% (77)
Marital status - Other race population 15 years and over
Males 31.8% Never married51.3% Now married11.9% Separated0.0% Widowed4.9% DivorcedFemales 36.7% Never married63.3% Now married0.0% Separated0.0% Widowed0.0% DivorcedWomen who gave birth in the past 12 months Now married:
56.6% (70)Unmarried:
43.4% (53)
Women who did not give birth in the past 12 months Now married:
28.2% (12)Unmarried:
71.8% (30)
Marital status - Two or more races population 15 years and over
Males 61.3% Never married38.7% Now married0.0% Separated0.0% Widowed0.0% DivorcedFemales 45.2% Never married21.6% Now married0.0% Separated14.9% Widowed18.3% DivorcedWomen who did not give birth in the past 12 months Now married:
20.3% (32)Unmarried:
79.7% (124)
Marital status - White alone, not Hispanic / Latino population 15 years and over
Males 38.7% Never married42.0% Now married1.8% Separated5.3% Widowed12.2% DivorcedFemales 25.1% Never married38.6% Now married3.2% Separated12.2% Widowed21.0% DivorcedWomen who gave birth in the past 12 months Now married:
38.5% (24)Unmarried:
61.5% (39)
Women who did not give birth in the past 12 months Now married:
38.8% (341)Unmarried:
61.2% (537)
Marital status - Hispanic or Latino population 15 years and over
Males 29.7% Never married58.4% Now married8.4% Separated0.0% Widowed3.5% DivorcedFemales 41.1% Never married49.4% Now married5.6% Separated0.0% Widowed3.9% DivorcedWomen who gave birth in the past 12 months Now married:
48.5% (69)Unmarried:
51.5% (74)
Women who did not give birth in the past 12 months Now married:
49.8% (162)Unmarried:
50.2% (163)
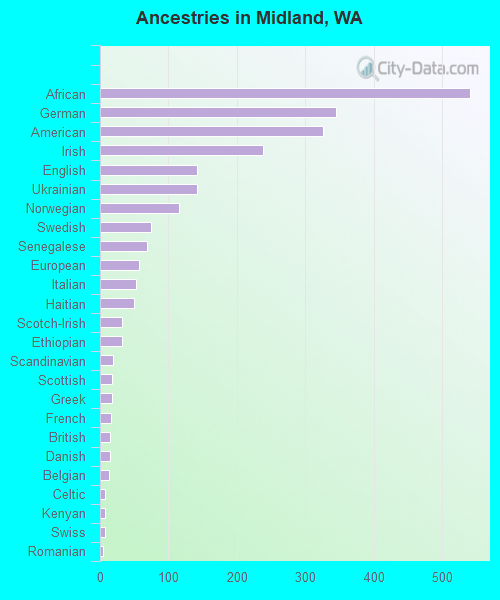
Ancestries in Midland
541 11.2% African344 7.1% German326 6.8% American238 4.9% Irish141 2.9% English141 2.9% Ukrainian115 2.4% Norwegian75 1.6% Swedish68 1.4% Senegalese57 1.2% European53 1.1% Italian49 1.0% Haitian32 0.7% Scotch-Irish32 0.7% Ethiopian19 0.4% Scandinavian18 0.4% Scottish17 0.4% Greek16 0.3% French14 0.3% British14 0.3% Danish13 0.3% Belgian8 0.2% Celtic8 0.2% Kenyan7 0.1% Swiss5 0.1% Romanian4 0.08% Czechoslovakian
Children Nativity (place of birth) in Midland
Children under 6 years - Living with two parents Both parents native 189 100.0% NativeBoth parents foreign-born 107 100.0% NativeOne native, one foreign-born parent 65 100.0% NativeChildren under 6 years - Living with one parent Native parent 203 100.0% NativeForeign-born parent 140 100.0% NativeChildren 6 to 17 years - Living with two parents Both parents native 524 100.0% NativeBoth parents foreign-born 50 18.9% Native215 81.1% Foreign-bornOne native, one foreign-born parent 272 100.0% NativeChildren 6 to 17 years - Living with one parent Native parent 99 100.0% NativeForeign-born parent 251 62.8% Native149 37.2% Foreign-born
Grandparents responsible for own grandchildren in Midland
Grandparents (30 to 59 years) White / Caucasian 14 11.7% Responsible for grandchildren108 88.3% Not responsible for grandchildrenBlack or African American 21 100.0% Responsible for grandchildrenAmerican Indian / Alaska Native 3 100.0% Not responsible for grandchildrenOther race 51 48.5% Responsible for grandchildren54 51.5% Not responsible for grandchildrenWhite alone, not Hispanic / Latino 12 10.1% Responsible for grandchildren111 89.9% Not responsible for grandchildrenHispanic or Latino 100 60.7% Responsible for grandchildren65 39.3% Not responsible for grandchildrenGrandparents (60 years and over) White / Caucasian 6 10.9% Responsible for grandchildren53 89.1% Not responsible for grandchildrenWhite alone, not Hispanic / Latino 7 11.3% Responsible for grandchildren53 88.7% Not responsible for grandchildren