Races in Nantucket, Massachusetts (MA) Detailed Stats
Data:
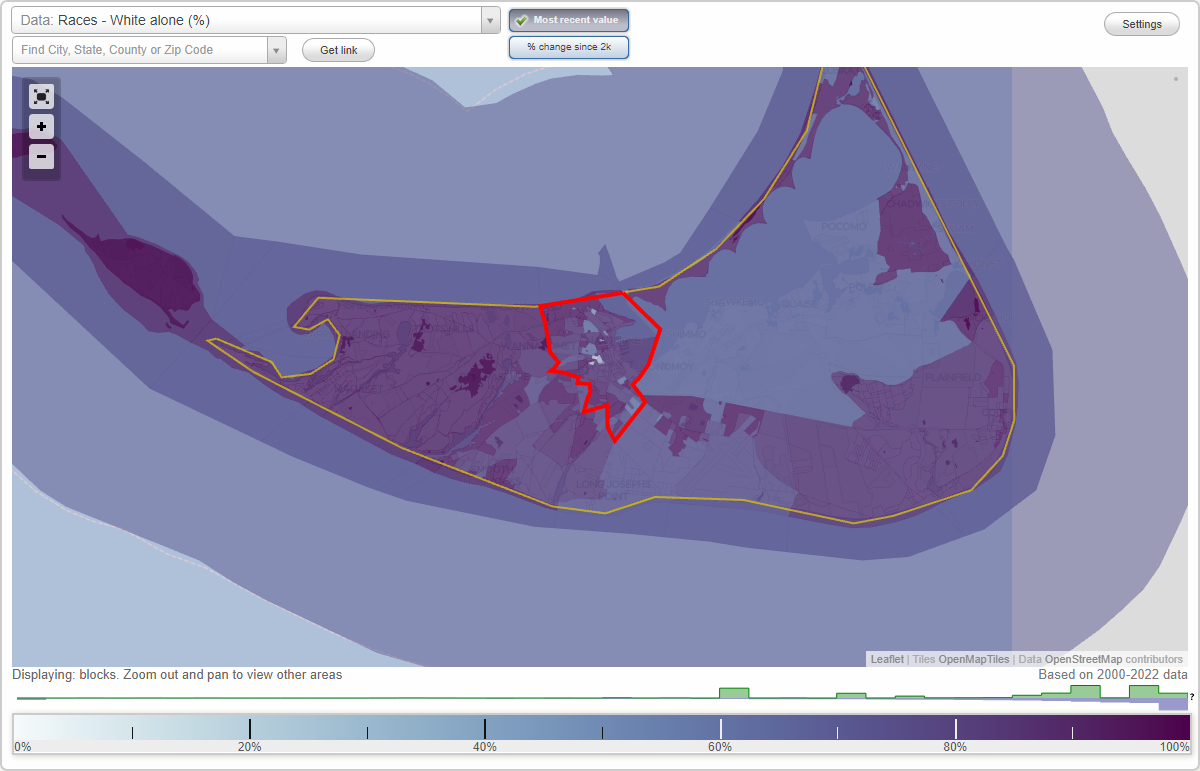
Races - White alone (%)
Races - White alone (% change since 2000)
Races - Black alone (%)
Races - Black alone (% change since 2000)
Races - American Indian alone (%)
Races - American Indian alone (% change since 2000)
Races - Asian alone (%)
Races - Asian alone (% change since 2000)
Races - Hispanic (%)
Races - Hispanic (% change since 2000)
Races - Native Hawaiian and Other Pacific Islander alone (%)
Races - Native Hawaiian and Other Pacific Islander alone (% change since 2000)
Races - Two or more races(%)
Races - Two or more races(% change since 2000)
Races - Other race alone (%)
Races - Other race alone (% change since 2000)
Racial diversity
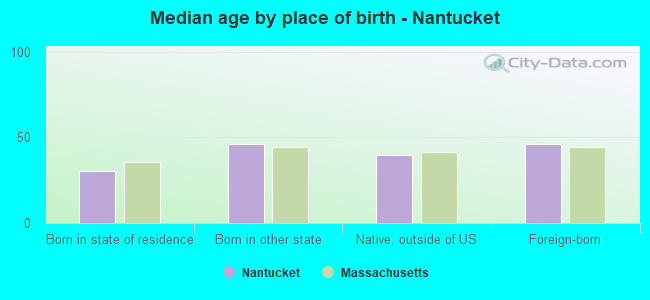
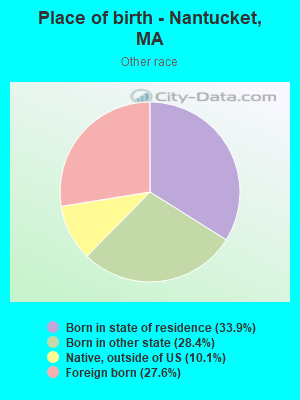
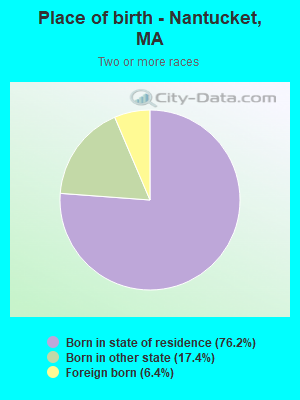
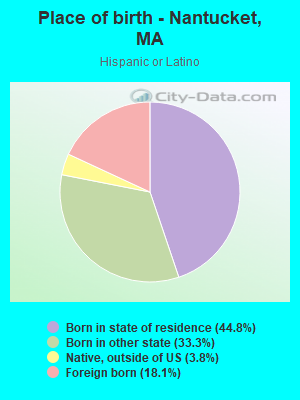
Place of birth - Born in state of residence (%)
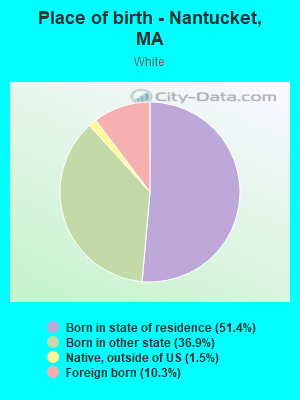
Place of birth - Born in state of residence (%) - White
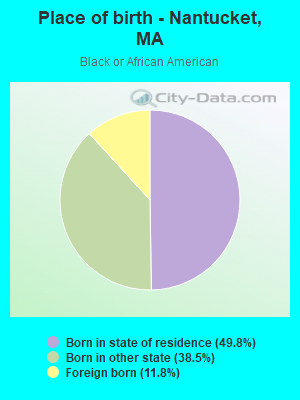
Place of birth - Born in state of residence (%) - Black or African American
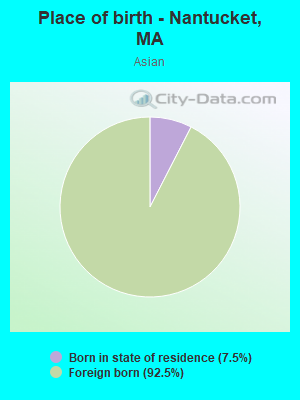
Place of birth - Born in state of residence (%) - Asian
Place of birth - Born in state of residence (%) - Hispanic or Latino
Place of birth - Born in state of residence (%) - American Indian and Alaska Native
Place of birth - Born in state of residence (%) - Multirace
Place of birth - Born in state of residence (%) - Other Race
Place of birth - Born in other state (%)
Place of birth - Born in other state (%) - White
Place of birth - Born in other state (%) - Black or African American
Place of birth - Born in other state (%) - Asian
Place of birth - Born in other state (%) - Hispanic or Latino
Place of birth - Born in other state (%) - American Indian and Alaska Native
Place of birth - Born in other state (%) - Multirace
Place of birth - Born in other state (%) - Other Race
Place of birth - Native, outside of US (%)
Place of birth - Native, outside of US (%) - White
Place of birth - Native, outside of US (%) - Black or African American
Place of birth - Native, outside of US (%) - Asian
Place of birth - Native, outside of US (%) - Hispanic or Latino
Place of birth - Native, outside of US (%) - American Indian and Alaska Native
Place of birth - Native, outside of US (%) - Multirace
Place of birth - Native, outside of US (%) - Other Race
Place of birth - Foreign born (%)
Place of birth - Foreign born (%) - White
Place of birth - Foreign born (%) - Black or African American
Place of birth - Foreign born (%) - Asian
Place of birth - Foreign born (%) - Hispanic or Latino
Place of birth - Foreign born (%) - American Indian and Alaska Native
Place of birth - Foreign born (%) - Multirace
Place of birth - Foreign born (%) - Other Race
Residents speaking English at home (%)
Residents speaking English at home - Born in the United States (%)
Residents speaking English at home - Native, born elsewhere (%)
Residents speaking English at home - Foreign born (%)
Residents speaking Spanish at home (%)
Residents speaking Spanish at home - Born in the United States (%)
Residents speaking Spanish at home - Native, born elsewhere (%)
Residents speaking Spanish at home - Foreign born (%)
Residents speaking other language at home (%)
Residents speaking other language at home - Born in the United States (%)
Residents speaking other language at home - Native, born elsewhere (%)
Residents speaking other language at home - Foreign born (%)
Marital status - Never married (%)
Marital status - Now married (%)
Marital status - Separated (%)
Marital status - Widowed (%)
Marital status - Divorced (%)
Ancestries Reported - Arab (%)
Ancestries Reported - Czech (%)
Ancestries Reported - Danish (%)
Ancestries Reported - Dutch (%)
Ancestries Reported - English (%)
Ancestries Reported - French (%)
Ancestries Reported - French Canadian (%)
Ancestries Reported - German (%)
Ancestries Reported - Greek (%)
Ancestries Reported - Hungarian (%)
Ancestries Reported - Irish (%)
Ancestries Reported - Italian (%)
Ancestries Reported - Lithuanian (%)
Ancestries Reported - Norwegian (%)
Ancestries Reported - Polish (%)
Ancestries Reported - Portuguese (%)
Ancestries Reported - Russian (%)
Ancestries Reported - Scotch-Irish (%)
Ancestries Reported - Scottish (%)
Ancestries Reported - Slovak (%)
Ancestries Reported - Subsaharan African (%)
Ancestries Reported - Swedish (%)
Ancestries Reported - Swiss (%)
Ancestries Reported - Ukrainian (%)
Ancestries Reported - United States (%)
Ancestries Reported - Welsh (%)
Ancestries Reported - West Indian (%)
Ancestries Reported - Other (%)
Geographical mobility - Same house 1 year ago (%)
Geographical mobility - Same house 1 year ago (%) - White
Geographical mobility - Same house 1 year ago (%) - Black or African American
Geographical mobility - Same house 1 year ago (%) - Asian
Geographical mobility - Same house 1 year ago (%) - Hispanic or Latino
Geographical mobility - Same house 1 year ago (%) - American Indian and Alaska Native
Geographical mobility - Same house 1 year ago (%) - Multirace
Geographical mobility - Same house 1 year ago (%) - Other Race
Geographical mobility - Moved within same county (%)
Geographical mobility - Moved within same county (%) - White
Geographical mobility - Moved within same county (%) - Black or African American
Geographical mobility - Moved within same county (%) - Asian
Geographical mobility - Moved within same county (%) - Hispanic or Latino
Geographical mobility - Moved within same county (%) - American Indian and Alaska Native
Geographical mobility - Moved within same county (%) - Multirace
Geographical mobility - Moved within same county (%) - Other Race
Geographical mobility - Moved from different county within same state (%)
Geographical mobility - Moved from different county within same state (%) - White
Geographical mobility - Moved from different county within same state (%) - Black or African American
Geographical mobility - Moved from different county within same state (%) - Asian
Geographical mobility - Moved from different county within same state (%) - Hispanic or Latino
Geographical mobility - Moved from different county within same state (%) - American Indian and Alaska Native
Geographical mobility - Moved from different county within same state (%) - Multirace
Geographical mobility - Moved from different county within same state (%) - Other Race
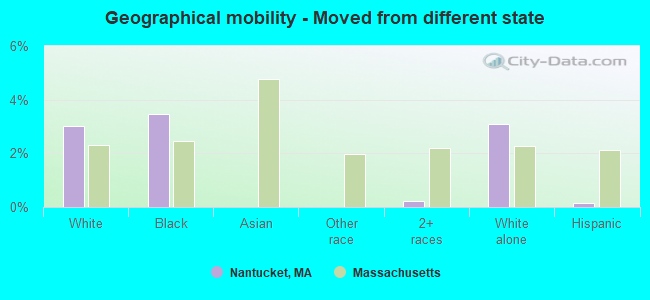
Geographical mobility - Moved from different state (%)
Geographical mobility - Moved from different state (%) - White
Geographical mobility - Moved from different state (%) - Black or African American
Geographical mobility - Moved from different state (%) - Asian
Geographical mobility - Moved from different state (%) - Hispanic or Latino
Geographical mobility - Moved from different state (%) - American Indian and Alaska Native
Geographical mobility - Moved from different state (%) - Multirace
Geographical mobility - Moved from different state (%) - Other Race
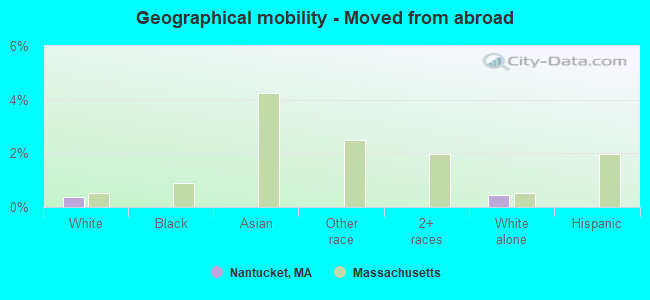
Geographical mobility - Moved from abroad (%)
Geographical mobility - Moved from abroad (%) - White
Geographical mobility - Moved from abroad (%) - Black or African American
Geographical mobility - Moved from abroad (%) - Asian
Geographical mobility - Moved from abroad (%) - Hispanic or Latino
Geographical mobility - Moved from abroad (%) - American Indian and Alaska Native
Geographical mobility - Moved from abroad (%) - Multirace
Geographical mobility - Moved from abroad (%) - Other Race
Place of birth for the foreign-born population - Ireland (%)
Place of birth for the foreign-born population - Denmark (%)
Place of birth for the foreign-born population - Norway (%)
Place of birth for the foreign-born population - Sweden (%)
Place of birth for the foreign-born population - United Kingdom (%)
Place of birth for the foreign-born population - England (%)
Place of birth for the foreign-born population - Scotland (%)
Place of birth for the foreign-born population - Other Northern Europe (%)
Place of birth for the foreign-born population - Austria (%)
Place of birth for the foreign-born population - Belgium (%)
Place of birth for the foreign-born population - France (%)
Place of birth for the foreign-born population - Germany (%)
Place of birth for the foreign-born population - Netherlands (%)
Place of birth for the foreign-born population - Switzerland (%)
Place of birth for the foreign-born population - Other Western Europe (%)
Place of birth for the foreign-born population - Greece (%)
Place of birth for the foreign-born population - Italy (%)
Place of birth for the foreign-born population - Portugal (%)
Place of birth for the foreign-born population - Spain (%)
Place of birth for the foreign-born population - Other Southern Europe (%)
Place of birth for the foreign-born population - Albania (%)
Place of birth for the foreign-born population - Belarus (%)
Place of birth for the foreign-born population - Bosnia and Herzegovina (%)
Place of birth for the foreign-born population - Bulgaria (%)
Place of birth for the foreign-born population - Croatia (%)
Place of birth for the foreign-born population - Czechoslovakia (%)
Place of birth for the foreign-born population - Hungary (%)
Place of birth for the foreign-born population - Latvia (%)
Place of birth for the foreign-born population - Lithuania (%)
Place of birth for the foreign-born population - North Macedonia (Macedonia) (%)
Place of birth for the foreign-born population - Moldova (%)
Place of birth for the foreign-born population - Poland (%)
Place of birth for the foreign-born population - Romania (%)
Place of birth for the foreign-born population - Russia (%)
Place of birth for the foreign-born population - Serbia (%)
Place of birth for the foreign-born population - Ukraine (%)
Place of birth for the foreign-born population - Other Eastern Europe (%)
Place of birth for the foreign-born population - China (%)
Place of birth for the foreign-born population - Hong Kong (%)
Place of birth for the foreign-born population - Taiwan (%)
Place of birth for the foreign-born population - Japan (%)
Place of birth for the foreign-born population - Korea (%)
Place of birth for the foreign-born population - Other Eastern Asia (%)
Place of birth for the foreign-born population - Afghanistan (%)
Place of birth for the foreign-born population - Bangladesh (%)
Place of birth for the foreign-born population - India (%)
Place of birth for the foreign-born population - Iran (%)
Place of birth for the foreign-born population - Kazakhstan (%)
Place of birth for the foreign-born population - Nepal (%)
Place of birth for the foreign-born population - Pakistan (%)
Place of birth for the foreign-born population - Sri Lanka (%)
Place of birth for the foreign-born population - Uzbekistan (%)
Place of birth for the foreign-born population - Other South Central Asia (%)
Place of birth for the foreign-born population - Burma (%)
Place of birth for the foreign-born population - Cambodia (%)
Place of birth for the foreign-born population - Indonesia (%)
Place of birth for the foreign-born population - Laos (%)
Place of birth for the foreign-born population - Malaysia (%)
Place of birth for the foreign-born population - Philippines (%)
Place of birth for the foreign-born population - Singapore (%)
Place of birth for the foreign-born population - Thailand (%)
Place of birth for the foreign-born population - Vietnam (%)
Place of birth for the foreign-born population - Other South Eastern Asia (%)
Place of birth for the foreign-born population - Armenia (%)
Place of birth for the foreign-born population - Iraq (%)
Place of birth for the foreign-born population - Israel (%)
Place of birth for the foreign-born population - Jordan (%)
Place of birth for the foreign-born population - Kuwait (%)
Place of birth for the foreign-born population - Lebanon (%)
Place of birth for the foreign-born population - Saudi Arabia (%)
Place of birth for the foreign-born population - Syria (%)
Place of birth for the foreign-born population - Turkey (%)
Place of birth for the foreign-born population - Yemen (%)
Place of birth for the foreign-born population - Other Western Asia (%)
Place of birth for the foreign-born population - Eritrea (%)
Place of birth for the foreign-born population - Ethiopia (%)
Place of birth for the foreign-born population - Kenya (%)
Place of birth for the foreign-born population - Somalia (%)
Place of birth for the foreign-born population - Uganda (%)
Place of birth for the foreign-born population - Zimbabwe (%)
Place of birth for the foreign-born population - Other Eastern Africa (%)
Place of birth for the foreign-born population - Cameroon (%)
Place of birth for the foreign-born population - Congo (%)
Place of birth for the foreign-born population - Democratic Republic of Congo (Zaire) (%)
Place of birth for the foreign-born population - Other Middle Africa (%)
Place of birth for the foreign-born population - Egypt (%)
Place of birth for the foreign-born population - Morocco (%)
Place of birth for the foreign-born population - Sudan (%)
Place of birth for the foreign-born population - Other Northern Africa (%)
Place of birth for the foreign-born population - South Africa (%)
Place of birth for the foreign-born population - Other Southern Africa (%)
Place of birth for the foreign-born population - Cabo Verde (%)
Place of birth for the foreign-born population - Ghana (%)
Place of birth for the foreign-born population - Liberia (%)
Place of birth for the foreign-born population - Nigeria (%)
Place of birth for the foreign-born population - Senegal (%)
Place of birth for the foreign-born population - Sierra Leone (%)
Place of birth for the foreign-born population - Other Western Africa (%)
Place of birth for the foreign-born population - Australia (%)
Place of birth for the foreign-born population - New Zealand (%)
Place of birth for the foreign-born population - Fiji (%)
Place of birth for the foreign-born population - Micronesia (%)
Place of birth for the foreign-born population - Bahamas (%)
Place of birth for the foreign-born population - Barbados (%)
Place of birth for the foreign-born population - Cuba (%)
Place of birth for the foreign-born population - Dominica (%)
Place of birth for the foreign-born population - Dominican Republic (%)
Place of birth for the foreign-born population - Grenada (%)
Place of birth for the foreign-born population - Haiti (%)
Place of birth for the foreign-born population - Jamaica (%)
Place of birth for the foreign-born population - St. Vincent and the Grenadines (%)
Place of birth for the foreign-born population - Trinidad and Tobago (%)
Place of birth for the foreign-born population - West Indies (%)
Place of birth for the foreign-born population - Other Caribbean (%)
Place of birth for the foreign-born population - Belize (%)
Place of birth for the foreign-born population - Costa Rica (%)
Place of birth for the foreign-born population - El Salvador (%)
Place of birth for the foreign-born population - Guatemala (%)
Place of birth for the foreign-born population - Honduras (%)
Place of birth for the foreign-born population - Mexico (%)
Place of birth for the foreign-born population - Nicaragua (%)
Place of birth for the foreign-born population - Panama (%)
Place of birth for the foreign-born population - Other Central America (%)
Place of birth for the foreign-born population - Argentina (%)
Place of birth for the foreign-born population - Bolivia (%)
Place of birth for the foreign-born population - Brazil (%)
Place of birth for the foreign-born population - Chile (%)
Place of birth for the foreign-born population - Colombia (%)
Place of birth for the foreign-born population - Ecuador (%)
Place of birth for the foreign-born population - Guyana (%)
Place of birth for the foreign-born population - Peru (%)
Place of birth for the foreign-born population - Uruguay (%)
Place of birth for the foreign-born population - Venezuela (%)
Place of birth for the foreign-born population - Other South America (%)
Place of birth for the foreign-born population - Canada (%)
Place of birth for the foreign-born population - Other Northern America (%)
Place of birth for the foreign-born population - Other (%)
Latest news about races in Nantucket, MA collected exclusively by city-data.com from local newspapers, TV, and radio stations
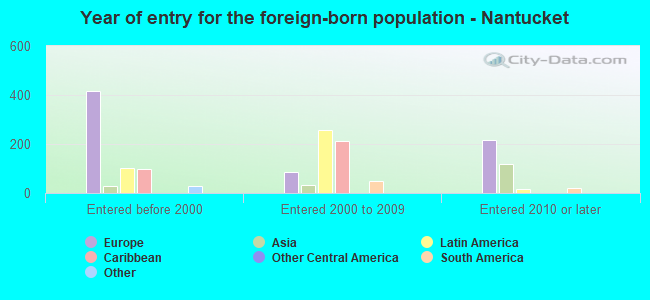
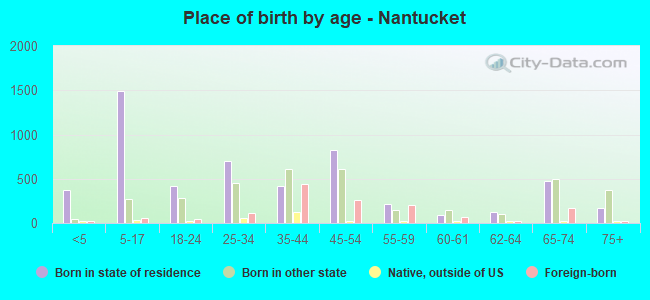
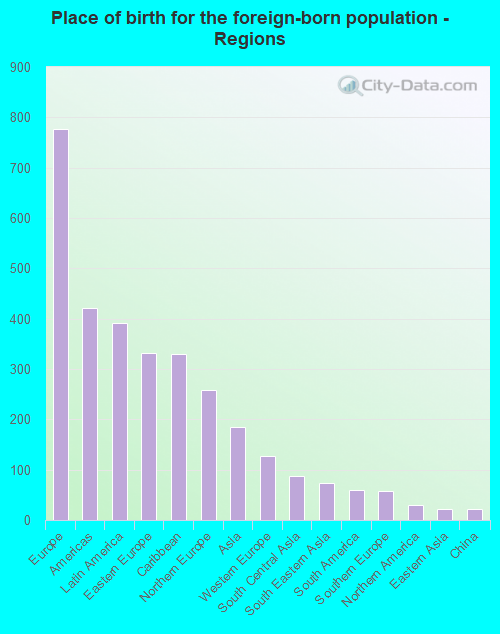
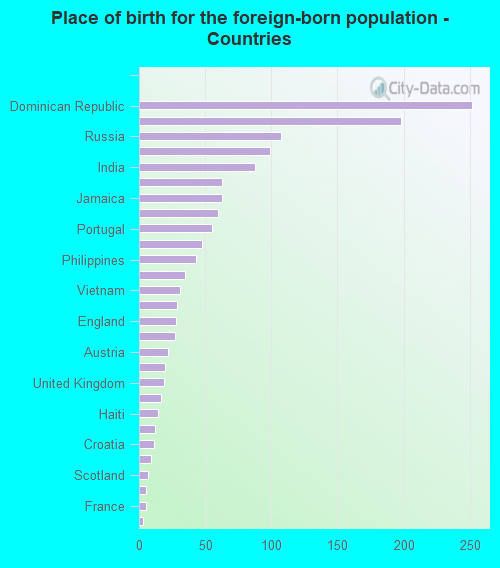
According to 2022 data, the most numerous races in Nantucket, MA are White alone (7,195 residents), Hispanic (1,793 residents), and Asian alone (71 residents). 83.2% of Nantucket residents speak English at home. 13.2% of Nantucket, MA residents are foreign-born (7.2% born in Europe, 3.6% born in Latin America, 1.7% born in Asia), which is 36.3% less than the foreign-born rate of 18.0% across the entire state of Massachusetts.
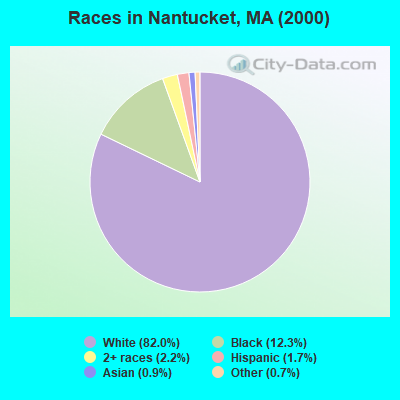
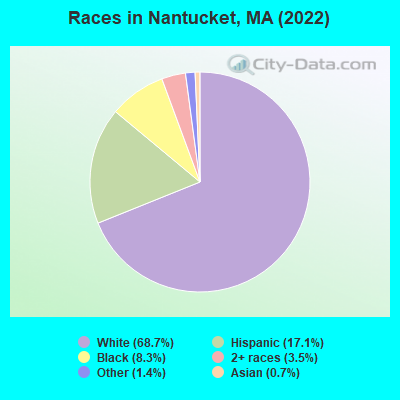
Race distribution in Nantucket
2000 2022
5,198,359 81.9% White alone 428,729 6.8% Hispanic 318,329 5.0% Black alone 236,786 3.7% Asian alone 110,338 1.7% Two or more races 43,586 0.7% Other race alone 11,264 0.2% American Indian alone 1,706 0.03% Native Hawaiian and Other
4,676,627 67.0% White alone 911,038 13.0% Hispanic 501,463 7.2% Asian alone 459,740 6.6% Black alone 341,889 4.9% Two or more races 84,403 1.2% Other race alone 5,838 0.08% American Indian alone 976 0.01% Native Hawaiian and Other
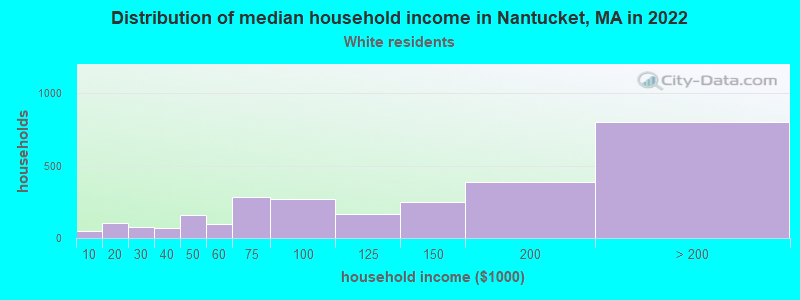
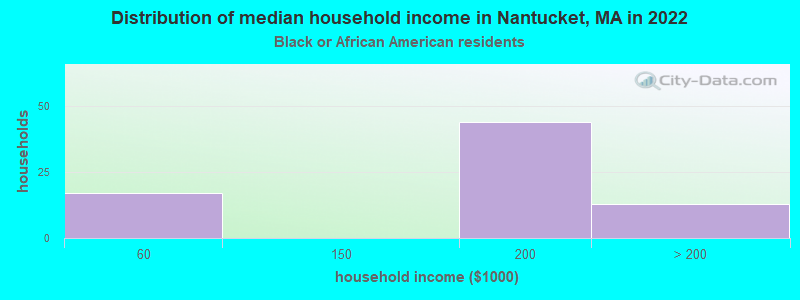
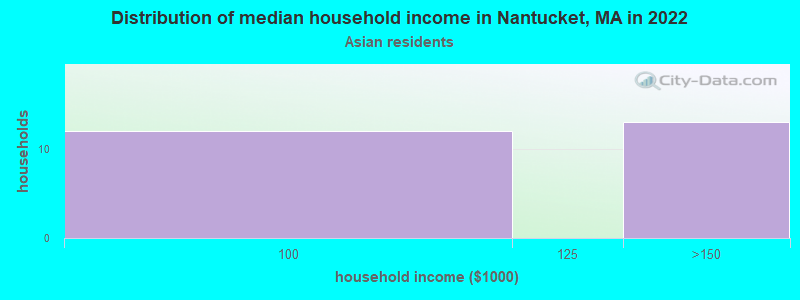
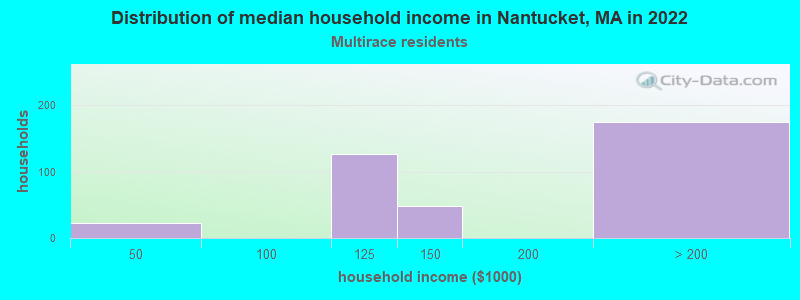
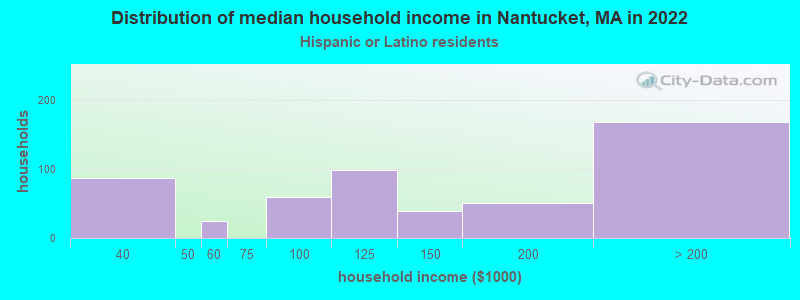
Income and house value in Nantucket Median household income in 2022 $133,228 White non-Hispanic householders$180,008 Black householdersMedian 2022 house value over $1,000,000 White Non-Hispanic householders$884,158 Black or African American householders$825,214 Some other race householders
Median age by race in Nantucket
45.0 Median age for White residents45.2 45.0 38.6 Median age for Black or African American residents47.9 19.7 -655,238,094.6 Median age for American Indian / Alaska Native residents-649,474,688.9 -657,223,795.4 42.1 Median age for Asian residents-680,272,108.2 53.6 -514,227,641.8 Median age for Native Hawaiian / Pacific Islander residents-513,131,312.6 -508,717,948.2 12.2 Median age for Other race residents11.6 36.9 26.8 Median age for Two or more races residents16.9 54.8 44.7 Median age for White alone residents46.3 44.6 27.5 Median age for Hispanic or Latino residents15.8 40.9
Owner/renter occupied households by race in Nantucket
House owners and renters - White residents 2,114 77.5% Owner occupied612 22.5% Renter occupiedHouse owners and renters - Black or African American residents 79 100.0% Renter occupiedHouse owners and renters - Asian residents 27 100.0% Owner occupiedHouse owners and renters - Other race residents 24 20.9% Owner occupied92 79.1% Renter occupiedHouse owners and renters - Two or more races residents 377 94.6% Owner occupied21 5.4% Renter occupiedHouse owners and renters - White alone residents 2,078 77.7% Owner occupied595 22.3% Renter occupiedHouse owners and renters - Hispanic or Latino residents 346 66.0% Owner occupied178 34.0% Renter occupied
Language usage in Nantucket
English speakers - Total 83.2% of residents of Nantucket speak English at home.
8.3% of residents speak Spanish at home 736 88.6% Speak English very well95 11.4% Speak English less than very well8.1% of residents speak other language at home 573 70.7% Speak English very well237 29.3% Speak English less than very well
English speakers - Born in the United States 86.9% of residents of Nantucket speak English at home.
12.0% of residents speak Spanish at home 418 100.0% Speak English very well0.7% of residents speak other language at home 26 100.0% Speak English very well
English speakers - Native, born elsewhere 71.8% of residents of Nantucket speak English at home.
27.3% of residents speak Spanish at home 65 100.0% Speak English very well2.9% of residents speak other language at home 7 100.0% Speak English very well
English speakers - Foreign-born 32.7% of residents of Nantucket speak English at home.
18.8% of residents speak Spanish at home 162 62.3% Speak English very well98 37.7% Speak English less than very well46.8% of residents speak other language at home 412 63.7% Speak English very well235 36.3% Speak English less than very well
White (Caucasian) - Speak only English Native:
97.7% (6,051)Foreign-born:
40.3% (300)
White (Caucasian) - Speak another language Native:
2.9% (178)Foreign-born:
59.8% (445)
Black or African American - Speak only English Native:
82.8% (814)Foreign-born:
57.6% (77)
Black or African American - Speak another language Native:
17.0% (167)Foreign-born:
45.0% (60)
Asian - Speak only English Native:
100.0% (6)Foreign-born:
45.6% (30)
Other race - Speak another language Native:
73.5% (346)Foreign-born:
99.0% (226)
Two or more races - Speak another language Native:
3.2% (36)Foreign-born:
99.9% (76)
White alone - Speak only English Native:
97.4% (6,015)Foreign-born:
34.7% (261)
White alone - Speak another language Native:
2.7% (166)Foreign-born:
64.4% (484)
Hispanic or Latino - Speak only English Native:
58.5% (750)Foreign-born:
18.5% (61)
Hispanic or Latino - Speak another language Native:
43.0% (551)Foreign-born:
82.0% (270)
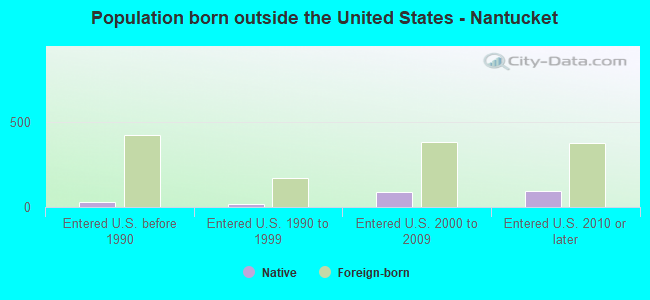
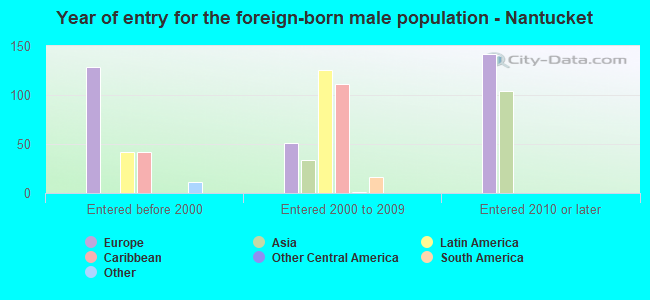
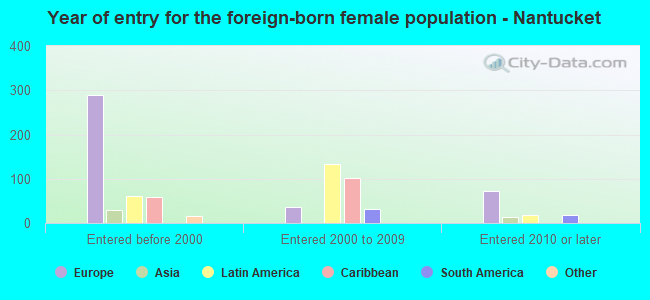
Foreign-born residents in Nantucket 1,383 residents are foreign born (7.2% Europe , 3.6% Latin America , 1.7% Asia ).
This city:
13.2%Massachusetts:
17.6%
Marital status for residents in Nantucket Marital status - White (Caucasian) population 15 years and over
Males 41.2% Never married48.5% Now married1.0% Separated0.8% Widowed8.5% DivorcedFemales 31.6% Never married47.6% Now married0.5% Separated10.1% Widowed10.2% DivorcedWomen who gave birth in the past 12 months Now married:
43.3% (36)Unmarried:
56.7% (47)
Women who did not give birth in the past 12 months Now married:
41.9% (691)Unmarried:
58.1% (957)
Marital status - Black or African American population 15 years and over
Males 22.2% Never married68.4% Now married0.0% Separated0.0% Widowed9.4% DivorcedFemales 48.8% Never married48.4% Now married0.0% Separated2.8% Widowed0.0% DivorcedWomen who did not give birth in the past 12 months Now married:
18.3% (23)Unmarried:
81.7% (101)
Marital status - Asian population 15 years and over
Males 0.0% Never married100.0% Now married0.0% Separated0.0% Widowed0.0% DivorcedFemales 43.6% Never married33.3% Now married0.0% Separated23.1% Widowed0.0% DivorcedWomen who did not give birth in the past 12 months Now married:
72.2% (13)Unmarried:
27.8% (5)
Marital status - Other race population 15 years and over
Males 12.6% Never married87.4% Now married0.0% Separated0.0% Widowed0.0% DivorcedFemales 50.2% Never married49.8% Now married0.0% Separated0.0% Widowed0.0% DivorcedWomen who did not give birth in the past 12 months Now married:
43.1% (95)Unmarried:
56.9% (125)
Marital status - Two or more races population 15 years and over
Males 78.9% Never married18.2% Now married0.0% Separated0.0% Widowed2.9% DivorcedFemales 48.4% Never married51.6% Now married0.0% Separated0.0% Widowed0.0% DivorcedWomen who did not give birth in the past 12 months Now married:
6.4% (12)Unmarried:
93.6% (174)
Marital status - White alone, not Hispanic / Latino population 15 years and over
Males 41.3% Never married48.6% Now married1.0% Separated0.9% Widowed8.2% DivorcedFemales 31.6% Never married47.6% Now married0.5% Separated10.1% Widowed10.2% DivorcedWomen who gave birth in the past 12 months Now married:
43.3% (37)Unmarried:
56.7% (49)
Women who did not give birth in the past 12 months Now married:
41.9% (714)Unmarried:
58.1% (990)
Marital status - Hispanic or Latino population 15 years and over
Males 48.1% Never married38.9% Now married0.0% Separated0.0% Widowed12.9% DivorcedFemales 36.8% Never married63.2% Now married0.0% Separated0.0% Widowed0.0% DivorcedWomen who did not give birth in the past 12 months Now married:
34.4% (89)Unmarried:
65.6% (170)
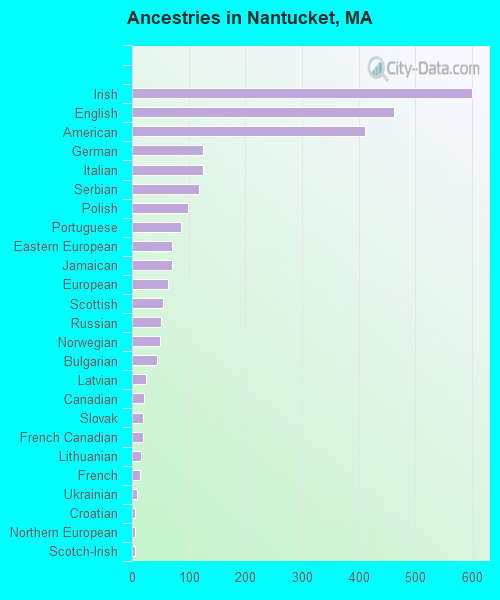
Ancestries in Nantucket
600 15.3% Irish463 11.8% English411 10.5% American125 3.2% German125 3.2% Italian119 3.0% Serbian98 2.5% Polish87 2.2% Portuguese71 1.8% Eastern European70 1.8% Jamaican64 1.6% European55 1.4% Scottish51 1.3% Russian50 1.3% Norwegian45 1.1% Bulgarian25 0.6% Latvian22 0.6% Canadian20 0.5% Slovak19 0.5% French Canadian16 0.4% Lithuanian14 0.4% French8 0.2% Ukrainian6 0.2% Croatian6 0.2% Northern European6 0.2% Scotch-Irish6 0.2% African5 0.1% Armenian5 0.1% Danish5 0.1% Hungarian3 0.08% British
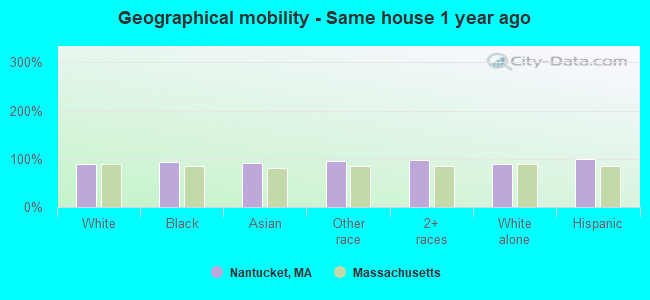
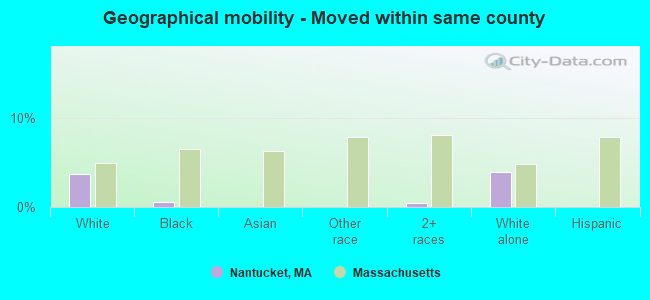
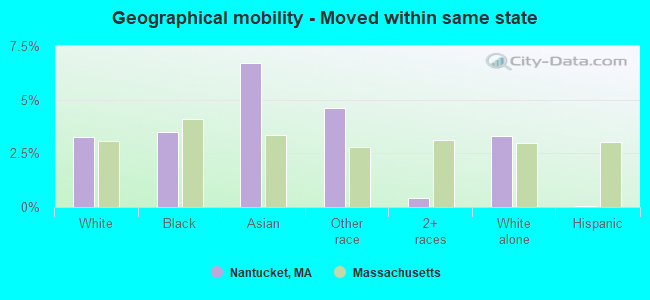
Geographical mobility in Nantucket Same house 1 year ago 6,521 90.0% White (Caucasian)1,031 93.5% Black or African American66 92.3% Asian785 95.0% Other race1,221 97.8% Two or more races6,428 89.5% White alone, not Hispanic / Latino1,790 99.9% Hispanic or LatinoMoved within same county 264 3.6% White / Caucasian6 0.6% Black or African American6 0.5% Two or more races280 3.9% White alone, not Hispanic / LatinoMoved within same state 235 3.2% White / Caucasian38 3.5% Black or African American5 6.7% Asian38 4.6% Other race5 0.4% Two or more races238 3.3% White alone, not Hispanic / Latino1 0.1% Hispanic or LatinoMoved from different state 220 3.0% White / Caucasian38 3.5% Black or African American3 0.2% Two or more races221 3.1% White alone, not Hispanic / Latino2 0.1% Hispanic or LatinoMoved from abroad 28 0.4% White31 0.4% White alone, not Hispanic / Latino
Children Nativity (place of birth) in Nantucket
Children under 6 years - Living with two parents Both parents native 149 100.0% NativeBoth parents foreign-born 165 100.0% NativeOne native, one foreign-born parent 69 100.0% NativeChildren under 6 years - Living with one parent Native parent 50 100.0% NativeForeign-born parent 41 100.0% NativeChildren 6 to 17 years - Living with two parents Both parents native 1,275 100.0% NativeBoth parents foreign-born 169 77.5% Native49 22.5% Foreign-bornOne native, one foreign-born parent 24 100.0% NativeChildren 6 to 17 years - Living with one parent Native parent 154 100.0% NativeForeign-born parent 73 50.5% Native72 49.5% Foreign-born
Grandparents responsible for own grandchildren in Nantucket
Grandparents (30 to 59 years) White / Caucasian 63 100.0% Responsible for grandchildrenWhite alone, not Hispanic / Latino 71 100.0% Responsible for grandchildrenGrandparents (60 years and over) White / Caucasian 16 28.0% Responsible for grandchildren42 72.0% Not responsible for grandchildrenWhite alone, not Hispanic / Latino 17 28.1% Responsible for grandchildren43 71.9% Not responsible for grandchildren