Races in New Durham, New Hampshire (NH) Detailed Stats
Ancestries, Foreign-born residents, place of birth

Recent posts about races in New Durham, New Hampshire on our local forum with over 2,400,000 registered users:
 | Thinking of Moving my Family to New Hampshire. Looking for Thoughts from Residents. (21 replies) |
| Thinking of moving to New Hampshire from WA (40 replies) |
| Reputation of towns in the Lakes Region? (28 replies) |
| Libertarian thinking of escaping to NH (16 replies) |
| Here is my plan, you all tell me if I'm crazy. (26 replies) |
| Nebraska looking to relocate to New Hampshire (9 replies) |
1.3% of New Durham, NH residents are foreign-born , which is 282.8% less than the foreign-born rate of 5.0% across the entire state of New Hampshire.
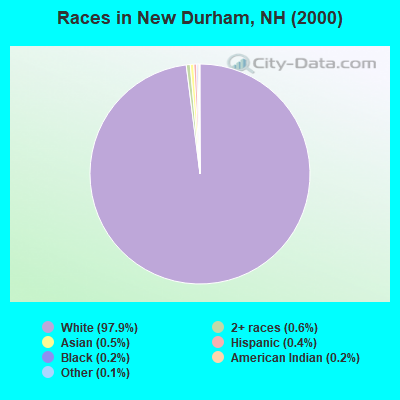
Race distribution in New Durham

- 2,17497.9%White alone
- 140.6%Two or more races
- 120.5%Asian alone
- 90.4%Hispanic
- 40.2%Black alone
- 40.2%American Indian alone
- 30.1%Other race alone
2000
2022
-
- 1,175,25295.1%White alone
- 20,4891.7%Hispanic
- 15,8031.3%Asian alone
- 11,6060.9%Two or more races
- 8,3540.7%Black alone
- 2,6980.2%American Indian alone
- 1,2540.1%Other race alone
- 3300.03%Native Hawaiian and Other
Pacific Islander alone

-
- 1,208,10186.6%White alone
- 63,4794.5%Hispanic
- 60,7244.4%Two or more races
- 36,5192.6%Asian alone
- 17,9311.3%Black alone
- 6,6150.5%Other race alone
- 1,0140.07%American Indian alone
- 8480.06%Native Hawaiian and Other
Pacific Islander alone

Income and house value in New Durham
- Median household income in 2022
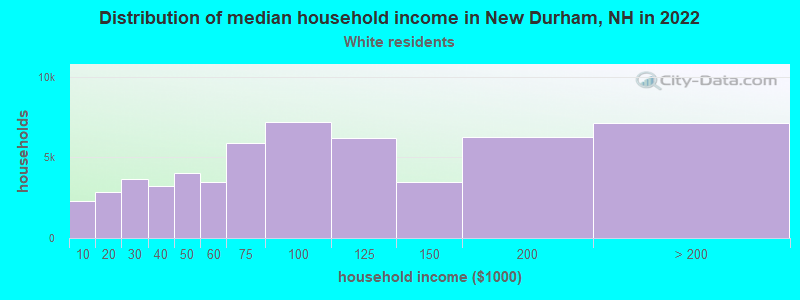
- $97,463White non-Hispanic householders
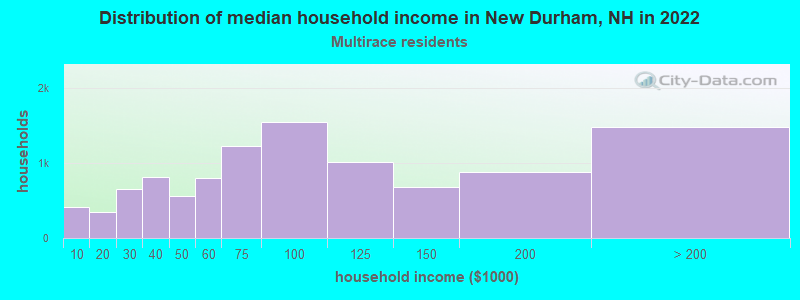
- $101,019Two or more races householders
- Median 2022 house value
- $364,754White Non-Hispanic householders
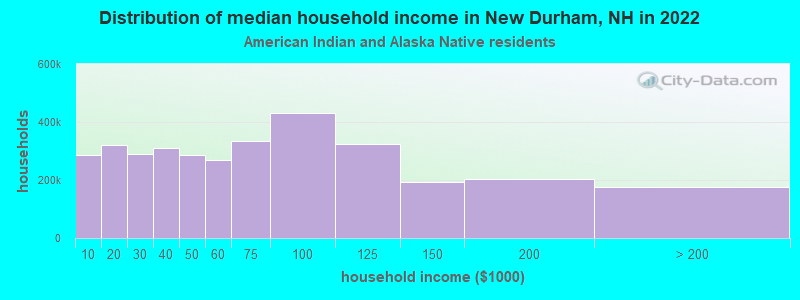
- $387,377American Indian or Alaska Native householders
- $325,396Two or more races householders
Household income for White non-Hispanic householders
Household income for American Indian and Alaska Native householders
Household income for Two or more races householders
Foreign-born residents in New Durham
29 residents are foreign born
| This city: | 1.3% |
| New Hampshire: | 4.4% |
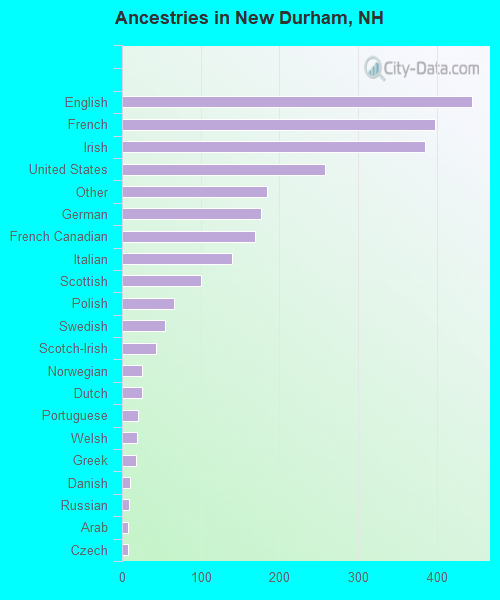
Ancestries in New Durham

- 44417.3%English
- 39815.5%French
- 38515.0%Irish
- 25810.0%United States
- 1847.2%Other
- 1776.9%German
- 1696.6%French Canadian
- 1405.4%Italian
- 1003.9%Scottish
- 662.6%Polish
- 542.1%Swedish
- 431.7%Scotch-Irish
- 261.0%Norwegian
- 251.0%Dutch
- 200.8%Portuguese
- 190.7%Welsh
- 180.7%Greek
- 100.4%Danish
- 90.4%Russian
- 80.3%Arab
- 70.3%Czech
- 40.2%Lithuanian
- 30.1%Slovak
- 20.08%Hungarian
Zip codes: 03855.