Races in Noel, Missouri (MO) Detailed Stats
Data:
Races - White alone (%)
Races - White alone (% change since 2000)
Races - Black alone (%)
Races - Black alone (% change since 2000)
Races - American Indian alone (%)
Races - American Indian alone (% change since 2000)
Races - Asian alone (%)
Races - Asian alone (% change since 2000)
Races - Hispanic (%)
Races - Hispanic (% change since 2000)
Races - Native Hawaiian and Other Pacific Islander alone (%)
Races - Native Hawaiian and Other Pacific Islander alone (% change since 2000)
Races - Two or more races(%)
Races - Two or more races(% change since 2000)
Races - Other race alone (%)
Races - Other race alone (% change since 2000)
Racial diversity
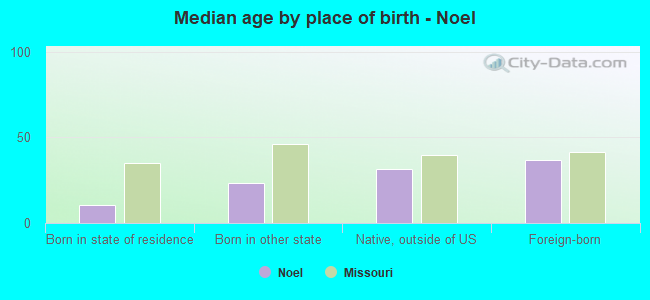
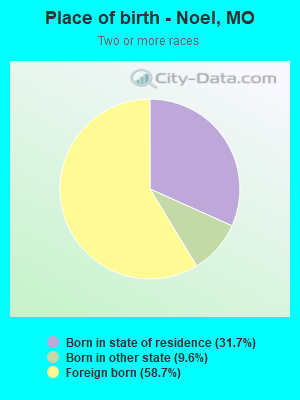
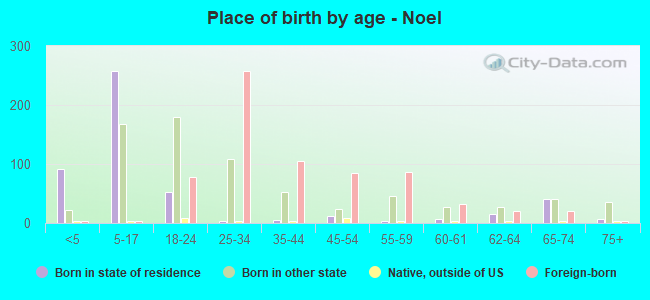
Place of birth - Born in state of residence (%)
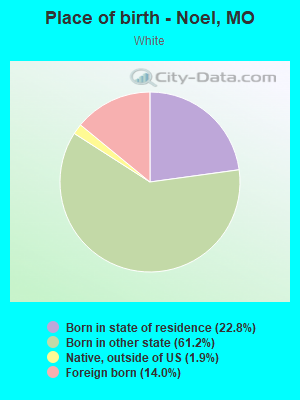
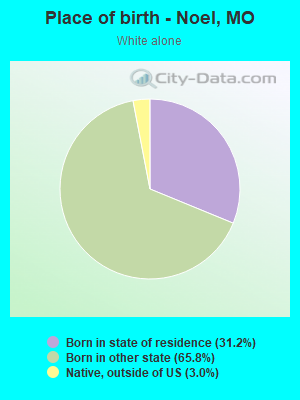
Place of birth - Born in state of residence (%) - White
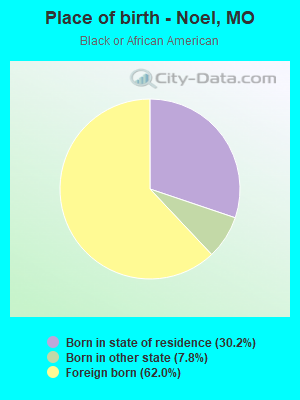
Place of birth - Born in state of residence (%) - Black or African American
Place of birth - Born in state of residence (%) - Asian
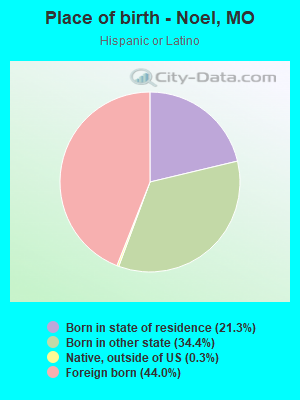
Place of birth - Born in state of residence (%) - Hispanic or Latino
Place of birth - Born in state of residence (%) - American Indian and Alaska Native
Place of birth - Born in state of residence (%) - Multirace
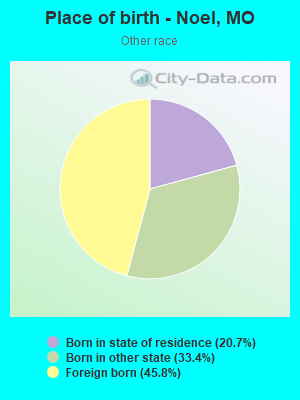
Place of birth - Born in state of residence (%) - Other Race
Place of birth - Born in other state (%)
Place of birth - Born in other state (%) - White
Place of birth - Born in other state (%) - Black or African American
Place of birth - Born in other state (%) - Asian
Place of birth - Born in other state (%) - Hispanic or Latino
Place of birth - Born in other state (%) - American Indian and Alaska Native
Place of birth - Born in other state (%) - Multirace
Place of birth - Born in other state (%) - Other Race
Place of birth - Native, outside of US (%)
Place of birth - Native, outside of US (%) - White
Place of birth - Native, outside of US (%) - Black or African American
Place of birth - Native, outside of US (%) - Asian
Place of birth - Native, outside of US (%) - Hispanic or Latino
Place of birth - Native, outside of US (%) - American Indian and Alaska Native
Place of birth - Native, outside of US (%) - Multirace
Place of birth - Native, outside of US (%) - Other Race
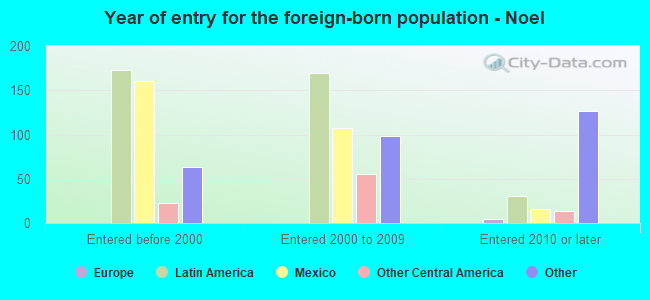
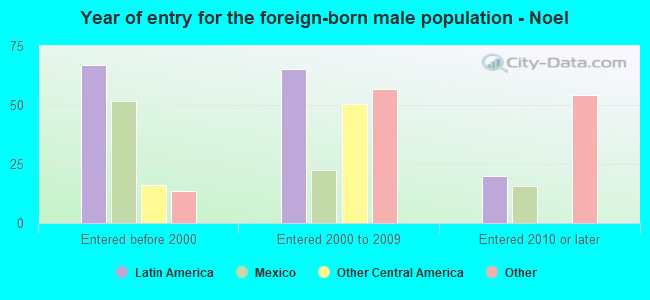
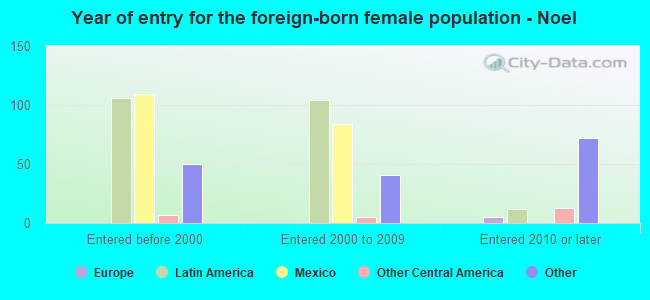
Place of birth - Foreign born (%)
Place of birth - Foreign born (%) - White
Place of birth - Foreign born (%) - Black or African American
Place of birth - Foreign born (%) - Asian
Place of birth - Foreign born (%) - Hispanic or Latino
Place of birth - Foreign born (%) - American Indian and Alaska Native
Place of birth - Foreign born (%) - Multirace
Place of birth - Foreign born (%) - Other Race
Residents speaking English at home (%)
Residents speaking English at home - Born in the United States (%)
Residents speaking English at home - Native, born elsewhere (%)
Residents speaking English at home - Foreign born (%)
Residents speaking Spanish at home (%)
Residents speaking Spanish at home - Born in the United States (%)
Residents speaking Spanish at home - Native, born elsewhere (%)
Residents speaking Spanish at home - Foreign born (%)
Residents speaking other language at home (%)
Residents speaking other language at home - Born in the United States (%)
Residents speaking other language at home - Native, born elsewhere (%)
Residents speaking other language at home - Foreign born (%)
Marital status - Never married (%)
Marital status - Now married (%)
Marital status - Separated (%)
Marital status - Widowed (%)
Marital status - Divorced (%)
Ancestries Reported - Arab (%)
Ancestries Reported - Czech (%)
Ancestries Reported - Danish (%)
Ancestries Reported - Dutch (%)
Ancestries Reported - English (%)
Ancestries Reported - French (%)
Ancestries Reported - French Canadian (%)
Ancestries Reported - German (%)
Ancestries Reported - Greek (%)
Ancestries Reported - Hungarian (%)
Ancestries Reported - Irish (%)
Ancestries Reported - Italian (%)
Ancestries Reported - Lithuanian (%)
Ancestries Reported - Norwegian (%)
Ancestries Reported - Polish (%)
Ancestries Reported - Portuguese (%)
Ancestries Reported - Russian (%)
Ancestries Reported - Scotch-Irish (%)
Ancestries Reported - Scottish (%)
Ancestries Reported - Slovak (%)
Ancestries Reported - Subsaharan African (%)
Ancestries Reported - Swedish (%)
Ancestries Reported - Swiss (%)
Ancestries Reported - Ukrainian (%)
Ancestries Reported - United States (%)
Ancestries Reported - Welsh (%)
Ancestries Reported - West Indian (%)
Ancestries Reported - Other (%)
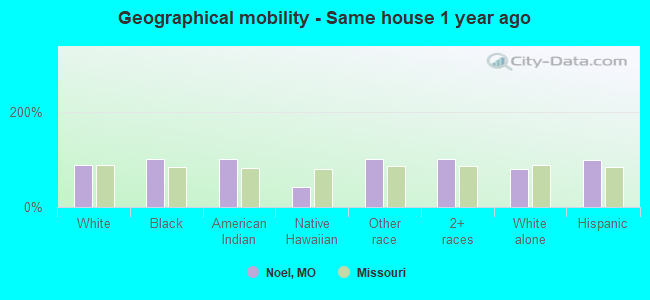
Geographical mobility - Same house 1 year ago (%)
Geographical mobility - Same house 1 year ago (%) - White
Geographical mobility - Same house 1 year ago (%) - Black or African American
Geographical mobility - Same house 1 year ago (%) - Asian
Geographical mobility - Same house 1 year ago (%) - Hispanic or Latino
Geographical mobility - Same house 1 year ago (%) - American Indian and Alaska Native
Geographical mobility - Same house 1 year ago (%) - Multirace
Geographical mobility - Same house 1 year ago (%) - Other Race
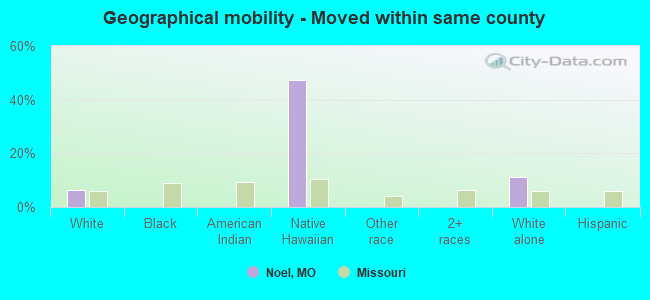
Geographical mobility - Moved within same county (%)
Geographical mobility - Moved within same county (%) - White
Geographical mobility - Moved within same county (%) - Black or African American
Geographical mobility - Moved within same county (%) - Asian
Geographical mobility - Moved within same county (%) - Hispanic or Latino
Geographical mobility - Moved within same county (%) - American Indian and Alaska Native
Geographical mobility - Moved within same county (%) - Multirace
Geographical mobility - Moved within same county (%) - Other Race
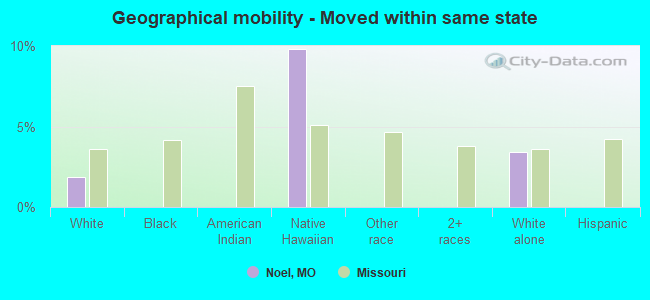
Geographical mobility - Moved from different county within same state (%)
Geographical mobility - Moved from different county within same state (%) - White
Geographical mobility - Moved from different county within same state (%) - Black or African American
Geographical mobility - Moved from different county within same state (%) - Asian
Geographical mobility - Moved from different county within same state (%) - Hispanic or Latino
Geographical mobility - Moved from different county within same state (%) - American Indian and Alaska Native
Geographical mobility - Moved from different county within same state (%) - Multirace
Geographical mobility - Moved from different county within same state (%) - Other Race
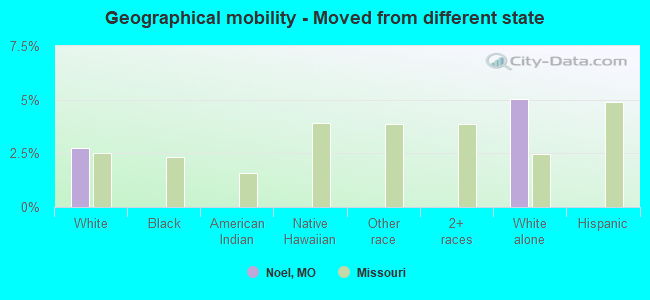
Geographical mobility - Moved from different state (%)
Geographical mobility - Moved from different state (%) - White
Geographical mobility - Moved from different state (%) - Black or African American
Geographical mobility - Moved from different state (%) - Asian
Geographical mobility - Moved from different state (%) - Hispanic or Latino
Geographical mobility - Moved from different state (%) - American Indian and Alaska Native
Geographical mobility - Moved from different state (%) - Multirace
Geographical mobility - Moved from different state (%) - Other Race
Geographical mobility - Moved from abroad (%)
Geographical mobility - Moved from abroad (%) - White
Geographical mobility - Moved from abroad (%) - Black or African American
Geographical mobility - Moved from abroad (%) - Asian
Geographical mobility - Moved from abroad (%) - Hispanic or Latino
Geographical mobility - Moved from abroad (%) - American Indian and Alaska Native
Geographical mobility - Moved from abroad (%) - Multirace
Geographical mobility - Moved from abroad (%) - Other Race
Place of birth for the foreign-born population - Ireland (%)
Place of birth for the foreign-born population - Denmark (%)
Place of birth for the foreign-born population - Norway (%)
Place of birth for the foreign-born population - Sweden (%)
Place of birth for the foreign-born population - United Kingdom (%)
Place of birth for the foreign-born population - England (%)
Place of birth for the foreign-born population - Scotland (%)
Place of birth for the foreign-born population - Other Northern Europe (%)
Place of birth for the foreign-born population - Austria (%)
Place of birth for the foreign-born population - Belgium (%)
Place of birth for the foreign-born population - France (%)
Place of birth for the foreign-born population - Germany (%)
Place of birth for the foreign-born population - Netherlands (%)
Place of birth for the foreign-born population - Switzerland (%)
Place of birth for the foreign-born population - Other Western Europe (%)
Place of birth for the foreign-born population - Greece (%)
Place of birth for the foreign-born population - Italy (%)
Place of birth for the foreign-born population - Portugal (%)
Place of birth for the foreign-born population - Spain (%)
Place of birth for the foreign-born population - Other Southern Europe (%)
Place of birth for the foreign-born population - Albania (%)
Place of birth for the foreign-born population - Belarus (%)
Place of birth for the foreign-born population - Bosnia and Herzegovina (%)
Place of birth for the foreign-born population - Bulgaria (%)
Place of birth for the foreign-born population - Croatia (%)
Place of birth for the foreign-born population - Czechoslovakia (%)
Place of birth for the foreign-born population - Hungary (%)
Place of birth for the foreign-born population - Latvia (%)
Place of birth for the foreign-born population - Lithuania (%)
Place of birth for the foreign-born population - North Macedonia (Macedonia) (%)
Place of birth for the foreign-born population - Moldova (%)
Place of birth for the foreign-born population - Poland (%)
Place of birth for the foreign-born population - Romania (%)
Place of birth for the foreign-born population - Russia (%)
Place of birth for the foreign-born population - Serbia (%)
Place of birth for the foreign-born population - Ukraine (%)
Place of birth for the foreign-born population - Other Eastern Europe (%)
Place of birth for the foreign-born population - China (%)
Place of birth for the foreign-born population - Hong Kong (%)
Place of birth for the foreign-born population - Taiwan (%)
Place of birth for the foreign-born population - Japan (%)
Place of birth for the foreign-born population - Korea (%)
Place of birth for the foreign-born population - Other Eastern Asia (%)
Place of birth for the foreign-born population - Afghanistan (%)
Place of birth for the foreign-born population - Bangladesh (%)
Place of birth for the foreign-born population - India (%)
Place of birth for the foreign-born population - Iran (%)
Place of birth for the foreign-born population - Kazakhstan (%)
Place of birth for the foreign-born population - Nepal (%)
Place of birth for the foreign-born population - Pakistan (%)
Place of birth for the foreign-born population - Sri Lanka (%)
Place of birth for the foreign-born population - Uzbekistan (%)
Place of birth for the foreign-born population - Other South Central Asia (%)
Place of birth for the foreign-born population - Burma (%)
Place of birth for the foreign-born population - Cambodia (%)
Place of birth for the foreign-born population - Indonesia (%)
Place of birth for the foreign-born population - Laos (%)
Place of birth for the foreign-born population - Malaysia (%)
Place of birth for the foreign-born population - Philippines (%)
Place of birth for the foreign-born population - Singapore (%)
Place of birth for the foreign-born population - Thailand (%)
Place of birth for the foreign-born population - Vietnam (%)
Place of birth for the foreign-born population - Other South Eastern Asia (%)
Place of birth for the foreign-born population - Armenia (%)
Place of birth for the foreign-born population - Iraq (%)
Place of birth for the foreign-born population - Israel (%)
Place of birth for the foreign-born population - Jordan (%)
Place of birth for the foreign-born population - Kuwait (%)
Place of birth for the foreign-born population - Lebanon (%)
Place of birth for the foreign-born population - Saudi Arabia (%)
Place of birth for the foreign-born population - Syria (%)
Place of birth for the foreign-born population - Turkey (%)
Place of birth for the foreign-born population - Yemen (%)
Place of birth for the foreign-born population - Other Western Asia (%)
Place of birth for the foreign-born population - Eritrea (%)
Place of birth for the foreign-born population - Ethiopia (%)
Place of birth for the foreign-born population - Kenya (%)
Place of birth for the foreign-born population - Somalia (%)
Place of birth for the foreign-born population - Uganda (%)
Place of birth for the foreign-born population - Zimbabwe (%)
Place of birth for the foreign-born population - Other Eastern Africa (%)
Place of birth for the foreign-born population - Cameroon (%)
Place of birth for the foreign-born population - Congo (%)
Place of birth for the foreign-born population - Democratic Republic of Congo (Zaire) (%)
Place of birth for the foreign-born population - Other Middle Africa (%)
Place of birth for the foreign-born population - Egypt (%)
Place of birth for the foreign-born population - Morocco (%)
Place of birth for the foreign-born population - Sudan (%)
Place of birth for the foreign-born population - Other Northern Africa (%)
Place of birth for the foreign-born population - South Africa (%)
Place of birth for the foreign-born population - Other Southern Africa (%)
Place of birth for the foreign-born population - Cabo Verde (%)
Place of birth for the foreign-born population - Ghana (%)
Place of birth for the foreign-born population - Liberia (%)
Place of birth for the foreign-born population - Nigeria (%)
Place of birth for the foreign-born population - Senegal (%)
Place of birth for the foreign-born population - Sierra Leone (%)
Place of birth for the foreign-born population - Other Western Africa (%)
Place of birth for the foreign-born population - Australia (%)
Place of birth for the foreign-born population - New Zealand (%)
Place of birth for the foreign-born population - Fiji (%)
Place of birth for the foreign-born population - Micronesia (%)
Place of birth for the foreign-born population - Bahamas (%)
Place of birth for the foreign-born population - Barbados (%)
Place of birth for the foreign-born population - Cuba (%)
Place of birth for the foreign-born population - Dominica (%)
Place of birth for the foreign-born population - Dominican Republic (%)
Place of birth for the foreign-born population - Grenada (%)
Place of birth for the foreign-born population - Haiti (%)
Place of birth for the foreign-born population - Jamaica (%)
Place of birth for the foreign-born population - St. Vincent and the Grenadines (%)
Place of birth for the foreign-born population - Trinidad and Tobago (%)
Place of birth for the foreign-born population - West Indies (%)
Place of birth for the foreign-born population - Other Caribbean (%)
Place of birth for the foreign-born population - Belize (%)
Place of birth for the foreign-born population - Costa Rica (%)
Place of birth for the foreign-born population - El Salvador (%)
Place of birth for the foreign-born population - Guatemala (%)
Place of birth for the foreign-born population - Honduras (%)
Place of birth for the foreign-born population - Mexico (%)
Place of birth for the foreign-born population - Nicaragua (%)
Place of birth for the foreign-born population - Panama (%)
Place of birth for the foreign-born population - Other Central America (%)
Place of birth for the foreign-born population - Argentina (%)
Place of birth for the foreign-born population - Bolivia (%)
Place of birth for the foreign-born population - Brazil (%)
Place of birth for the foreign-born population - Chile (%)
Place of birth for the foreign-born population - Colombia (%)
Place of birth for the foreign-born population - Ecuador (%)
Place of birth for the foreign-born population - Guyana (%)
Place of birth for the foreign-born population - Peru (%)
Place of birth for the foreign-born population - Uruguay (%)
Place of birth for the foreign-born population - Venezuela (%)
Place of birth for the foreign-born population - Other South America (%)
Place of birth for the foreign-born population - Canada (%)
Place of birth for the foreign-born population - Other Northern America (%)
Place of birth for the foreign-born population - Other (%)
Latest news about races in Noel, MO collected exclusively by city-data.com from local newspapers, TV, and radio stations
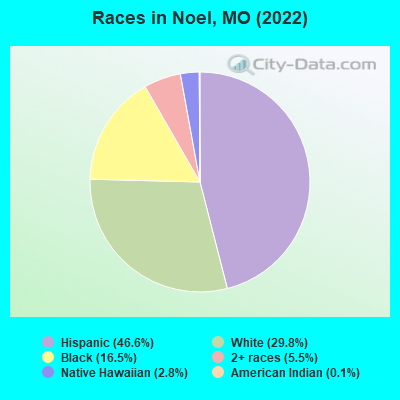
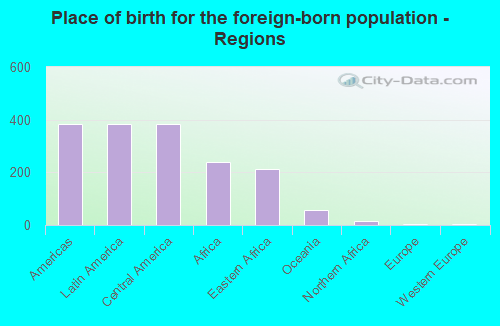
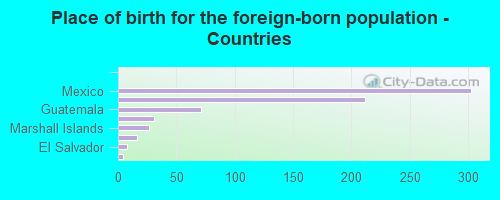
According to 2022 data, the most numerous races in Noel, MO are White alone (578 residents), Black alone (319 residents), and Two or more races (107 residents). 52.9% of Noel residents speak English at home. 35.5% of Noel, MO residents are foreign-born (20.3% born in Latin America, 12.7% born in Africa), which is 88.7% greater than the foreign-born rate of 4.0% across the entire state of Missouri.
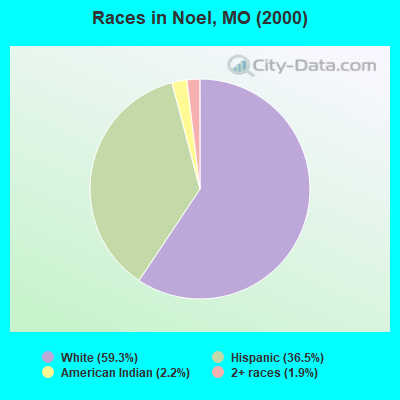
Race distribution in Noel
2000 2022
4,686,474 83.8% White alone 625,667 11.2% Black alone 118,592 2.1% Hispanic 71,905 1.3% Two or more races 61,041 1.1% Asian alone 23,302 0.4% American Indian alone 5,291 0.09% Other race alone 2,939 0.05% Native Hawaiian and Other
4,733,411 76.6% White alone 656,739 10.6% Black alone 316,300 5.1% Two or more races 291,763 4.7% Hispanic 132,436 2.1% Asian alone 27,467 0.4% Other race alone 12,313 0.2% American Indian alone 7,528 0.1% Native Hawaiian and Other
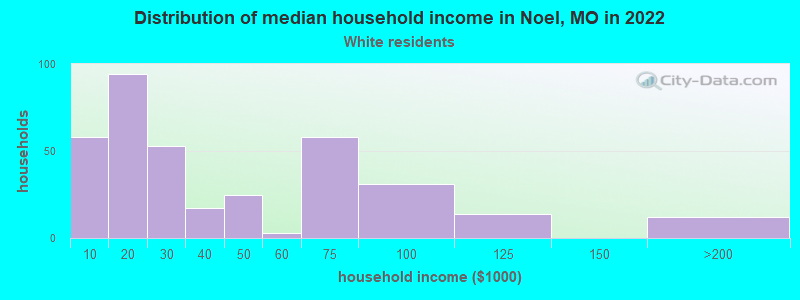
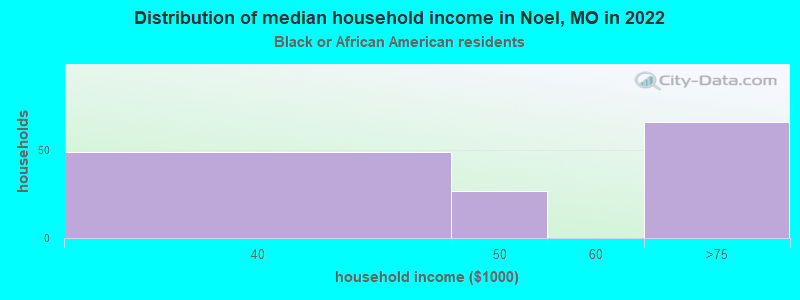
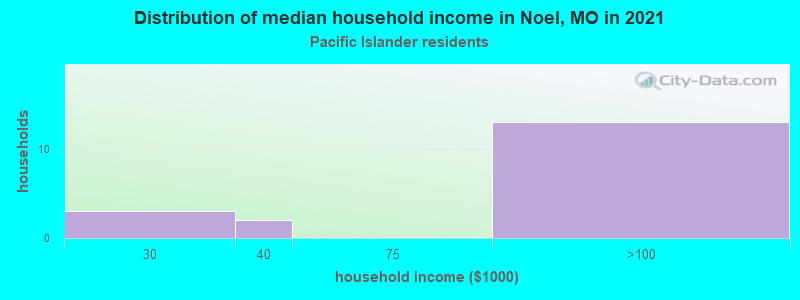
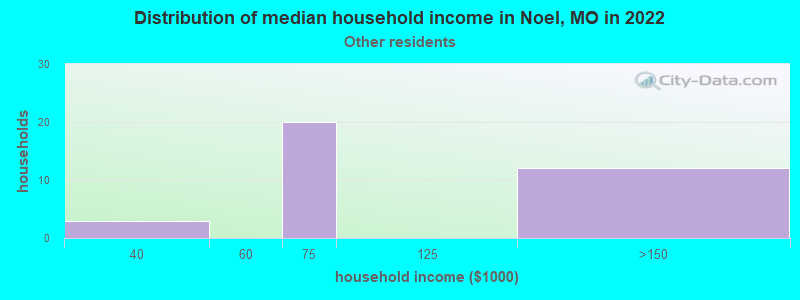
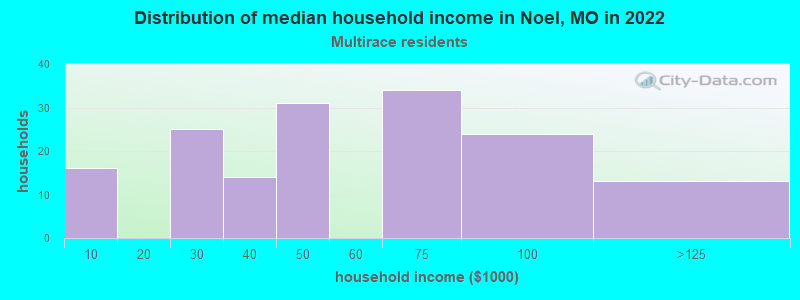
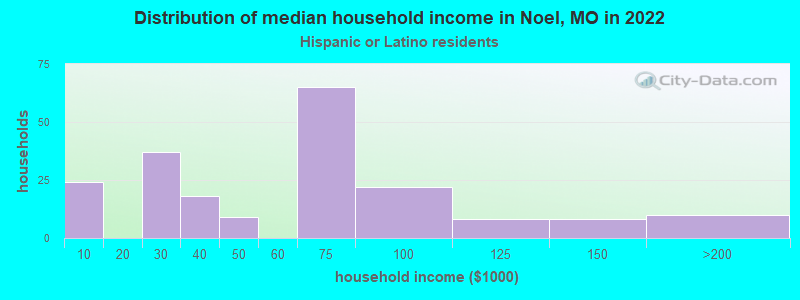
Income and house value in Noel Median household income in 2022 $22,589 White non-Hispanic householders$44,676 Black householders$49,230 Native Hawaiian and other Pacific Islander householders$71,565 Some other race householders$49,318 Two or more races householders$62,191 Hispanic or Latino race householdersMedian 2022 house value $103,610 White Non-Hispanic householders$26,235 American Indian or Alaska Native householders $142,583 Asian householders$95,055 Some other race householders$119,770 Two or more races householders$80,036 Hispanic or Latino householders
Median age by race in Noel
28.0 Median age for White residents25.3 37.9 32.5 Median age for Black or African American residents31.7 35.0 -605,424,321.4 Median age for American Indian / Alaska Native residents-652,291,104.5 -576,856,648.8 -670,509,125.2 Median age for Asian residents-676,616,914.7 -666,666,666.0 44.1 Median age for Native Hawaiian / Pacific Islander residents47.3 47.7 21.1 Median age for Other race residents21.3 18.8 30.6 Median age for Two or more races residents26.8 30.0 33.3 Median age for White alone residents27.6 48.9 20.9 Median age for Hispanic or Latino residents21.1 22.8
Owner/renter occupied households by race in Noel
House owners and renters - White residents 140 39.1% Owner occupied219 60.9% Renter occupiedHouse owners and renters - Black or African American residents 133 100.0% Renter occupiedHouse owners and renters - American Indian / Alaska Native residents 3 100.0% Owner occupiedHouse owners and renters - Native Hawaiian / Pacific Islander residents 4 14.3% Owner occupied21 85.7% Renter occupiedHouse owners and renters - Other race residents 34 100.0% Owner occupiedHouse owners and renters - Two or more races residents 89 56.2% Owner occupied69 43.8% Renter occupiedHouse owners and renters - White alone residents 88 31.2% Owner occupied193 68.8% Renter occupiedHouse owners and renters - Hispanic or Latino residents 139 68.4% Owner occupied64 31.6% Renter occupied
Language usage in Noel
English speakers - Total 52.9% of residents of Noel speak English at home.
30.8% of residents speak Spanish at home 286 50.9% Speak English very well276 49.1% Speak English less than very well16.7% of residents speak other language at home 47 15.4% Speak English very well258 84.6% Speak English less than very well
English speakers - Born in the United States 68.8% of residents of Noel speak English at home.
33.4% of residents speak Spanish at home 181 76.1% Speak English very well57 23.9% Speak English less than very well1.4% of residents speak other language at home 10 100.0% Speak English very well
English speakers - Native, born elsewhere 60.0% of residents of Noel speak English at home.
30.0% of residents speak Spanish at home 6 100.0% Speak English very well
English speakers - Foreign-born 27.3% of residents of Noel speak English at home.
35.2% of residents speak Spanish at home 33 13.6% Speak English very well209 86.4% Speak English less than very well37.5% of residents speak other language at home 22 8.5% Speak English very well236 91.5% Speak English less than very well
White (Caucasian) - Speak only English Native:
77.6% (630)Foreign-born:
54.2% (77)
White (Caucasian) - Speak another language Native:
20.0% (162)Foreign-born:
46.6% (66)
Black or African American - Speak only English Native:
62.0% (52)Foreign-born:
11.0% (23)
Black or African American - Speak another language Native:
53.7% (45)Foreign-born:
88.7% (182)
Other race - Speak another language Native:
86.4% (68)Foreign-born:
86.8% (59)
Two or more races - Speak only English Native:
46.3% (84)Foreign-born:
17.6% (52)
Two or more races - Speak another language Native:
61.8% (112)Foreign-born:
76.4% (224)
Hispanic or Latino - Speak only English Native:
34.0% (156)Foreign-born:
40.7% (162)
Hispanic or Latino - Speak another language Native:
64.0% (293)Foreign-born:
60.9% (243)
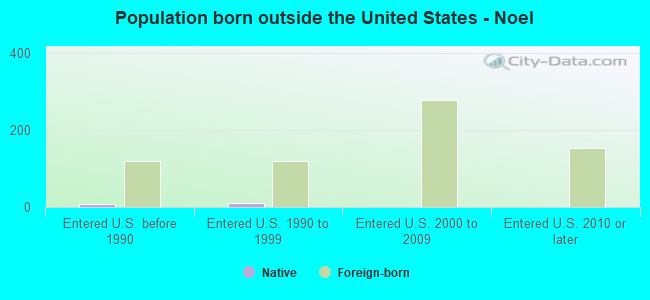
Foreign-born residents in Noel 687 residents are foreign born (20.3% Latin America , 12.7% Africa ).
This city:
35.5%Missouri:
4.2%
Marital status for residents in Noel Marital status - White (Caucasian) population 15 years and over
Males 55.0% Never married28.7% Now married0.8% Separated4.7% Widowed10.8% DivorcedFemales 39.9% Never married33.9% Now married2.9% Separated10.5% Widowed12.9% DivorcedWomen who gave birth in the past 12 months Now married:
44.0% (11)Unmarried:
56.0% (14)
Women who did not give birth in the past 12 months Now married:
29.2% (61)Unmarried:
70.8% (147)
Marital status - Black or African American population 15 years and over
Males 20.0% Never married63.0% Now married0.0% Separated17.0% Widowed0.0% DivorcedFemales 13.7% Never married86.3% Now married0.0% Separated0.0% Widowed0.0% DivorcedWomen who gave birth in the past 12 months Now married:
100.0% (11)Unmarried:
0.0% (0)
Women who did not give birth in the past 12 months Now married:
84.4% (71)Unmarried:
15.6% (13)
Marital status - Native Hawaiian / Pacific Islander population 15 years and over
Males 54.5% Never married33.3% Now married0.0% Separated0.0% Widowed12.1% DivorcedFemales 74.2% Never married25.8% Now married0.0% Separated0.0% Widowed0.0% DivorcedWomen who did not give birth in the past 12 months Now married:
0.0% (0)Unmarried:
100.0% (19)
Marital status - Other race population 15 years and over
Males 87.0% Never married13.0% Now married0.0% Separated0.0% Widowed0.0% DivorcedFemales 31.0% Never married17.2% Now married51.7% Separated0.0% Widowed0.0% DivorcedWomen who did not give birth in the past 12 months Now married:
69.0% (24)Unmarried:
31.0% (11)
Marital status - Two or more races population 15 years and over
Males 54.0% Never married36.3% Now married0.0% Separated0.0% Widowed9.7% DivorcedFemales 41.4% Never married33.1% Now married8.3% Separated11.7% Widowed5.5% DivorcedWomen who gave birth in the past 12 months Now married:
0.0% (0)Unmarried:
100.0% (12)
Women who did not give birth in the past 12 months Now married:
34.4% (43)Unmarried:
65.6% (82)
Marital status - White alone, not Hispanic / Latino population 15 years and over
Males 58.1% Never married18.5% Now married1.1% Separated6.8% Widowed15.5% DivorcedFemales 31.8% Never married33.2% Now married0.5% Separated8.2% Widowed26.4% DivorcedWomen who gave birth in the past 12 months Now married:
22.2% (4)Unmarried:
77.8% (14)
Women who did not give birth in the past 12 months Now married:
25.4% (18)Unmarried:
74.6% (52)
Marital status - Hispanic or Latino population 15 years and over
Males 54.8% Never married41.7% Now married0.0% Separated0.0% Widowed3.6% DivorcedFemales 44.4% Never married36.2% Now married9.3% Separated7.9% Widowed2.2% DivorcedWomen who gave birth in the past 12 months Now married:
43.8% (8)Unmarried:
56.2% (10)
Women who did not give birth in the past 12 months Now married:
37.7% (99)Unmarried:
62.3% (163)
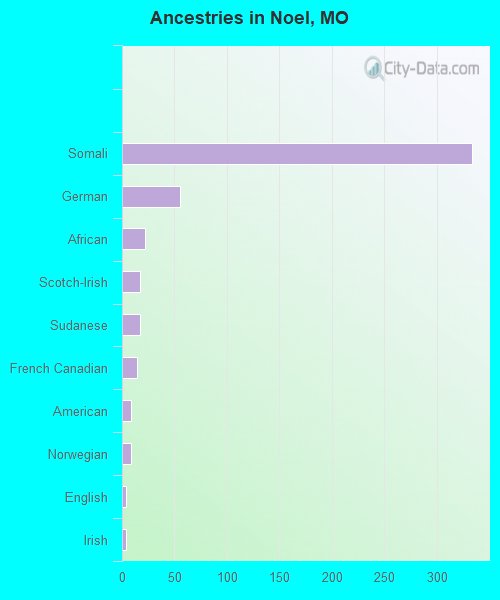
Ancestries in Noel
333 22.8% Somali55 3.8% German22 1.5% African17 1.2% Scotch-Irish17 1.2% Sudanese14 1.0% French Canadian9 0.6% American9 0.6% Norwegian4 0.3% English4 0.3% Irish3 0.2% Czech3 0.2% Polish3 0.2% Scottish
Children Nativity (place of birth) in Noel
Children under 6 years - Living with two parents Both parents native 11 100.0% NativeBoth parents foreign-born 60 100.0% NativeChildren under 6 years - Living with one parent Native parent 19 100.0% NativeForeign-born parent 50 100.0% NativeChildren 6 to 17 years - Living with two parents Both parents native 67 100.0% NativeBoth parents foreign-born 105 100.0% NativeOne native, one foreign-born parent 65 100.0% NativeChildren 6 to 17 years - Living with one parent Native parent 45 100.0% NativeForeign-born parent 97 52.6% Native87 47.4% Foreign-born
Grandparents responsible for own grandchildren in Noel
Grandparents (30 to 59 years) Two or more races 6 100.0% Not responsible for grandchildrenHispanic or Latino 5 100.0% Not responsible for grandchildren
Grandparents (60 years and over) Two or more races 25 100.0% Not responsible for grandchildren