Races in North Ridgeville, Ohio (OH) Detailed Stats
Data:
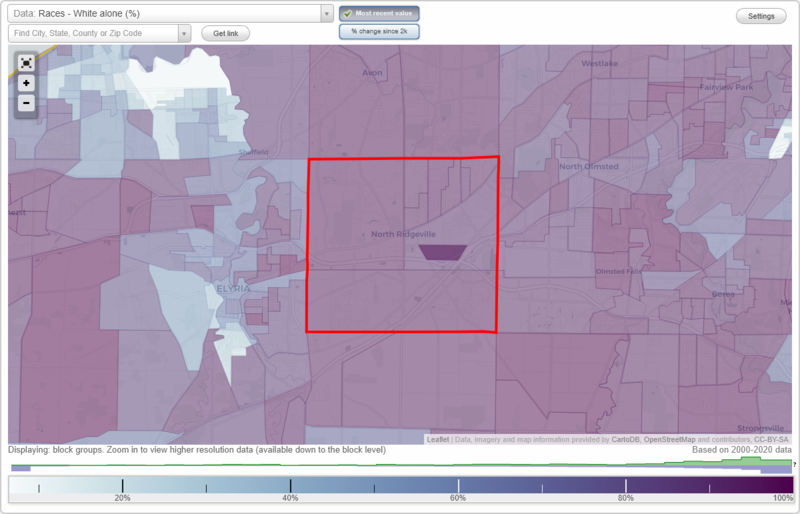
Races - White alone (%)
Races - White alone (% change since 2000)
Races - Black alone (%)
Races - Black alone (% change since 2000)
Races - American Indian alone (%)
Races - American Indian alone (% change since 2000)
Races - Asian alone (%)
Races - Asian alone (% change since 2000)
Races - Hispanic (%)
Races - Hispanic (% change since 2000)
Races - Native Hawaiian and Other Pacific Islander alone (%)
Races - Native Hawaiian and Other Pacific Islander alone (% change since 2000)
Races - Two or more races(%)
Races - Two or more races(% change since 2000)
Races - Other race alone (%)
Races - Other race alone (% change since 2000)
Racial diversity
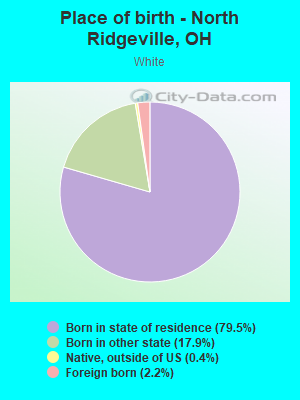
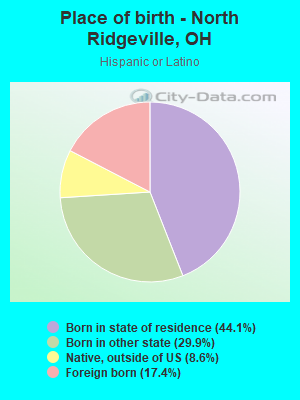
Place of birth - Born in state of residence (%)
Place of birth - Born in state of residence (%) - White
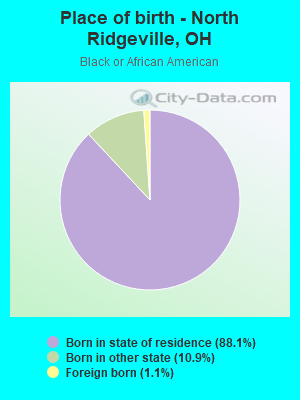
Place of birth - Born in state of residence (%) - Black or African American
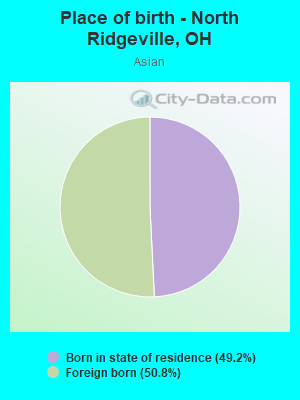
Place of birth - Born in state of residence (%) - Asian
Place of birth - Born in state of residence (%) - Hispanic or Latino
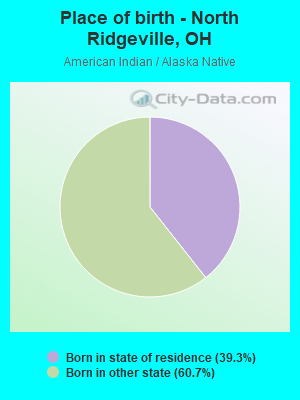
Place of birth - Born in state of residence (%) - American Indian and Alaska Native
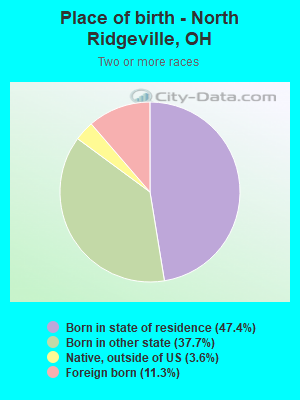
Place of birth - Born in state of residence (%) - Multirace
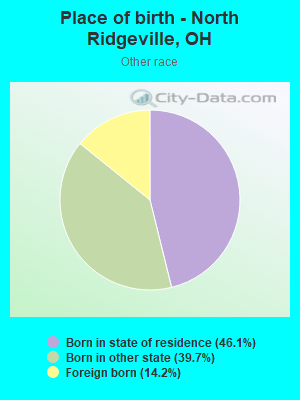
Place of birth - Born in state of residence (%) - Other Race
Place of birth - Born in other state (%)
Place of birth - Born in other state (%) - White
Place of birth - Born in other state (%) - Black or African American
Place of birth - Born in other state (%) - Asian
Place of birth - Born in other state (%) - Hispanic or Latino
Place of birth - Born in other state (%) - American Indian and Alaska Native
Place of birth - Born in other state (%) - Multirace
Place of birth - Born in other state (%) - Other Race
Place of birth - Native, outside of US (%)
Place of birth - Native, outside of US (%) - White
Place of birth - Native, outside of US (%) - Black or African American
Place of birth - Native, outside of US (%) - Asian
Place of birth - Native, outside of US (%) - Hispanic or Latino
Place of birth - Native, outside of US (%) - American Indian and Alaska Native
Place of birth - Native, outside of US (%) - Multirace
Place of birth - Native, outside of US (%) - Other Race
Place of birth - Foreign born (%)
Place of birth - Foreign born (%) - White
Place of birth - Foreign born (%) - Black or African American
Place of birth - Foreign born (%) - Asian
Place of birth - Foreign born (%) - Hispanic or Latino
Place of birth - Foreign born (%) - American Indian and Alaska Native
Place of birth - Foreign born (%) - Multirace
Place of birth - Foreign born (%) - Other Race
Residents speaking English at home (%)
Residents speaking English at home - Born in the United States (%)
Residents speaking English at home - Native, born elsewhere (%)
Residents speaking English at home - Foreign born (%)
Residents speaking Spanish at home (%)
Residents speaking Spanish at home - Born in the United States (%)
Residents speaking Spanish at home - Native, born elsewhere (%)
Residents speaking Spanish at home - Foreign born (%)
Residents speaking other language at home (%)
Residents speaking other language at home - Born in the United States (%)
Residents speaking other language at home - Native, born elsewhere (%)
Residents speaking other language at home - Foreign born (%)
Marital status - Never married (%)
Marital status - Now married (%)
Marital status - Separated (%)
Marital status - Widowed (%)
Marital status - Divorced (%)
Ancestries Reported - Arab (%)
Ancestries Reported - Czech (%)
Ancestries Reported - Danish (%)
Ancestries Reported - Dutch (%)
Ancestries Reported - English (%)
Ancestries Reported - French (%)
Ancestries Reported - French Canadian (%)
Ancestries Reported - German (%)
Ancestries Reported - Greek (%)
Ancestries Reported - Hungarian (%)
Ancestries Reported - Irish (%)
Ancestries Reported - Italian (%)
Ancestries Reported - Lithuanian (%)
Ancestries Reported - Norwegian (%)
Ancestries Reported - Polish (%)
Ancestries Reported - Portuguese (%)
Ancestries Reported - Russian (%)
Ancestries Reported - Scotch-Irish (%)
Ancestries Reported - Scottish (%)
Ancestries Reported - Slovak (%)
Ancestries Reported - Subsaharan African (%)
Ancestries Reported - Swedish (%)
Ancestries Reported - Swiss (%)
Ancestries Reported - Ukrainian (%)
Ancestries Reported - United States (%)
Ancestries Reported - Welsh (%)
Ancestries Reported - West Indian (%)
Ancestries Reported - Other (%)
Geographical mobility - Same house 1 year ago (%)
Geographical mobility - Same house 1 year ago (%) - White
Geographical mobility - Same house 1 year ago (%) - Black or African American
Geographical mobility - Same house 1 year ago (%) - Asian
Geographical mobility - Same house 1 year ago (%) - Hispanic or Latino
Geographical mobility - Same house 1 year ago (%) - American Indian and Alaska Native
Geographical mobility - Same house 1 year ago (%) - Multirace
Geographical mobility - Same house 1 year ago (%) - Other Race
Geographical mobility - Moved within same county (%)
Geographical mobility - Moved within same county (%) - White
Geographical mobility - Moved within same county (%) - Black or African American
Geographical mobility - Moved within same county (%) - Asian
Geographical mobility - Moved within same county (%) - Hispanic or Latino
Geographical mobility - Moved within same county (%) - American Indian and Alaska Native
Geographical mobility - Moved within same county (%) - Multirace
Geographical mobility - Moved within same county (%) - Other Race
Geographical mobility - Moved from different county within same state (%)
Geographical mobility - Moved from different county within same state (%) - White
Geographical mobility - Moved from different county within same state (%) - Black or African American
Geographical mobility - Moved from different county within same state (%) - Asian
Geographical mobility - Moved from different county within same state (%) - Hispanic or Latino
Geographical mobility - Moved from different county within same state (%) - American Indian and Alaska Native
Geographical mobility - Moved from different county within same state (%) - Multirace
Geographical mobility - Moved from different county within same state (%) - Other Race
Geographical mobility - Moved from different state (%)
Geographical mobility - Moved from different state (%) - White
Geographical mobility - Moved from different state (%) - Black or African American
Geographical mobility - Moved from different state (%) - Asian
Geographical mobility - Moved from different state (%) - Hispanic or Latino
Geographical mobility - Moved from different state (%) - American Indian and Alaska Native
Geographical mobility - Moved from different state (%) - Multirace
Geographical mobility - Moved from different state (%) - Other Race
Geographical mobility - Moved from abroad (%)
Geographical mobility - Moved from abroad (%) - White
Geographical mobility - Moved from abroad (%) - Black or African American
Geographical mobility - Moved from abroad (%) - Asian
Geographical mobility - Moved from abroad (%) - Hispanic or Latino
Geographical mobility - Moved from abroad (%) - American Indian and Alaska Native
Geographical mobility - Moved from abroad (%) - Multirace
Geographical mobility - Moved from abroad (%) - Other Race
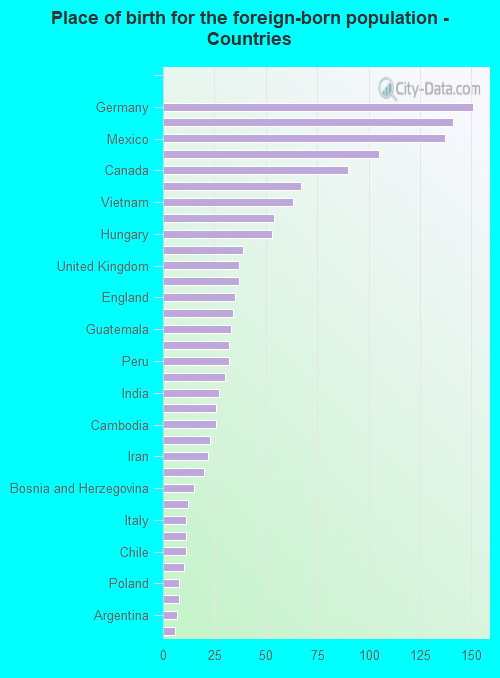
Place of birth for the foreign-born population - Ireland (%)
Place of birth for the foreign-born population - Denmark (%)
Place of birth for the foreign-born population - Norway (%)
Place of birth for the foreign-born population - Sweden (%)
Place of birth for the foreign-born population - United Kingdom (%)
Place of birth for the foreign-born population - England (%)
Place of birth for the foreign-born population - Scotland (%)
Place of birth for the foreign-born population - Other Northern Europe (%)
Place of birth for the foreign-born population - Austria (%)
Place of birth for the foreign-born population - Belgium (%)
Place of birth for the foreign-born population - France (%)
Place of birth for the foreign-born population - Germany (%)
Place of birth for the foreign-born population - Netherlands (%)
Place of birth for the foreign-born population - Switzerland (%)
Place of birth for the foreign-born population - Other Western Europe (%)
Place of birth for the foreign-born population - Greece (%)
Place of birth for the foreign-born population - Italy (%)
Place of birth for the foreign-born population - Portugal (%)
Place of birth for the foreign-born population - Spain (%)
Place of birth for the foreign-born population - Other Southern Europe (%)
Place of birth for the foreign-born population - Albania (%)
Place of birth for the foreign-born population - Belarus (%)
Place of birth for the foreign-born population - Bosnia and Herzegovina (%)
Place of birth for the foreign-born population - Bulgaria (%)
Place of birth for the foreign-born population - Croatia (%)
Place of birth for the foreign-born population - Czechoslovakia (%)
Place of birth for the foreign-born population - Hungary (%)
Place of birth for the foreign-born population - Latvia (%)
Place of birth for the foreign-born population - Lithuania (%)
Place of birth for the foreign-born population - North Macedonia (Macedonia) (%)
Place of birth for the foreign-born population - Moldova (%)
Place of birth for the foreign-born population - Poland (%)
Place of birth for the foreign-born population - Romania (%)
Place of birth for the foreign-born population - Russia (%)
Place of birth for the foreign-born population - Serbia (%)
Place of birth for the foreign-born population - Ukraine (%)
Place of birth for the foreign-born population - Other Eastern Europe (%)
Place of birth for the foreign-born population - China (%)
Place of birth for the foreign-born population - Hong Kong (%)
Place of birth for the foreign-born population - Taiwan (%)
Place of birth for the foreign-born population - Japan (%)
Place of birth for the foreign-born population - Korea (%)
Place of birth for the foreign-born population - Other Eastern Asia (%)
Place of birth for the foreign-born population - Afghanistan (%)
Place of birth for the foreign-born population - Bangladesh (%)
Place of birth for the foreign-born population - India (%)
Place of birth for the foreign-born population - Iran (%)
Place of birth for the foreign-born population - Kazakhstan (%)
Place of birth for the foreign-born population - Nepal (%)
Place of birth for the foreign-born population - Pakistan (%)
Place of birth for the foreign-born population - Sri Lanka (%)
Place of birth for the foreign-born population - Uzbekistan (%)
Place of birth for the foreign-born population - Other South Central Asia (%)
Place of birth for the foreign-born population - Burma (%)
Place of birth for the foreign-born population - Cambodia (%)
Place of birth for the foreign-born population - Indonesia (%)
Place of birth for the foreign-born population - Laos (%)
Place of birth for the foreign-born population - Malaysia (%)
Place of birth for the foreign-born population - Philippines (%)
Place of birth for the foreign-born population - Singapore (%)
Place of birth for the foreign-born population - Thailand (%)
Place of birth for the foreign-born population - Vietnam (%)
Place of birth for the foreign-born population - Other South Eastern Asia (%)
Place of birth for the foreign-born population - Armenia (%)
Place of birth for the foreign-born population - Iraq (%)
Place of birth for the foreign-born population - Israel (%)
Place of birth for the foreign-born population - Jordan (%)
Place of birth for the foreign-born population - Kuwait (%)
Place of birth for the foreign-born population - Lebanon (%)
Place of birth for the foreign-born population - Saudi Arabia (%)
Place of birth for the foreign-born population - Syria (%)
Place of birth for the foreign-born population - Turkey (%)
Place of birth for the foreign-born population - Yemen (%)
Place of birth for the foreign-born population - Other Western Asia (%)
Place of birth for the foreign-born population - Eritrea (%)
Place of birth for the foreign-born population - Ethiopia (%)
Place of birth for the foreign-born population - Kenya (%)
Place of birth for the foreign-born population - Somalia (%)
Place of birth for the foreign-born population - Uganda (%)
Place of birth for the foreign-born population - Zimbabwe (%)
Place of birth for the foreign-born population - Other Eastern Africa (%)
Place of birth for the foreign-born population - Cameroon (%)
Place of birth for the foreign-born population - Congo (%)
Place of birth for the foreign-born population - Democratic Republic of Congo (Zaire) (%)
Place of birth for the foreign-born population - Other Middle Africa (%)
Place of birth for the foreign-born population - Egypt (%)
Place of birth for the foreign-born population - Morocco (%)
Place of birth for the foreign-born population - Sudan (%)
Place of birth for the foreign-born population - Other Northern Africa (%)
Place of birth for the foreign-born population - South Africa (%)
Place of birth for the foreign-born population - Other Southern Africa (%)
Place of birth for the foreign-born population - Cabo Verde (%)
Place of birth for the foreign-born population - Ghana (%)
Place of birth for the foreign-born population - Liberia (%)
Place of birth for the foreign-born population - Nigeria (%)
Place of birth for the foreign-born population - Senegal (%)
Place of birth for the foreign-born population - Sierra Leone (%)
Place of birth for the foreign-born population - Other Western Africa (%)
Place of birth for the foreign-born population - Australia (%)
Place of birth for the foreign-born population - New Zealand (%)
Place of birth for the foreign-born population - Fiji (%)
Place of birth for the foreign-born population - Micronesia (%)
Place of birth for the foreign-born population - Bahamas (%)
Place of birth for the foreign-born population - Barbados (%)
Place of birth for the foreign-born population - Cuba (%)
Place of birth for the foreign-born population - Dominica (%)
Place of birth for the foreign-born population - Dominican Republic (%)
Place of birth for the foreign-born population - Grenada (%)
Place of birth for the foreign-born population - Haiti (%)
Place of birth for the foreign-born population - Jamaica (%)
Place of birth for the foreign-born population - St. Vincent and the Grenadines (%)
Place of birth for the foreign-born population - Trinidad and Tobago (%)
Place of birth for the foreign-born population - West Indies (%)
Place of birth for the foreign-born population - Other Caribbean (%)
Place of birth for the foreign-born population - Belize (%)
Place of birth for the foreign-born population - Costa Rica (%)
Place of birth for the foreign-born population - El Salvador (%)
Place of birth for the foreign-born population - Guatemala (%)
Place of birth for the foreign-born population - Honduras (%)
Place of birth for the foreign-born population - Mexico (%)
Place of birth for the foreign-born population - Nicaragua (%)
Place of birth for the foreign-born population - Panama (%)
Place of birth for the foreign-born population - Other Central America (%)
Place of birth for the foreign-born population - Argentina (%)
Place of birth for the foreign-born population - Bolivia (%)
Place of birth for the foreign-born population - Brazil (%)
Place of birth for the foreign-born population - Chile (%)
Place of birth for the foreign-born population - Colombia (%)
Place of birth for the foreign-born population - Ecuador (%)
Place of birth for the foreign-born population - Guyana (%)
Place of birth for the foreign-born population - Peru (%)
Place of birth for the foreign-born population - Uruguay (%)
Place of birth for the foreign-born population - Venezuela (%)
Place of birth for the foreign-born population - Other South America (%)
Place of birth for the foreign-born population - Canada (%)
Place of birth for the foreign-born population - Other Northern America (%)
Place of birth for the foreign-born population - Other (%)
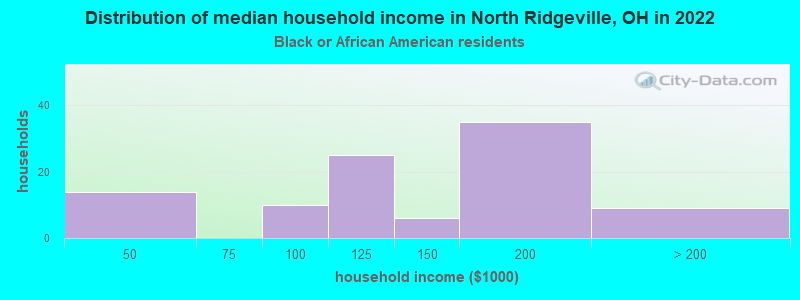
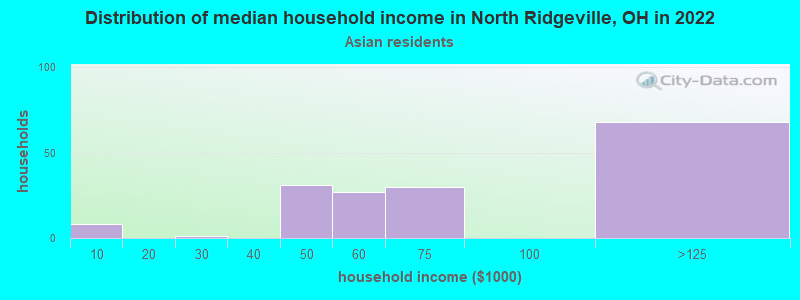
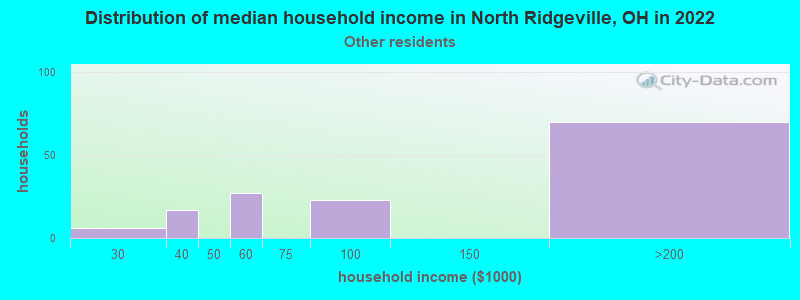
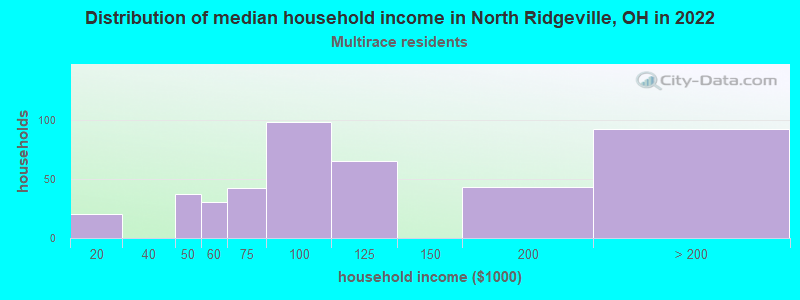
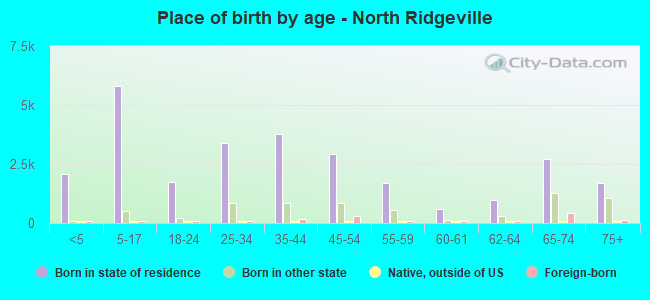
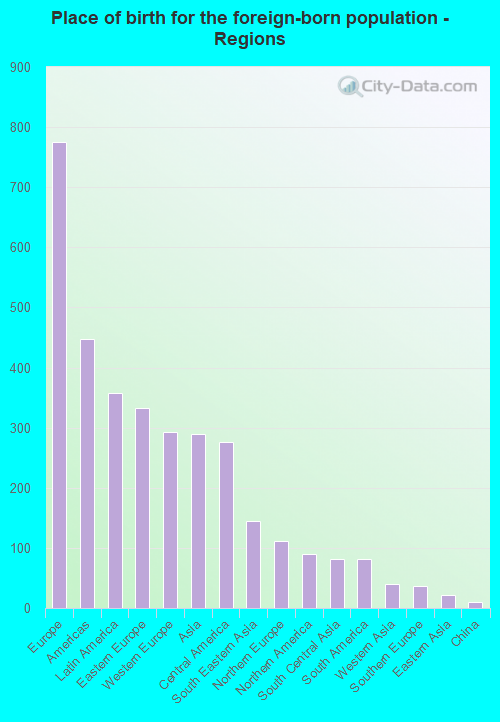
According to 2022 data, the most numerous races in North Ridgeville, OH are White alone (31,111 residents), Black alone (537 residents), and Two or more races (1,002 residents). 94.1% of North Ridgeville residents speak English at home. 4.2% of North Ridgeville, OH residents are foreign-born (2.1% born in Europe, 1.0% born in Latin America, 0.8% born in Asia), which is 5.6% greater than the foreign-born rate of 4.0% across the entire state of Ohio.
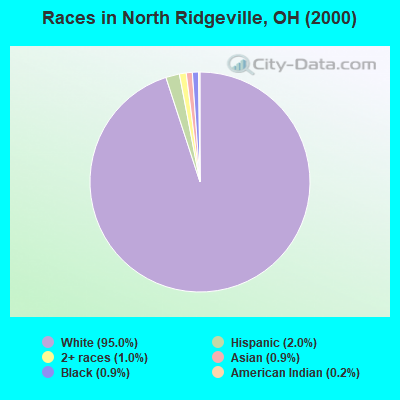
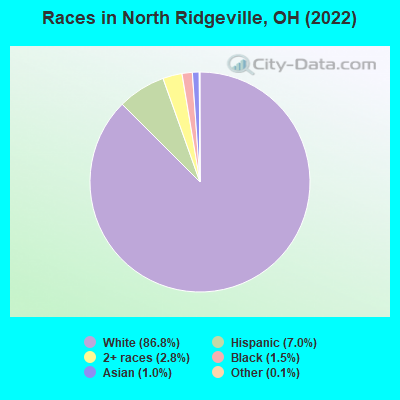
Race distribution in North Ridgeville
2000 2022
9,538,111 84.0% White alone 1,290,662 11.4% Black alone 217,123 1.9% Hispanic 137,770 1.2% Two or more races 131,670 1.2% Asian alone 21,985 0.2% American Indian alone 13,483 0.1% Other race alone 2,336 0.02% Native Hawaiian and Other
8,948,793 76.1% White alone 1,401,403 11.9% Black alone 529,291 4.5% Two or more races 517,232 4.4% Hispanic 293,387 2.5% Asian alone 52,805 0.4% Other race alone 9,785 0.08% American Indian alone 3,362 0.03% Native Hawaiian and Other
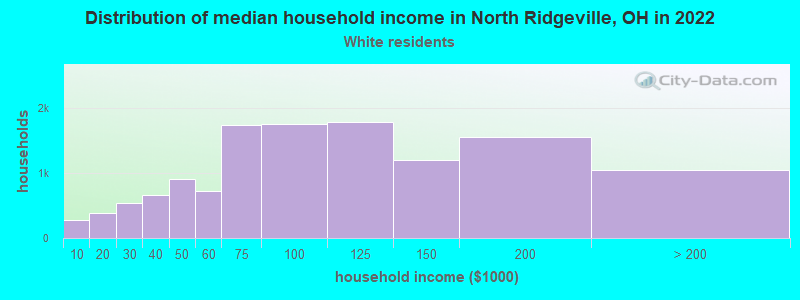
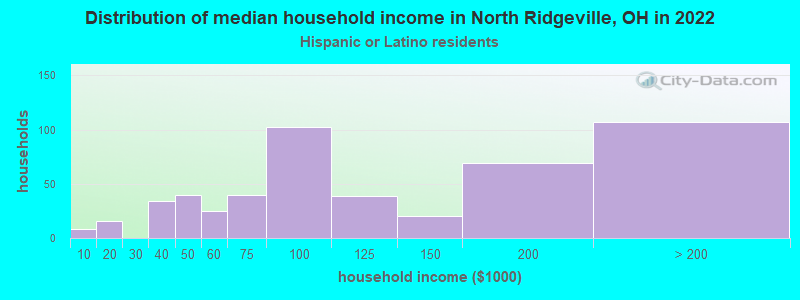
Income and house value in North Ridgeville Median household income in 2022 $87,240 White non-Hispanic householders$101,676 Black householders$93,174 Two or more races householders$90,186 Hispanic or Latino race householdersMedian 2022 house value $254,216 White Non-Hispanic householders$310,360 Black or African American householders$441,689 American Indian or Alaska Native householders $251,861 Asian householders$166,860 Some other race householders$264,032 Two or more races householders$205,532 Hispanic or Latino householders
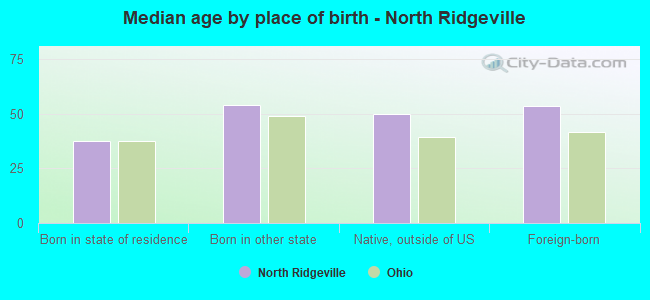
Median age by race in North Ridgeville
42.5 Median age for White residents40.7 44.1 36.7 Median age for Black or African American residents34.9 41.7 -730,225,988.0 Median age for American Indian / Alaska Native residents-735,686,273.8 -708,672,086.0 66.4 Median age for Asian residents68.4 39.9 -666,666,666.0 Median age for Native Hawaiian / Pacific Islander residents-666,666,666.0 -666,666,666.0 49.4 Median age for Other race residents48.6 51.5 31.5 Median age for Two or more races residents32.3 32.9 42.5 Median age for White alone residents41.3 44.3 27.3 Median age for Hispanic or Latino residents30.8 17.1
Owner/renter occupied households by race in North Ridgeville
House owners and renters - White residents 11,539 90.2% Owner occupied1,261 9.8% Renter occupiedHouse owners and renters - Black or African American residents 112 100.0% Owner occupiedHouse owners and renters - American Indian / Alaska Native residents 7 100.0% Owner occupiedHouse owners and renters - Asian residents 259 100.0% Owner occupiedHouse owners and renters - Native Hawaiian / Pacific Islander residents 12 100.0% Owner occupiedHouse owners and renters - Other race residents 56 100.0% Owner occupiedHouse owners and renters - Two or more races residents 507 92.2% Owner occupied43 7.8% Renter occupiedHouse owners and renters - White alone residents 11,482 89.8% Owner occupied1,301 10.2% Renter occupiedHouse owners and renters - Hispanic or Latino residents 475 89.7% Owner occupied54 10.3% Renter occupied
Language usage in North Ridgeville
English speakers - Total 94.1% of residents of North Ridgeville speak English at home.
3.4% of residents speak Spanish at home 863 75.3% Speak English very well283 24.7% Speak English less than very well2.2% of residents speak other language at home 656 89.6% Speak English very well76 10.4% Speak English less than very well
English speakers - Born in the United States 90.2% of residents of North Ridgeville speak English at home.
12.2% of residents speak Spanish at home 804 97.9% Speak English very well17 2.1% Speak English less than very well0.5% of residents speak other language at home 35 100.0% Speak English very well
English speakers - Native, born elsewhere 30.4% of residents of North Ridgeville speak English at home.
45.4% of residents speak Spanish at home 123 88.5% Speak English very well16 11.5% Speak English less than very well9.2% of residents speak other language at home 20 71.4% Speak English very well8 28.6% Speak English less than very well
English speakers - Foreign-born 18.8% of residents of North Ridgeville speak English at home.
29.3% of residents speak Spanish at home 259 64.4% Speak English very well143 35.6% Speak English less than very well42.5% of residents speak other language at home 510 87.6% Speak English very well72 12.4% Speak English less than very well
White (Caucasian) - Speak only English Native:
99.8% (28,642)Foreign-born:
77.0% (524)
White (Caucasian) - Speak another language Native:
0.8% (225)Foreign-born:
66.7% (454)
Black or African American - Speak only English Native:
97.2% (509)Foreign-born:
100.0% (6)
Asian - Speak only English Native:
27.3% (46)Foreign-born:
15.9% (32)
Asian - Speak another language Native:
75.6% (128)Foreign-born:
79.7% (159)
Other race - Speak another language Native:
30.7% (98)Foreign-born:
100.0% (55)
Two or more races - Speak only English Native:
77.4% (1,613)Foreign-born:
2.5% (8)
Two or more races - Speak another language Native:
22.5% (468)Foreign-born:
100.0% (319)
White alone - Speak only English Native:
100.0% (28,495)Foreign-born:
83.4% (532)
White alone - Speak another language Native:
0.2% (53)Foreign-born:
62.8% (401)
Hispanic or Latino - Speak only English Native:
61.8% (1,234)Foreign-born:
3.7% (17)
Hispanic or Latino - Speak another language Native:
37.8% (755)Foreign-born:
100.0% (454)
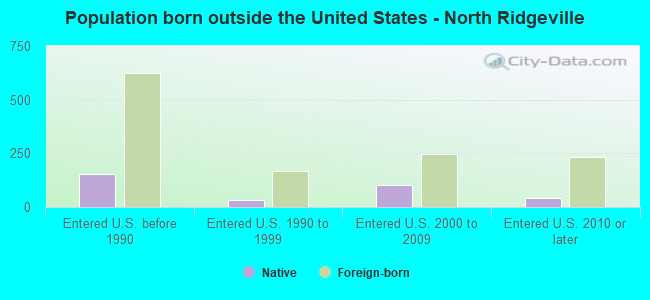
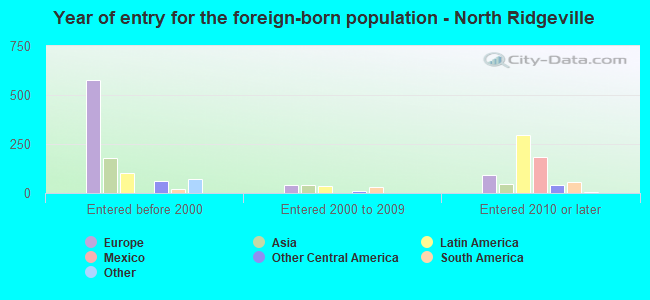
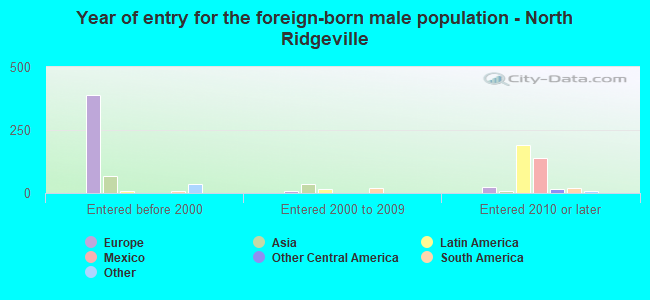
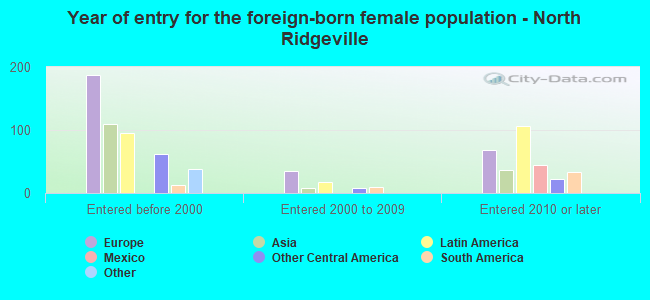
Foreign-born residents in North Ridgeville 1,519 residents are foreign born (2.1% Europe , 1.0% Latin America , 0.8% Asia ).
Marital status for residents in North Ridgeville Marital status - White (Caucasian) population 15 years and over
Males 27.9% Never married57.4% Now married0.6% Separated3.9% Widowed10.2% DivorcedFemales 22.0% Never married56.4% Now married1.0% Separated9.1% Widowed11.5% DivorcedWomen who gave birth in the past 12 months Now married:
59.2% (173)Unmarried:
40.8% (119)
Women who did not give birth in the past 12 months Now married:
55.3% (3,125)Unmarried:
44.7% (2,523)
Marital status - Black or African American population 15 years and over
Males 52.4% Never married45.9% Now married0.0% Separated1.7% Widowed0.0% DivorcedFemales 0.0% Never married62.6% Now married0.0% Separated3.3% Widowed34.1% DivorcedWomen who gave birth in the past 12 months Now married:
100.0% (11)Unmarried:
0.0% (0)
Women who did not give birth in the past 12 months Now married:
100.0% (63)Unmarried:
0.0% (0)
Marital status - American Indian / Alaska Native population 15 years and over
Males 0.0% Never married100.0% Now married0.0% Separated0.0% Widowed0.0% DivorcedFemales 0.0% Never married100.0% Now married0.0% Separated0.0% Widowed0.0% DivorcedMarital status - Asian population 15 years and over
Males 6.3% Never married93.7% Now married0.0% Separated0.0% Widowed0.0% DivorcedFemales 0.0% Never married92.2% Now married0.0% Separated0.0% Widowed7.8% DivorcedWomen who did not give birth in the past 12 months Now married:
94.2% (130)Unmarried:
5.8% (8)
Marital status - Other race population 15 years and over
Males 33.9% Never married48.8% Now married0.0% Separated0.0% Widowed17.3% DivorcedFemales 30.4% Never married64.0% Now married0.0% Separated5.6% Widowed0.0% DivorcedWomen who did not give birth in the past 12 months Now married:
63.5% (87)Unmarried:
36.5% (50)
Marital status - Two or more races population 15 years and over
Males 55.7% Never married30.7% Now married0.0% Separated0.0% Widowed13.5% DivorcedFemales 22.4% Never married67.4% Now married7.3% Separated1.4% Widowed1.4% DivorcedWomen who gave birth in the past 12 months Now married:
100.0% (3)Unmarried:
0.0% (0)
Women who did not give birth in the past 12 months Now married:
71.7% (552)Unmarried:
28.3% (218)
Marital status - White alone, not Hispanic / Latino population 15 years and over
Males 26.6% Never married58.2% Now married0.5% Separated4.1% Widowed10.5% DivorcedFemales 21.5% Never married57.0% Now married0.9% Separated9.2% Widowed11.5% DivorcedWomen who gave birth in the past 12 months Now married:
59.2% (180)Unmarried:
40.8% (124)
Women who did not give birth in the past 12 months Now married:
56.6% (3,236)Unmarried:
43.4% (2,481)
Marital status - Hispanic or Latino population 15 years and over
Males 59.6% Never married32.4% Now married0.9% Separated0.0% Widowed7.1% DivorcedFemales 30.1% Never married55.7% Now married8.1% Separated2.3% Widowed3.9% DivorcedWomen who did not give birth in the past 12 months Now married:
56.0% (305)Unmarried:
44.0% (240)
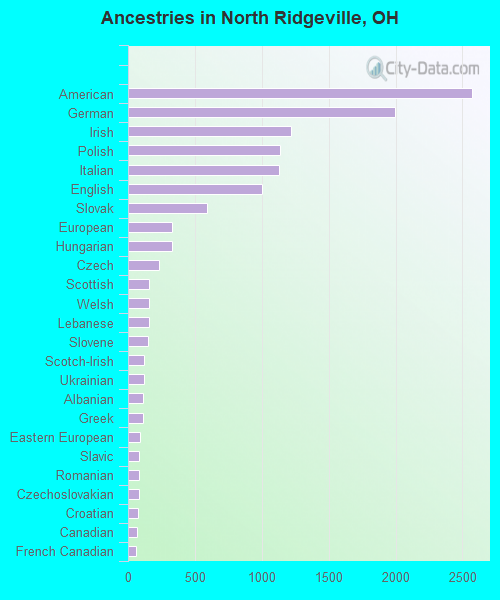
Ancestries in North Ridgeville
2,570 17.6% American1,993 13.6% German1,220 8.3% Irish1,135 7.8% Polish1,131 7.7% Italian1,004 6.9% English594 4.1% Slovak331 2.3% European330 2.3% Hungarian231 1.6% Czech159 1.1% Scottish158 1.1% Welsh157 1.1% Lebanese149 1.0% Slovene119 0.8% Scotch-Irish116 0.8% Ukrainian110 0.8% Albanian109 0.7% Greek89 0.6% Eastern European85 0.6% Slavic79 0.5% Romanian79 0.5% Czechoslovakian72 0.5% Croatian66 0.5% Canadian57 0.4% French Canadian43 0.3% Armenian40 0.3% Swiss38 0.3% Norwegian36 0.2% French34 0.2% Macedonian33 0.2% Dutch32 0.2% African25 0.2% British24 0.2% Portuguese20 0.1% Russian20 0.1% Swedish13 0.09% Finnish12 0.08% Australian11 0.08% Lithuanian10 0.07% Danish10 0.07% Carpatho Rusyn10 0.07% Yugoslavian8 0.05% Pennsylvania German5 0.03% Palestinian5 0.03% Northern European4 0.03% Austrian
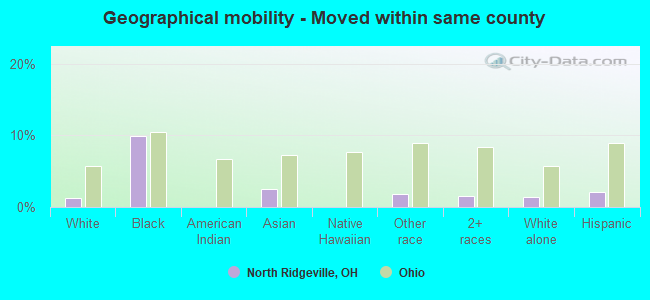
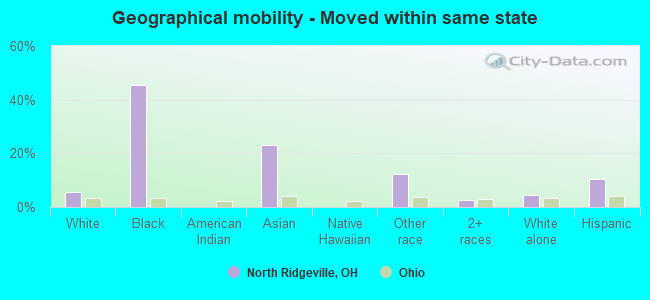
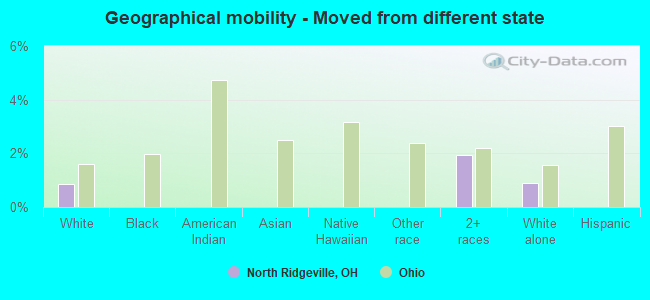
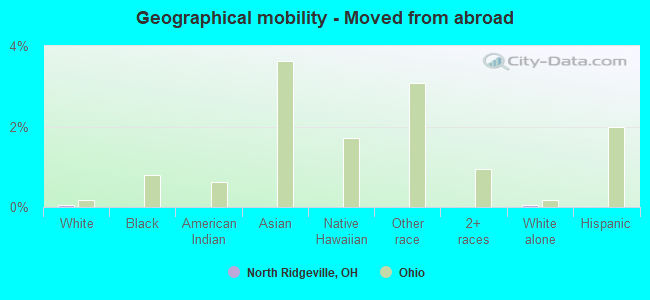
Geographical mobility in North Ridgeville Same house 1 year ago 29,098 93.9% White (Caucasian)336 60.1% Black or African American17 100.0% American Indian / Alaska Native244 78.2% Asian13 100.0% Native Hawaiian / Pacific Islander413 87.5% Other race2,443 93.6% Two or more races28,937 94.2% White alone, not Hispanic / Latino2,259 90.1% Hispanic or LatinoMoved within same county 396 1.3% White / Caucasian56 10.0% Black or African American8 2.5% Asian9 1.9% Other race41 1.6% Two or more races419 1.4% White alone, not Hispanic / Latino51 2.0% Hispanic or LatinoMoved within same state 1,689 5.5% White / Caucasian255 45.6% Black or African American72 22.9% Asian57 12.1% Other race68 2.6% Two or more races1,410 4.6% White alone, not Hispanic / Latino258 10.3% Hispanic or LatinoMoved from different state 264 0.9% White / Caucasian51 2.0% Two or more races276 0.9% White alone, not Hispanic / LatinoMoved from abroad 14 0.0% White14 0.0% White alone, not Hispanic / Latino
Children Nativity (place of birth) in North Ridgeville
Children under 6 years - Living with two parents Both parents native 2,070 100.0% NativeBoth parents foreign-born 6 100.0% NativeOne native, one foreign-born parent 55 88.6% Native7 11.4% Foreign-bornChildren under 6 years - Living with one parent Native parent 476 100.0% NativeForeign-born parent 6 100.0% NativeChildren 6 to 17 years - Living with two parents Both parents native 3,239 100.0% NativeBoth parents foreign-born 67 65.9% Native35 34.1% Foreign-bornOne native, one foreign-born parent 137 100.0% NativeChildren 6 to 17 years - Living with one parent Native parent 2,013 100.0% NativeForeign-born parent 120 50.4% Native118 49.6% Foreign-born
Grandparents responsible for own grandchildren in North Ridgeville
Grandparents (30 to 59 years) White / Caucasian 94 79.0% Responsible for grandchildren25 21.0% Not responsible for grandchildrenTwo or more races 19 100.0% Responsible for grandchildrenWhite alone, not Hispanic / Latino 98 78.5% Responsible for grandchildren27 21.5% Not responsible for grandchildrenGrandparents (60 years and over) White / Caucasian 27 17.3% Responsible for grandchildren131 82.7% Not responsible for grandchildrenTwo or more races 56 100.0% Not responsible for grandchildrenWhite alone, not Hispanic / Latino 26 16.7% Responsible for grandchildren132 83.3% Not responsible for grandchildren