Races in Oklahoma City, Oklahoma (OK) Detailed Stats
Data:
Races - White alone (%)
Races - White alone (% change since 2000)
Races - Black alone (%)
Races - Black alone (% change since 2000)
Races - American Indian alone (%)
Races - American Indian alone (% change since 2000)
Races - Asian alone (%)
Races - Asian alone (% change since 2000)
Races - Hispanic (%)
Races - Hispanic (% change since 2000)
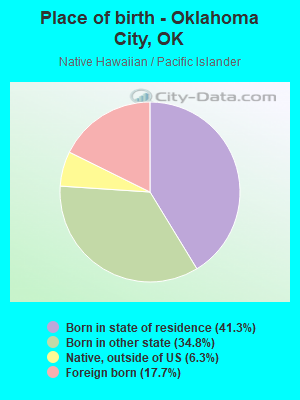
Races - Native Hawaiian and Other Pacific Islander alone (%)
Races - Native Hawaiian and Other Pacific Islander alone (% change since 2000)
Races - Two or more races(%)
Races - Two or more races(% change since 2000)
Races - Other race alone (%)
Races - Other race alone (% change since 2000)
Racial diversity
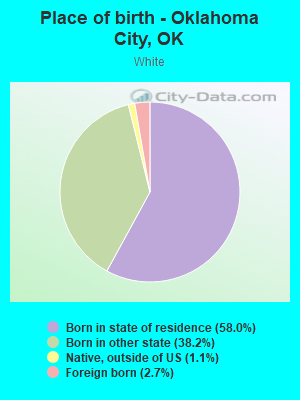
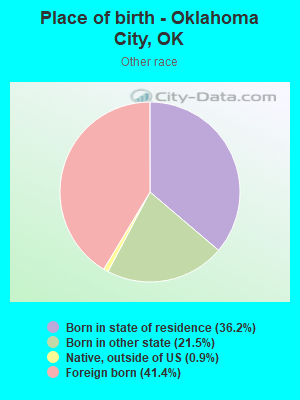
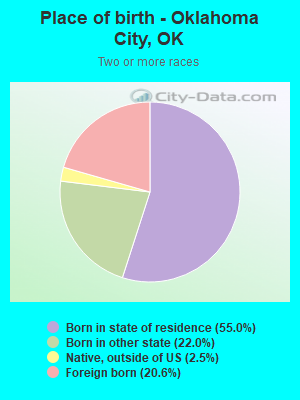
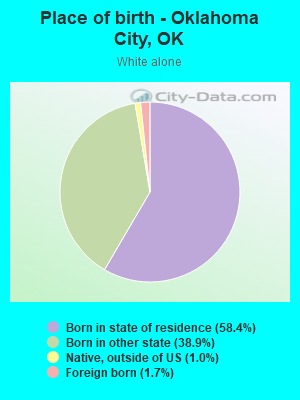
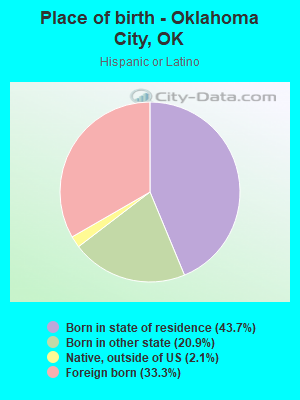
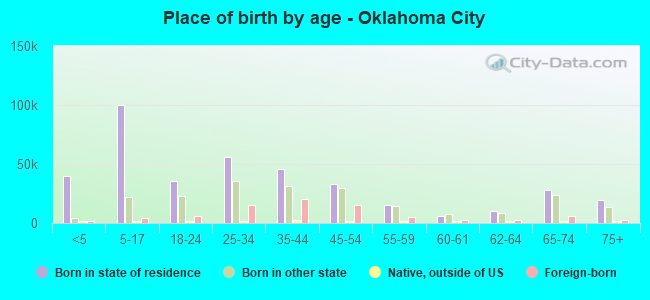
Place of birth - Born in state of residence (%)
Place of birth - Born in state of residence (%) - White
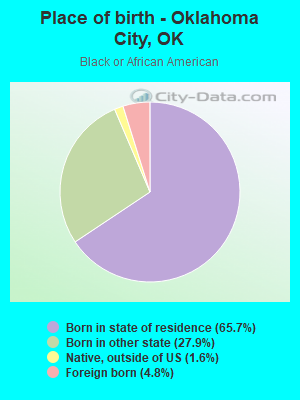
Place of birth - Born in state of residence (%) - Black or African American
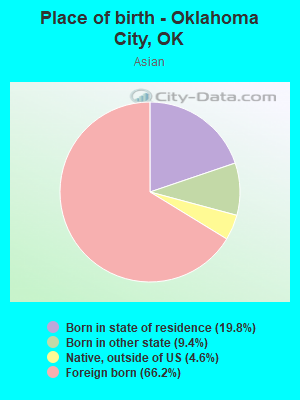
Place of birth - Born in state of residence (%) - Asian
Place of birth - Born in state of residence (%) - Hispanic or Latino
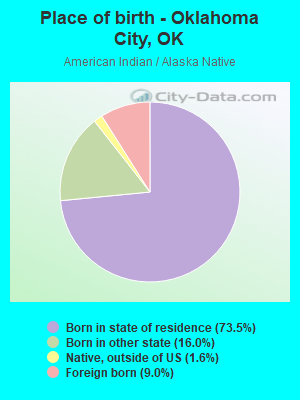
Place of birth - Born in state of residence (%) - American Indian and Alaska Native
Place of birth - Born in state of residence (%) - Multirace
Place of birth - Born in state of residence (%) - Other Race
Place of birth - Born in other state (%)
Place of birth - Born in other state (%) - White
Place of birth - Born in other state (%) - Black or African American
Place of birth - Born in other state (%) - Asian
Place of birth - Born in other state (%) - Hispanic or Latino
Place of birth - Born in other state (%) - American Indian and Alaska Native
Place of birth - Born in other state (%) - Multirace
Place of birth - Born in other state (%) - Other Race
Place of birth - Native, outside of US (%)
Place of birth - Native, outside of US (%) - White
Place of birth - Native, outside of US (%) - Black or African American
Place of birth - Native, outside of US (%) - Asian
Place of birth - Native, outside of US (%) - Hispanic or Latino
Place of birth - Native, outside of US (%) - American Indian and Alaska Native
Place of birth - Native, outside of US (%) - Multirace
Place of birth - Native, outside of US (%) - Other Race
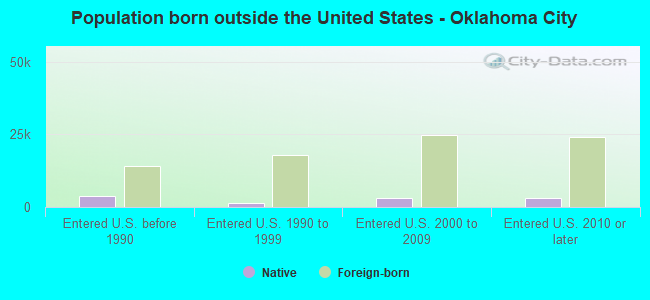
Place of birth - Foreign born (%)
Place of birth - Foreign born (%) - White
Place of birth - Foreign born (%) - Black or African American
Place of birth - Foreign born (%) - Asian
Place of birth - Foreign born (%) - Hispanic or Latino
Place of birth - Foreign born (%) - American Indian and Alaska Native
Place of birth - Foreign born (%) - Multirace
Place of birth - Foreign born (%) - Other Race
Residents speaking English at home (%)
Residents speaking English at home - Born in the United States (%)
Residents speaking English at home - Native, born elsewhere (%)
Residents speaking English at home - Foreign born (%)
Residents speaking Spanish at home (%)
Residents speaking Spanish at home - Born in the United States (%)
Residents speaking Spanish at home - Native, born elsewhere (%)
Residents speaking Spanish at home - Foreign born (%)
Residents speaking other language at home (%)
Residents speaking other language at home - Born in the United States (%)
Residents speaking other language at home - Native, born elsewhere (%)
Residents speaking other language at home - Foreign born (%)
Marital status - Never married (%)
Marital status - Now married (%)
Marital status - Separated (%)
Marital status - Widowed (%)
Marital status - Divorced (%)
Ancestries Reported - Arab (%)
Ancestries Reported - Czech (%)
Ancestries Reported - Danish (%)
Ancestries Reported - Dutch (%)
Ancestries Reported - English (%)
Ancestries Reported - French (%)
Ancestries Reported - French Canadian (%)
Ancestries Reported - German (%)
Ancestries Reported - Greek (%)
Ancestries Reported - Hungarian (%)
Ancestries Reported - Irish (%)
Ancestries Reported - Italian (%)
Ancestries Reported - Lithuanian (%)
Ancestries Reported - Norwegian (%)
Ancestries Reported - Polish (%)
Ancestries Reported - Portuguese (%)
Ancestries Reported - Russian (%)
Ancestries Reported - Scotch-Irish (%)
Ancestries Reported - Scottish (%)
Ancestries Reported - Slovak (%)
Ancestries Reported - Subsaharan African (%)
Ancestries Reported - Swedish (%)
Ancestries Reported - Swiss (%)
Ancestries Reported - Ukrainian (%)
Ancestries Reported - United States (%)
Ancestries Reported - Welsh (%)
Ancestries Reported - West Indian (%)
Ancestries Reported - Other (%)
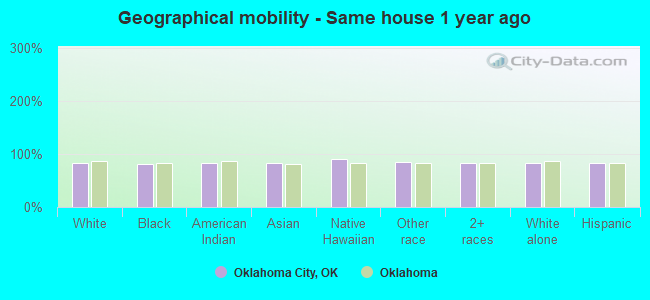
Geographical mobility - Same house 1 year ago (%)
Geographical mobility - Same house 1 year ago (%) - White
Geographical mobility - Same house 1 year ago (%) - Black or African American
Geographical mobility - Same house 1 year ago (%) - Asian
Geographical mobility - Same house 1 year ago (%) - Hispanic or Latino
Geographical mobility - Same house 1 year ago (%) - American Indian and Alaska Native
Geographical mobility - Same house 1 year ago (%) - Multirace
Geographical mobility - Same house 1 year ago (%) - Other Race
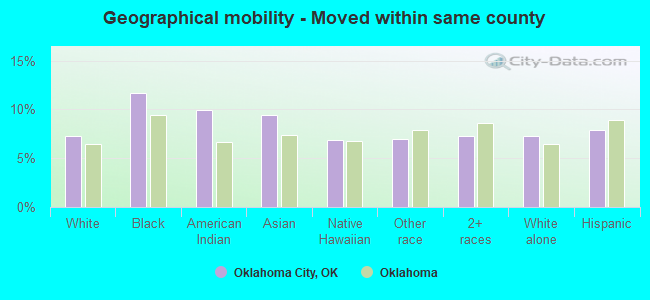
Geographical mobility - Moved within same county (%)
Geographical mobility - Moved within same county (%) - White
Geographical mobility - Moved within same county (%) - Black or African American
Geographical mobility - Moved within same county (%) - Asian
Geographical mobility - Moved within same county (%) - Hispanic or Latino
Geographical mobility - Moved within same county (%) - American Indian and Alaska Native
Geographical mobility - Moved within same county (%) - Multirace
Geographical mobility - Moved within same county (%) - Other Race
Geographical mobility - Moved from different county within same state (%)
Geographical mobility - Moved from different county within same state (%) - White
Geographical mobility - Moved from different county within same state (%) - Black or African American
Geographical mobility - Moved from different county within same state (%) - Asian
Geographical mobility - Moved from different county within same state (%) - Hispanic or Latino
Geographical mobility - Moved from different county within same state (%) - American Indian and Alaska Native
Geographical mobility - Moved from different county within same state (%) - Multirace
Geographical mobility - Moved from different county within same state (%) - Other Race
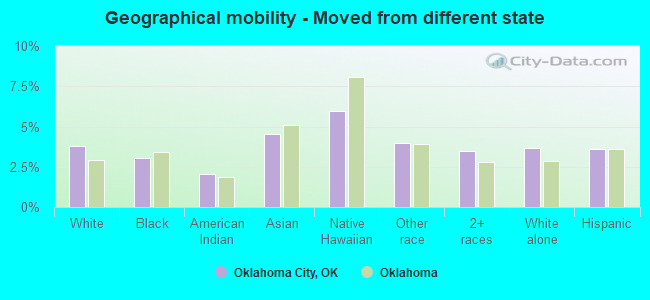
Geographical mobility - Moved from different state (%)
Geographical mobility - Moved from different state (%) - White
Geographical mobility - Moved from different state (%) - Black or African American
Geographical mobility - Moved from different state (%) - Asian
Geographical mobility - Moved from different state (%) - Hispanic or Latino
Geographical mobility - Moved from different state (%) - American Indian and Alaska Native
Geographical mobility - Moved from different state (%) - Multirace
Geographical mobility - Moved from different state (%) - Other Race
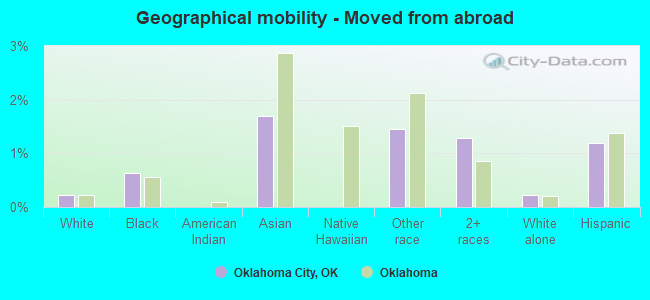
Geographical mobility - Moved from abroad (%)
Geographical mobility - Moved from abroad (%) - White
Geographical mobility - Moved from abroad (%) - Black or African American
Geographical mobility - Moved from abroad (%) - Asian
Geographical mobility - Moved from abroad (%) - Hispanic or Latino
Geographical mobility - Moved from abroad (%) - American Indian and Alaska Native
Geographical mobility - Moved from abroad (%) - Multirace
Geographical mobility - Moved from abroad (%) - Other Race
Place of birth for the foreign-born population - Ireland (%)
Place of birth for the foreign-born population - Denmark (%)
Place of birth for the foreign-born population - Norway (%)
Place of birth for the foreign-born population - Sweden (%)
Place of birth for the foreign-born population - United Kingdom (%)
Place of birth for the foreign-born population - England (%)
Place of birth for the foreign-born population - Scotland (%)
Place of birth for the foreign-born population - Other Northern Europe (%)
Place of birth for the foreign-born population - Austria (%)
Place of birth for the foreign-born population - Belgium (%)
Place of birth for the foreign-born population - France (%)
Place of birth for the foreign-born population - Germany (%)
Place of birth for the foreign-born population - Netherlands (%)
Place of birth for the foreign-born population - Switzerland (%)
Place of birth for the foreign-born population - Other Western Europe (%)
Place of birth for the foreign-born population - Greece (%)
Place of birth for the foreign-born population - Italy (%)
Place of birth for the foreign-born population - Portugal (%)
Place of birth for the foreign-born population - Spain (%)
Place of birth for the foreign-born population - Other Southern Europe (%)
Place of birth for the foreign-born population - Albania (%)
Place of birth for the foreign-born population - Belarus (%)
Place of birth for the foreign-born population - Bosnia and Herzegovina (%)
Place of birth for the foreign-born population - Bulgaria (%)
Place of birth for the foreign-born population - Croatia (%)
Place of birth for the foreign-born population - Czechoslovakia (%)
Place of birth for the foreign-born population - Hungary (%)
Place of birth for the foreign-born population - Latvia (%)
Place of birth for the foreign-born population - Lithuania (%)
Place of birth for the foreign-born population - North Macedonia (Macedonia) (%)
Place of birth for the foreign-born population - Moldova (%)
Place of birth for the foreign-born population - Poland (%)
Place of birth for the foreign-born population - Romania (%)
Place of birth for the foreign-born population - Russia (%)
Place of birth for the foreign-born population - Serbia (%)
Place of birth for the foreign-born population - Ukraine (%)
Place of birth for the foreign-born population - Other Eastern Europe (%)
Place of birth for the foreign-born population - China (%)
Place of birth for the foreign-born population - Hong Kong (%)
Place of birth for the foreign-born population - Taiwan (%)
Place of birth for the foreign-born population - Japan (%)
Place of birth for the foreign-born population - Korea (%)
Place of birth for the foreign-born population - Other Eastern Asia (%)
Place of birth for the foreign-born population - Afghanistan (%)
Place of birth for the foreign-born population - Bangladesh (%)
Place of birth for the foreign-born population - India (%)
Place of birth for the foreign-born population - Iran (%)
Place of birth for the foreign-born population - Kazakhstan (%)
Place of birth for the foreign-born population - Nepal (%)
Place of birth for the foreign-born population - Pakistan (%)
Place of birth for the foreign-born population - Sri Lanka (%)
Place of birth for the foreign-born population - Uzbekistan (%)
Place of birth for the foreign-born population - Other South Central Asia (%)
Place of birth for the foreign-born population - Burma (%)
Place of birth for the foreign-born population - Cambodia (%)
Place of birth for the foreign-born population - Indonesia (%)
Place of birth for the foreign-born population - Laos (%)
Place of birth for the foreign-born population - Malaysia (%)
Place of birth for the foreign-born population - Philippines (%)
Place of birth for the foreign-born population - Singapore (%)
Place of birth for the foreign-born population - Thailand (%)
Place of birth for the foreign-born population - Vietnam (%)
Place of birth for the foreign-born population - Other South Eastern Asia (%)
Place of birth for the foreign-born population - Armenia (%)
Place of birth for the foreign-born population - Iraq (%)
Place of birth for the foreign-born population - Israel (%)
Place of birth for the foreign-born population - Jordan (%)
Place of birth for the foreign-born population - Kuwait (%)
Place of birth for the foreign-born population - Lebanon (%)
Place of birth for the foreign-born population - Saudi Arabia (%)
Place of birth for the foreign-born population - Syria (%)
Place of birth for the foreign-born population - Turkey (%)
Place of birth for the foreign-born population - Yemen (%)
Place of birth for the foreign-born population - Other Western Asia (%)
Place of birth for the foreign-born population - Eritrea (%)
Place of birth for the foreign-born population - Ethiopia (%)
Place of birth for the foreign-born population - Kenya (%)
Place of birth for the foreign-born population - Somalia (%)
Place of birth for the foreign-born population - Uganda (%)
Place of birth for the foreign-born population - Zimbabwe (%)
Place of birth for the foreign-born population - Other Eastern Africa (%)
Place of birth for the foreign-born population - Cameroon (%)
Place of birth for the foreign-born population - Congo (%)
Place of birth for the foreign-born population - Democratic Republic of Congo (Zaire) (%)
Place of birth for the foreign-born population - Other Middle Africa (%)
Place of birth for the foreign-born population - Egypt (%)
Place of birth for the foreign-born population - Morocco (%)
Place of birth for the foreign-born population - Sudan (%)
Place of birth for the foreign-born population - Other Northern Africa (%)
Place of birth for the foreign-born population - South Africa (%)
Place of birth for the foreign-born population - Other Southern Africa (%)
Place of birth for the foreign-born population - Cabo Verde (%)
Place of birth for the foreign-born population - Ghana (%)
Place of birth for the foreign-born population - Liberia (%)
Place of birth for the foreign-born population - Nigeria (%)
Place of birth for the foreign-born population - Senegal (%)
Place of birth for the foreign-born population - Sierra Leone (%)
Place of birth for the foreign-born population - Other Western Africa (%)
Place of birth for the foreign-born population - Australia (%)
Place of birth for the foreign-born population - New Zealand (%)
Place of birth for the foreign-born population - Fiji (%)
Place of birth for the foreign-born population - Micronesia (%)
Place of birth for the foreign-born population - Bahamas (%)
Place of birth for the foreign-born population - Barbados (%)
Place of birth for the foreign-born population - Cuba (%)
Place of birth for the foreign-born population - Dominica (%)
Place of birth for the foreign-born population - Dominican Republic (%)
Place of birth for the foreign-born population - Grenada (%)
Place of birth for the foreign-born population - Haiti (%)
Place of birth for the foreign-born population - Jamaica (%)
Place of birth for the foreign-born population - St. Vincent and the Grenadines (%)
Place of birth for the foreign-born population - Trinidad and Tobago (%)
Place of birth for the foreign-born population - West Indies (%)
Place of birth for the foreign-born population - Other Caribbean (%)
Place of birth for the foreign-born population - Belize (%)
Place of birth for the foreign-born population - Costa Rica (%)
Place of birth for the foreign-born population - El Salvador (%)
Place of birth for the foreign-born population - Guatemala (%)
Place of birth for the foreign-born population - Honduras (%)
Place of birth for the foreign-born population - Mexico (%)
Place of birth for the foreign-born population - Nicaragua (%)
Place of birth for the foreign-born population - Panama (%)
Place of birth for the foreign-born population - Other Central America (%)
Place of birth for the foreign-born population - Argentina (%)
Place of birth for the foreign-born population - Bolivia (%)
Place of birth for the foreign-born population - Brazil (%)
Place of birth for the foreign-born population - Chile (%)
Place of birth for the foreign-born population - Colombia (%)
Place of birth for the foreign-born population - Ecuador (%)
Place of birth for the foreign-born population - Guyana (%)
Place of birth for the foreign-born population - Peru (%)
Place of birth for the foreign-born population - Uruguay (%)
Place of birth for the foreign-born population - Venezuela (%)
Place of birth for the foreign-born population - Other South America (%)
Place of birth for the foreign-born population - Canada (%)
Place of birth for the foreign-born population - Other Northern America (%)
Place of birth for the foreign-born population - Other (%)
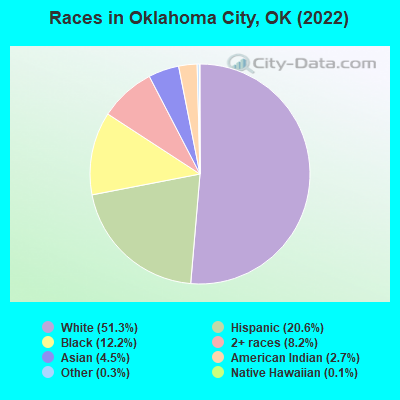
According to 2022 data, the most numerous races in Oklahoma City, OK are White alone (356,318 residents), Hispanic (143,191 residents), and Two or more races (57,195 residents). 79.5% of Oklahoma City residents speak English at home. 11.7% of Oklahoma City, OK residents are foreign-born (7.1% born in Latin America, 3.3% born in Asia), which is 48.8% greater than the foreign-born rate of 6.0% across the entire state of Oklahoma.
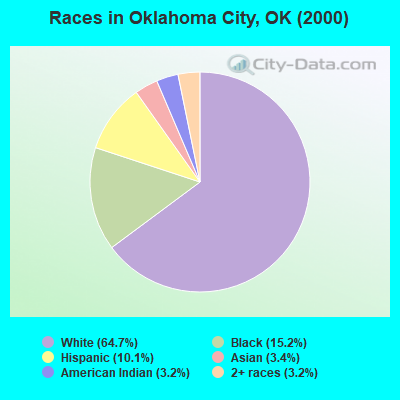
Race distribution in Oklahoma City
2000 2022
327,225 64.7% White alone 76,994 15.2% Black alone 51,368 10.1% Hispanic 17,410 3.4% Asian alone 15,999 3.2% Two or more races 16,406 3.2% American Indian alone 452 0.09% Other race alone 278 0.05% Native Hawaiian and Other
356,318 51.3% White alone 143,191 20.6% Hispanic 84,871 12.2% Black alone 57,195 8.2% Two or more races 31,561 4.5% Asian alone 18,630 2.7% American Indian alone 1,978 0.3% Other race alone 1,024 0.1% Native Hawaiian and Other
2000 2022
2,556,368 74.1% White alone 266,158 7.7% American Indian alone 257,981 7.5% Black alone 179,304 5.2% Hispanic 140,249 4.1% Two or more races 46,172 1.3% Asian alone 2,322 0.07% Other race alone 2,100 0.06% Native Hawaiian and Other
2,517,403 62.6% White alone 486,692 12.1% Hispanic 364,453 9.1% Two or more races 273,650 6.8% American Indian alone 268,543 6.7% Black alone 92,672 2.3% Asian alone 10,786 0.3% Other race alone 5,601 0.1% Native Hawaiian and Other
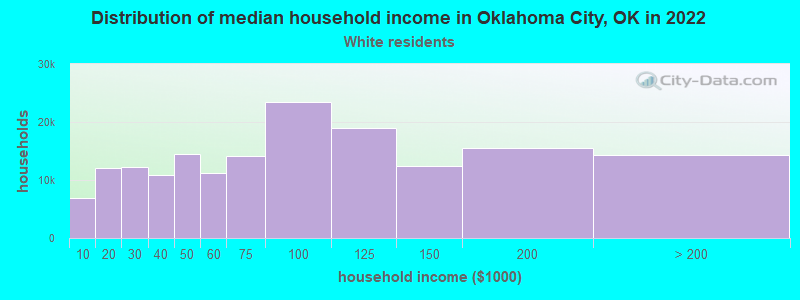
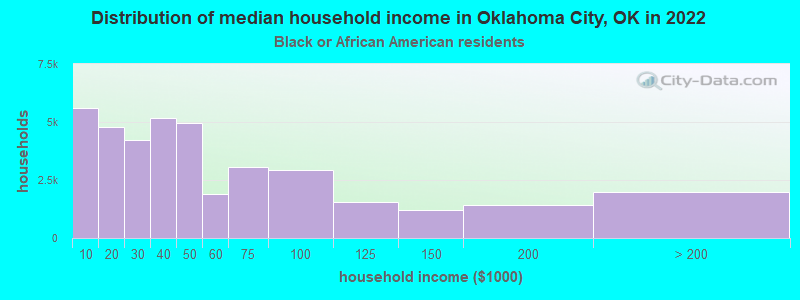
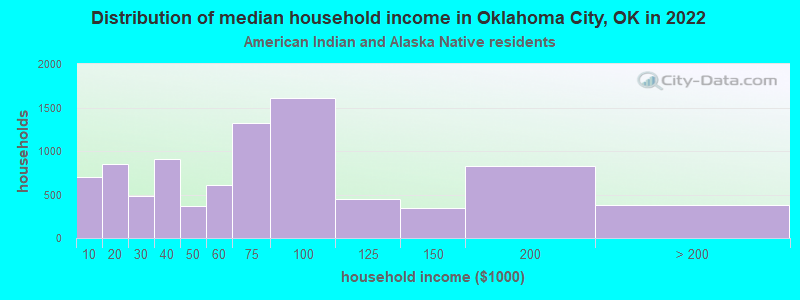
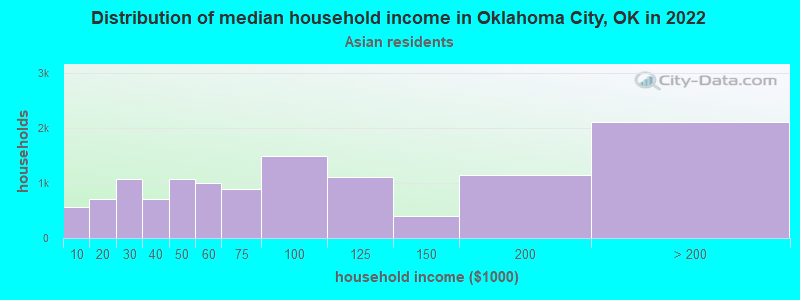
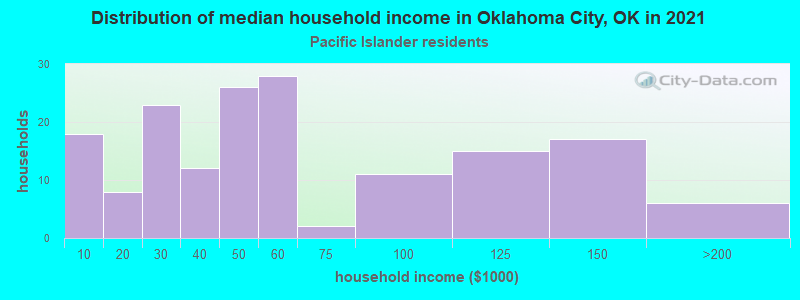
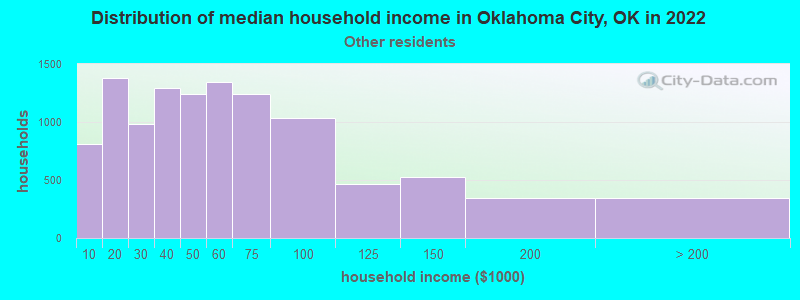
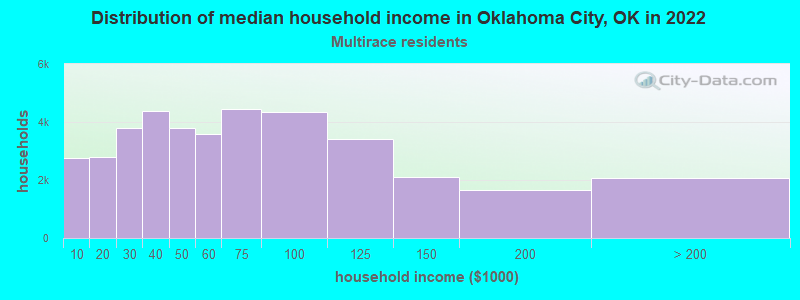
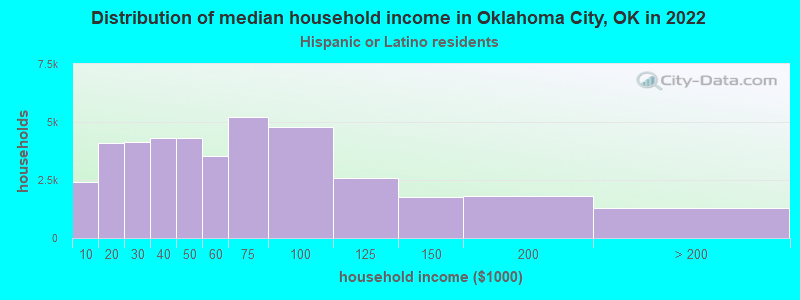
Income and house value in Oklahoma City Median household income in 2022 $77,385 White non-Hispanic householders$38,524 Black householders$68,881 American Indian and Alaska Native householders$76,353 Asian householders$21,206 Native Hawaiian and other Pacific Islander householders$48,264 Some other race householders$55,876 Two or more races householders$52,154 Hispanic or Latino race householdersMedian 2022 house value $249,709 White Non-Hispanic householders$163,853 Black or African American householders$195,576 American Indian or Alaska Native householders $251,747 Asian householders$243,016 Native Hawaiian and other Pacific Islander householders$114,959 Some other race householders$188,301 Two or more races householders$128,056 Hispanic or Latino householders
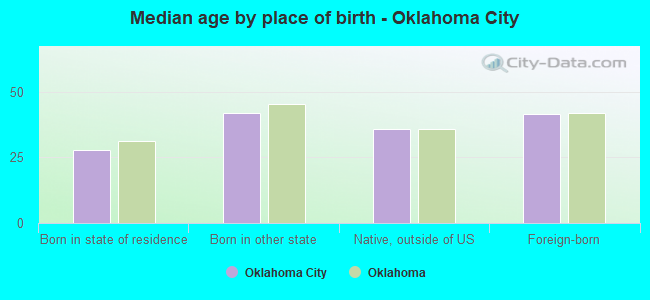
Median age by race in Oklahoma City
39.7 Median age for White residents39.2 40.2 33.2 Median age for Black or African American residents32.9 33.5 31.6 Median age for American Indian / Alaska Native residents28.1 34.9 36.7 Median age for Asian residents35.2 37.7 32.6 Median age for Native Hawaiian / Pacific Islander residents27.6 37.2 26.0 Median age for Other race residents27.0 25.2 24.6 Median age for Two or more races residents24.0 25.6 40.8 Median age for White alone residents40.0 41.8 24.2 Median age for Hispanic or Latino residents24.1 24.3
Owner/renter occupied households by race in Oklahoma City
House owners and renters - White residents 112,488 67.5% Owner occupied54,203 32.5% Renter occupiedHouse owners and renters - Black or African American residents 13,671 35.3% Owner occupied25,100 64.7% Renter occupiedHouse owners and renters - American Indian / Alaska Native residents 4,052 45.8% Owner occupied4,787 54.2% Renter occupiedHouse owners and renters - Asian residents 7,522 61.1% Owner occupied4,797 38.9% Renter occupiedHouse owners and renters - Native Hawaiian / Pacific Islander residents 353 84.3% Owner occupied66 15.7% Renter occupiedHouse owners and renters - Other race residents 5,444 49.5% Owner occupied5,555 50.5% Renter occupiedHouse owners and renters - Two or more races residents 18,016 46.0% Owner occupied21,117 54.0% Renter occupiedHouse owners and renters - White alone residents 109,635 68.7% Owner occupied49,889 31.3% Renter occupiedHouse owners and renters - Hispanic or Latino residents 18,869 46.8% Owner occupied21,440 53.2% Renter occupied
Language usage in Oklahoma City
English speakers - Total 79.5% of residents of Oklahoma City speak English at home.
15.1% of residents speak Spanish at home 61,500 62.6% Speak English very well36,770 37.4% Speak English less than very well5.3% of residents speak other language at home 20,359 58.8% Speak English very well14,284 41.2% Speak English less than very well
English speakers - Born in the United States 90.0% of residents of Oklahoma City speak English at home.
8.7% of residents speak Spanish at home 16,015 88.0% Speak English very well2,186 12.0% Speak English less than very well1.3% of residents speak other language at home 2,181 81.3% Speak English very well503 18.7% Speak English less than very well
English speakers - Native, born elsewhere 66.5% of residents of Oklahoma City speak English at home.
18.8% of residents speak Spanish at home 1,034 50.7% Speak English very well1,004 49.3% Speak English less than very well14.7% of residents speak other language at home 1,344 84.5% Speak English very well247 15.5% Speak English less than very well
English speakers - Foreign-born 12.2% of residents of Oklahoma City speak English at home.
55.6% of residents speak Spanish at home 14,934 33.6% Speak English very well29,519 66.4% Speak English less than very well32.2% of residents speak other language at home 13,304 51.7% Speak English very well12,440 48.3% Speak English less than very well
White (Caucasian) - Speak only English Native:
95.7% (337,037)Foreign-born:
28.0% (2,865)
White (Caucasian) - Speak another language Native:
4.3% (15,325)Foreign-born:
72.0% (7,352)
Black or African American - Speak only English Native:
98.2% (74,344)Foreign-born:
21.3% (896)
Black or African American - Speak another language Native:
1.8% (1,366)Foreign-born:
78.7% (3,310)
American Indian / Alaska Native - Speak only English Native:
85.7% (19,867)Foreign-born:
16.9% (376)
American Indian / Alaska Native - Speak another language Native:
14.3% (3,308)Foreign-born:
83.1% (1,854)
Asian - Speak only English Native:
58.8% (5,347)Foreign-born:
12.7% (2,661)
Asian - Speak another language Native:
41.2% (3,742)Foreign-born:
87.3% (18,266)
Native Hawaiian / Pacific Islander - Speak only English Native:
76.9% (634)Foreign-born:
25.9% (46)
Native Hawaiian / Pacific Islander - Speak another language Native:
23.9% (197)Foreign-born:
70.2% (124)
Other race - Speak only English Native:
28.2% (5,201)Foreign-born:
10.3% (1,601)
Other race - Speak another language Native:
71.8% (13,223)Foreign-born:
89.7% (13,962)
Two or more races - Speak only English Native:
71.2% (63,381)Foreign-born:
5.2% (1,390)
Two or more races - Speak another language Native:
28.8% (25,581)Foreign-born:
94.8% (25,115)
White alone - Speak only English Native:
97.5% (326,833)Foreign-born:
47.5% (2,763)
White alone - Speak another language Native:
2.5% (8,409)Foreign-born:
52.5% (3,056)
Hispanic or Latino - Speak only English Native:
40.7% (32,743)Foreign-born:
6.2% (2,945)
Hispanic or Latino - Speak another language Native:
59.3% (47,711)Foreign-born:
93.8% (44,561)
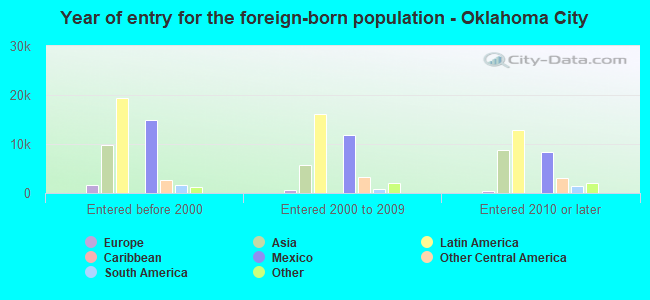
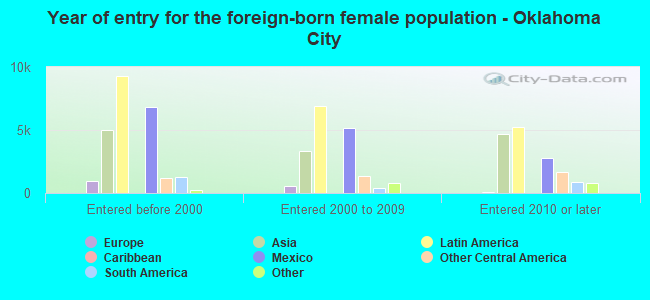
Foreign-born residents in Oklahoma City 80,505 residents are foreign born (7.1% Latin America , 3.3% Asia ).
This city:
11.7%Oklahoma:
6.1%
Marital status for residents in Oklahoma City Marital status - White (Caucasian) population 15 years and over
Males 30.6% Never married54.0% Now married1.0% Separated3.9% Widowed10.6% DivorcedFemales 25.1% Never married50.0% Now married1.7% Separated8.0% Widowed15.3% DivorcedWomen who gave birth in the past 12 months Now married:
76.0% (4,066)Unmarried:
24.0% (1,282)
Women who did not give birth in the past 12 months Now married:
47.3% (42,086)Unmarried:
52.7% (46,799)
Marital status - Black or African American population 15 years and over
Males 45.7% Never married34.0% Now married2.4% Separated1.7% Widowed16.2% DivorcedFemales 52.3% Never married26.6% Now married2.9% Separated5.5% Widowed12.7% DivorcedWomen who gave birth in the past 12 months Now married:
31.6% (351)Unmarried:
68.4% (760)
Women who did not give birth in the past 12 months Now married:
20.5% (4,593)Unmarried:
79.5% (17,845)
Marital status - American Indian / Alaska Native population 15 years and over
Males 46.0% Never married36.4% Now married1.4% Separated3.4% Widowed12.8% DivorcedFemales 49.7% Never married29.8% Now married0.4% Separated2.6% Widowed17.5% DivorcedWomen who gave birth in the past 12 months Now married:
25.9% (91)Unmarried:
74.1% (260)
Women who did not give birth in the past 12 months Now married:
30.3% (2,156)Unmarried:
69.7% (4,957)
Marital status - Asian population 15 years and over
Males 34.3% Never married56.8% Now married0.0% Separated3.0% Widowed6.0% DivorcedFemales 22.4% Never married61.2% Now married1.1% Separated6.6% Widowed8.7% DivorcedWomen who gave birth in the past 12 months Now married:
82.7% (477)Unmarried:
17.3% (100)
Women who did not give birth in the past 12 months Now married:
56.8% (4,888)Unmarried:
43.2% (3,718)
Marital status - Native Hawaiian / Pacific Islander population 15 years and over
Males 45.7% Never married45.7% Now married0.0% Separated0.0% Widowed8.6% DivorcedFemales 34.3% Never married32.4% Now married2.5% Separated4.6% Widowed26.2% DivorcedWomen who gave birth in the past 12 months Now married:
0.0% (0)Unmarried:
100.0% (8)
Women who did not give birth in the past 12 months Now married:
40.6% (105)Unmarried:
59.4% (154)
Marital status - Other race population 15 years and over
Males 41.6% Never married50.6% Now married2.5% Separated0.4% Widowed5.0% DivorcedFemales 38.0% Never married49.3% Now married4.1% Separated1.3% Widowed7.3% DivorcedWomen who gave birth in the past 12 months Now married:
42.9% (340)Unmarried:
57.1% (452)
Women who did not give birth in the past 12 months Now married:
50.1% (4,658)Unmarried:
49.9% (4,648)
Marital status - Two or more races population 15 years and over
Males 46.5% Never married39.5% Now married2.9% Separated1.1% Widowed9.9% DivorcedFemales 40.7% Never married39.1% Now married2.9% Separated4.1% Widowed13.2% DivorcedWomen who gave birth in the past 12 months Now married:
64.8% (1,450)Unmarried:
35.2% (787)
Women who did not give birth in the past 12 months Now married:
36.5% (11,942)Unmarried:
63.5% (20,736)
Marital status - White alone, not Hispanic / Latino population 15 years and over
Males 29.6% Never married54.9% Now married0.9% Separated3.9% Widowed10.7% DivorcedFemales 24.3% Never married50.4% Now married1.6% Separated8.2% Widowed15.5% DivorcedWomen who gave birth in the past 12 months Now married:
75.3% (3,584)Unmarried:
24.7% (1,178)
Women who did not give birth in the past 12 months Now married:
48.0% (39,632)Unmarried:
52.0% (42,974)
Marital status - Hispanic or Latino population 15 years and over
Males 46.4% Never married42.6% Now married2.9% Separated0.9% Widowed7.2% DivorcedFemales 38.8% Never married43.6% Now married3.4% Separated3.2% Widowed10.9% DivorcedWomen who gave birth in the past 12 months Now married:
67.3% (1,530)Unmarried:
32.7% (745)
Women who did not give birth in the past 12 months Now married:
42.7% (15,601)Unmarried:
57.3% (20,940)
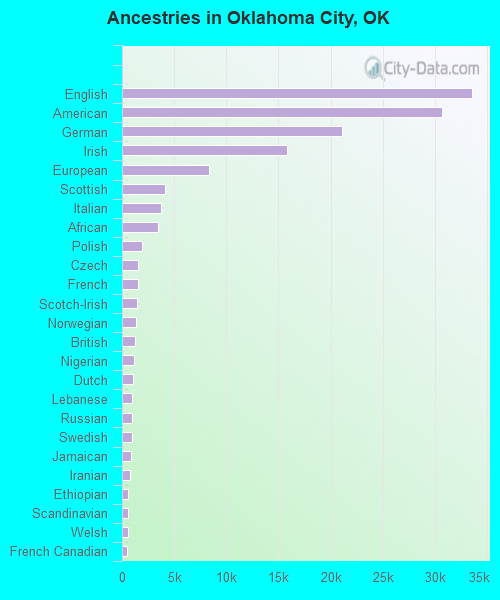
Ancestries in Oklahoma City
33,517 9.2% English30,700 8.4% American21,139 5.8% German15,844 4.3% Irish8,302 2.3% European4,146 1.1% Scottish3,718 1.0% Italian3,426 0.9% African1,882 0.5% Polish1,548 0.4% Czech1,505 0.4% French1,397 0.4% Scotch-Irish1,343 0.4% Norwegian1,253 0.3% British1,124 0.3% Nigerian1,091 0.3% Dutch937 0.3% Lebanese919 0.3% Russian914 0.2% Swedish841 0.2% Jamaican730 0.2% Iranian594 0.2% Ethiopian574 0.2% Scandinavian541 0.1% Welsh493 0.1% French Canadian483 0.1% Portuguese466 0.1% Northern European381 0.1% Ghanaian361 0.10% Moroccan355 0.10% Danish339 0.09% Eastern European301 0.08% Greek301 0.08% Haitian295 0.08% South African256 0.07% Somali256 0.07% Dutch West Indian248 0.07% Ukrainian234 0.06% Brazilian231 0.06% Czechoslovakian214 0.06% Hungarian206 0.06% Canadian205 0.06% Kenyan199 0.05% Zimbabwean197 0.05% Arab173 0.05% Syrian170 0.05% Serbian167 0.05% Iraqi162 0.04% Romanian146 0.04% Liberian106 0.03% Armenian97 0.03% Israeli95 0.03% Yugoslavian93 0.03% Austrian77 0.02% Finnish71 0.02% Swiss69 0.02% Ugandan66 0.02% Bulgarian57 0.02% Afghan56 0.02% West Indian52 0.01% Trinidadian and Tobagonian51 0.01% Lithuanian50 0.01% Slovak49 0.01% Jordanian47 0.01% Icelander44 0.01% Senegalese40 0.01% Sierra Leonean40 0.01% Turkish39 0.01% Pennsylvania German38 0.01% Guyanese36 0.01% Celtic33 0.01% Slavic32 0.01% Egyptian28 0.01% Palestinian21 0.01% Barbadian20 0.01% Belgian19 0.01% Slovene
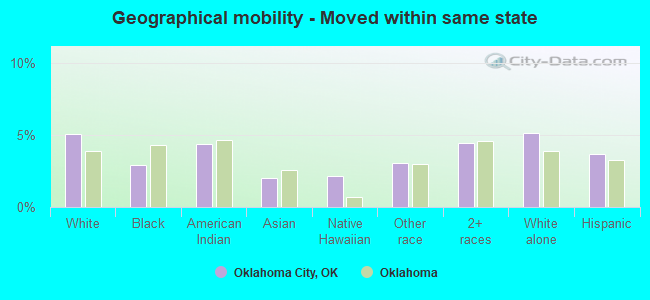
Geographical mobility in Oklahoma City Same house 1 year ago 315,300 83.6% White (Caucasian)70,322 81.8% Black or African American22,112 83.6% American Indian / Alaska Native25,759 82.3% Asian856 90.8% Native Hawaiian / Pacific Islander31,086 84.5% Other race106,040 83.5% Two or more races295,826 83.7% White alone, not Hispanic / Latino117,191 83.7% Hispanic or LatinoMoved within same county 27,456 7.3% White / Caucasian10,009 11.6% Black or African American2,633 10.0% American Indian / Alaska Native2,956 9.4% Asian65 6.9% Native Hawaiian / Pacific Islander2,578 7.0% Other race9,266 7.3% Two or more races25,806 7.3% White alone, not Hispanic / Latino10,995 7.8% Hispanic or LatinoMoved within same state 19,174 5.1% White / Caucasian2,500 2.9% Black or African American1,153 4.4% American Indian / Alaska Native641 2.0% Asian20 2.1% Native Hawaiian / Pacific Islander1,118 3.0% Other race5,635 4.4% Two or more races18,083 5.1% White alone, not Hispanic / Latino5,138 3.7% Hispanic or LatinoMoved from different state 14,340 3.8% White / Caucasian2,630 3.1% Black or African American538 2.0% American Indian / Alaska Native1,429 4.6% Asian56 5.9% Native Hawaiian / Pacific Islander1,457 4.0% Other race4,433 3.5% Two or more races13,018 3.7% White alone, not Hispanic / Latino5,077 3.6% Hispanic or LatinoMoved from abroad 835 0.2% White551 0.6% Black or African American530 1.7% Asian535 1.5% Other race1,633 1.3% Two or more races790 0.2% White alone, not Hispanic / Latino1,673 1.2% Hispanic or Latino
Children Nativity (place of birth) in Oklahoma City
Children under 6 years - Living with two parents Both parents native 21,270 100.0% NativeBoth parents foreign-born 5,626 95.5% Native263 4.5% Foreign-bornOne native, one foreign-born parent 3,071 100.0% NativeChildren under 6 years - Living with one parent Native parent 18,556 100.0% NativeForeign-born parent 3,986 91.2% Native385 8.8% Foreign-bornChildren 6 to 17 years - Living with two parents Both parents native 48,089 99.5% Native224 0.5% Foreign-bornBoth parents foreign-born 11,445 86.2% Native1,836 13.8% Foreign-bornOne native, one foreign-born parent 5,370 96.7% Native185 3.3% Foreign-bornChildren 6 to 17 years - Living with one parent Native parent 34,840 100.0% NativeForeign-born parent 9,581 54.4% Native8,024 45.6% Foreign-born
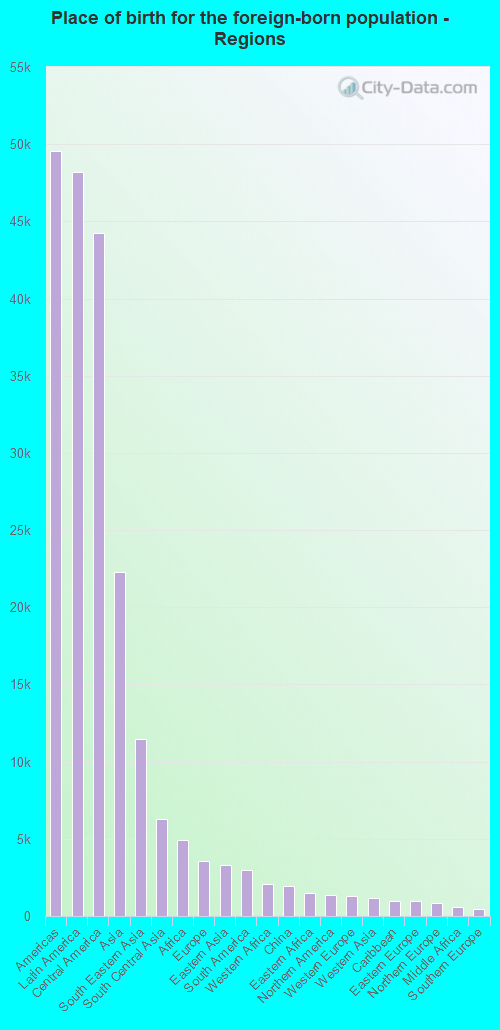
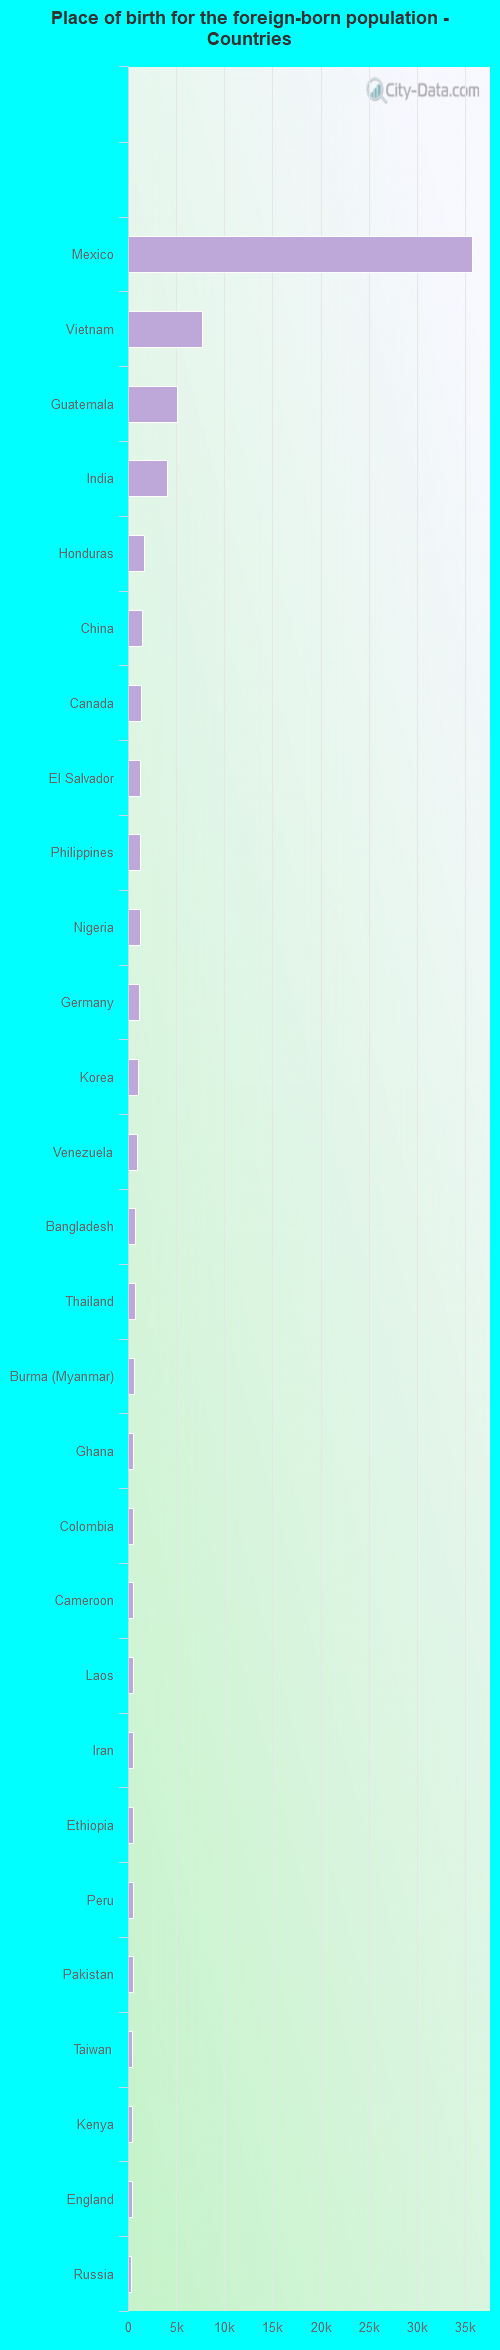
Place of birth for residents in Oklahoma City 49,554 Americas48,198 Latin America44,264 Central America22,302 Asia11,441 South Eastern Asia6,282 South Central Asia4,925 Africa3,564 Europe3,299 Eastern Asia2,972 South America2,105 Western Africa1,940 China1,508 Eastern Africa1,355 Northern America1,277 Western Europe1,171 Western Asia960 Caribbean959 Eastern Europe851 Northern Europe577 Middle Africa472 Southern Europe307 Northern Africa159 Oceania85 Southern Africa45 Australia and New Zealand Subregion35,696 Mexico7,666 Vietnam5,089 Guatemala4,095 India1,615 Honduras1,415 China1,311 Canada1,256 El Salvador1,230 Philippines1,216 Nigeria1,171 Germany1,051 Korea893 Venezuela725 Bangladesh706 Thailand588 Burma (Myanmar)554 Ghana549 Colombia542 Cameroon541 Laos537 Iran488 Ethiopia486 Peru471 Pakistan434 Taiwan432 Kenya424 England351 Russia312 Argentina307 Japan306 Nicaragua292 United Kingdom282 Portugal260 Brazil260 Nepal252 Saudi Arabia246 Cuba245 Indonesia232 Ecuador231 Syria230 Malaysia224 Kuwait223 Zimbabwe223 Jamaica196 Morocco190 Panama187 Eritrea182 Cambodia173 Liberia169 Dominican Republic147 Chile138 Trinidad and Tobago133 Kazakhstan127 Bulgaria118 Iraq103 Italy103 Poland103 Lebanon101 Ukraine96 Israel90 Hong Kong88 Ivory Coast79 Somalia77 Jordan77 South Africa73 Guyana72 Marshall Islands71 Serbia65 Bosnia and Herzegovina64 Romania63 France58 Egypt55 Scotland50 Spain49 Singapore47 Costa Rica45 Australia43 Hungary39 Sierra Leone35 Uganda35 Greece35 Democratic Republic of Congo (Zaire)34 Haiti27 Algeria25 Grenada23 Sudan22 Sri Lanka21 Afghanistan20 Norway18 Ireland18 Turkey16 Bolivia15 United Arab Emirates15 Bahamas15 Switzerland14 Uzbekistan14 Czechoslovakia13 Austria12 Sweden11 Netherlands11 Micronesia11 Senegal9 Denmark9 Georgia6 Azerbaijan6 Fiji5 Croatia5 Lithuania4 Barbados3 Yemen
Grandparents responsible for own grandchildren in Oklahoma City
Grandparents (30 to 59 years) White / Caucasian 2,396 56.4% Responsible for grandchildren1,855 43.6% Not responsible for grandchildrenBlack or African American 728 92.7% Responsible for grandchildren57 7.3% Not responsible for grandchildrenAmerican Indian / Alaska Native 128 67.7% Responsible for grandchildren61 32.3% Not responsible for grandchildrenAsian 22 11.8% Responsible for grandchildren168 88.2% Not responsible for grandchildrenNative Hawaiian / Pacific Islander 26 100.0% Not responsible for grandchildrenOther race 164 23.3% Responsible for grandchildren540 76.7% Not responsible for grandchildrenTwo or more races 763 51.9% Responsible for grandchildren707 48.1% Not responsible for grandchildrenWhite alone, not Hispanic / Latino 2,368 56.1% Responsible for grandchildren1,855 43.9% Not responsible for grandchildrenHispanic or Latino 818 42.2% Responsible for grandchildren1,121 57.8% Not responsible for grandchildrenGrandparents (60 years and over) White / Caucasian 889 25.7% Responsible for grandchildren2,568 74.3% Not responsible for grandchildrenBlack or African American 698 55.4% Responsible for grandchildren562 44.6% Not responsible for grandchildrenAmerican Indian / Alaska Native 125 77.8% Responsible for grandchildren36 22.2% Not responsible for grandchildrenAsian 340 42.6% Responsible for grandchildren458 57.4% Not responsible for grandchildrenOther race 87 27.3% Responsible for grandchildren231 72.7% Not responsible for grandchildrenTwo or more races 342 26.8% Responsible for grandchildren936 73.2% Not responsible for grandchildrenWhite alone, not Hispanic / Latino 889 26.0% Responsible for grandchildren2,531 74.0% Not responsible for grandchildrenHispanic or Latino 188 16.0% Responsible for grandchildren989 84.0% Not responsible for grandchildren
Zip codes: 73078 , 73097 , 73099 , 73102 , 73103 , 73104 , 73105 , 73106 , 73107 , 73108 , 73109 , 73111 , 73112 , 73114 , 73118 , 73119 , 73128 , 73129 , 73131 , 73134 , 73139 , 73142 , 73149 , 73151 , 73159 , 73162 , 73169 , 73173 , 73179 .