Races in Ramona, California (CA) Detailed Stats
Data:
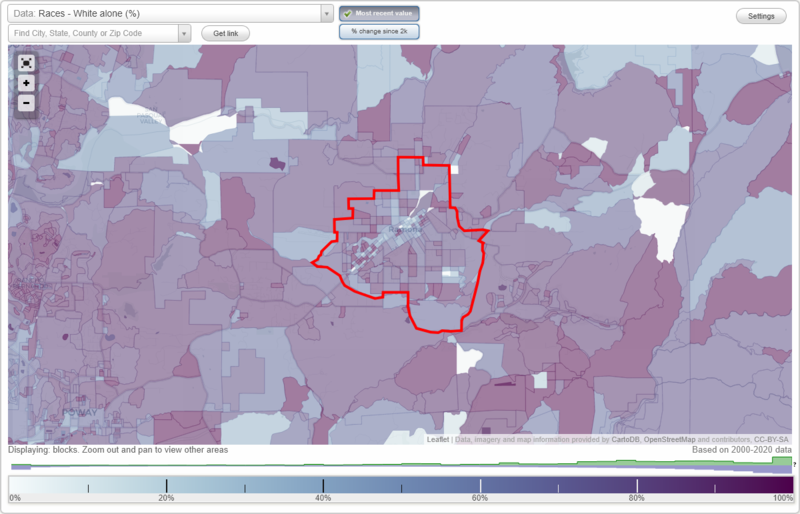
Races - White alone (%)
Races - White alone (% change since 2000)
Races - Black alone (%)
Races - Black alone (% change since 2000)
Races - American Indian alone (%)
Races - American Indian alone (% change since 2000)
Races - Asian alone (%)
Races - Asian alone (% change since 2000)
Races - Hispanic (%)
Races - Hispanic (% change since 2000)
Races - Native Hawaiian and Other Pacific Islander alone (%)
Races - Native Hawaiian and Other Pacific Islander alone (% change since 2000)
Races - Two or more races(%)
Races - Two or more races(% change since 2000)
Races - Other race alone (%)
Races - Other race alone (% change since 2000)
Racial diversity
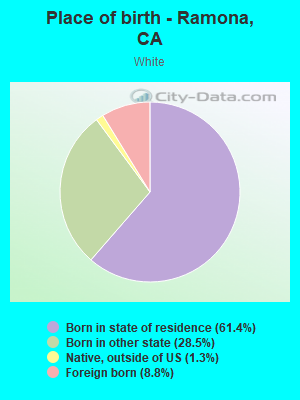
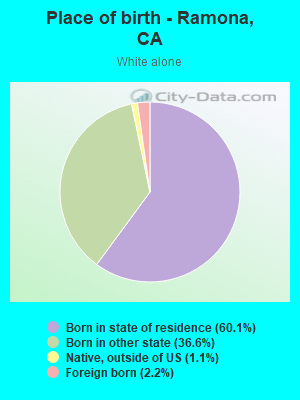
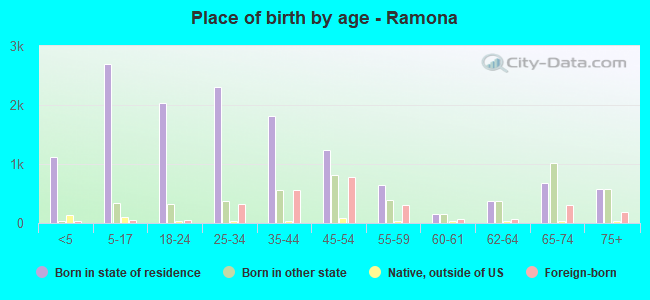
Place of birth - Born in state of residence (%)
Place of birth - Born in state of residence (%) - White
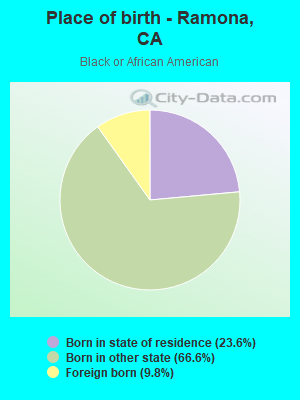
Place of birth - Born in state of residence (%) - Black or African American
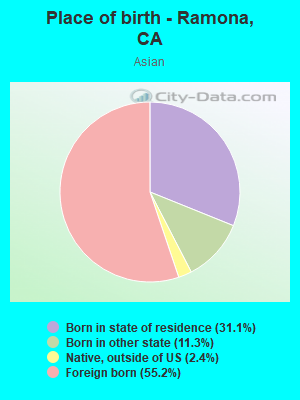
Place of birth - Born in state of residence (%) - Asian
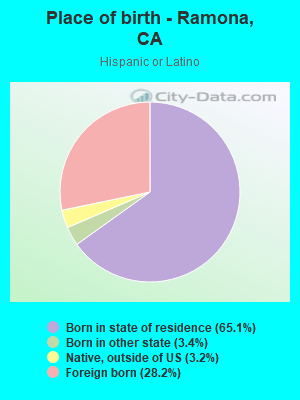
Place of birth - Born in state of residence (%) - Hispanic or Latino
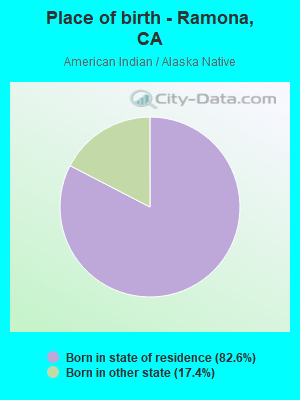
Place of birth - Born in state of residence (%) - American Indian and Alaska Native
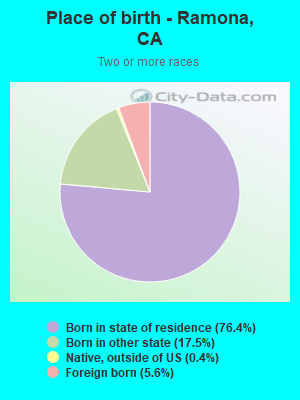
Place of birth - Born in state of residence (%) - Multirace
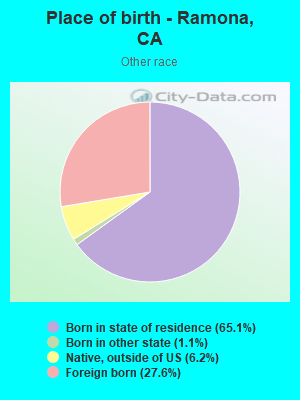
Place of birth - Born in state of residence (%) - Other Race
Place of birth - Born in other state (%)
Place of birth - Born in other state (%) - White
Place of birth - Born in other state (%) - Black or African American
Place of birth - Born in other state (%) - Asian
Place of birth - Born in other state (%) - Hispanic or Latino
Place of birth - Born in other state (%) - American Indian and Alaska Native
Place of birth - Born in other state (%) - Multirace
Place of birth - Born in other state (%) - Other Race
Place of birth - Native, outside of US (%)
Place of birth - Native, outside of US (%) - White
Place of birth - Native, outside of US (%) - Black or African American
Place of birth - Native, outside of US (%) - Asian
Place of birth - Native, outside of US (%) - Hispanic or Latino
Place of birth - Native, outside of US (%) - American Indian and Alaska Native
Place of birth - Native, outside of US (%) - Multirace
Place of birth - Native, outside of US (%) - Other Race
Place of birth - Foreign born (%)
Place of birth - Foreign born (%) - White
Place of birth - Foreign born (%) - Black or African American
Place of birth - Foreign born (%) - Asian
Place of birth - Foreign born (%) - Hispanic or Latino
Place of birth - Foreign born (%) - American Indian and Alaska Native
Place of birth - Foreign born (%) - Multirace
Place of birth - Foreign born (%) - Other Race
Residents speaking English at home (%)
Residents speaking English at home - Born in the United States (%)
Residents speaking English at home - Native, born elsewhere (%)
Residents speaking English at home - Foreign born (%)
Residents speaking Spanish at home (%)
Residents speaking Spanish at home - Born in the United States (%)
Residents speaking Spanish at home - Native, born elsewhere (%)
Residents speaking Spanish at home - Foreign born (%)
Residents speaking other language at home (%)
Residents speaking other language at home - Born in the United States (%)
Residents speaking other language at home - Native, born elsewhere (%)
Residents speaking other language at home - Foreign born (%)
Marital status - Never married (%)
Marital status - Now married (%)
Marital status - Separated (%)
Marital status - Widowed (%)
Marital status - Divorced (%)
Ancestries Reported - Arab (%)
Ancestries Reported - Czech (%)
Ancestries Reported - Danish (%)
Ancestries Reported - Dutch (%)
Ancestries Reported - English (%)
Ancestries Reported - French (%)
Ancestries Reported - French Canadian (%)
Ancestries Reported - German (%)
Ancestries Reported - Greek (%)
Ancestries Reported - Hungarian (%)
Ancestries Reported - Irish (%)
Ancestries Reported - Italian (%)
Ancestries Reported - Lithuanian (%)
Ancestries Reported - Norwegian (%)
Ancestries Reported - Polish (%)
Ancestries Reported - Portuguese (%)
Ancestries Reported - Russian (%)
Ancestries Reported - Scotch-Irish (%)
Ancestries Reported - Scottish (%)
Ancestries Reported - Slovak (%)
Ancestries Reported - Subsaharan African (%)
Ancestries Reported - Swedish (%)
Ancestries Reported - Swiss (%)
Ancestries Reported - Ukrainian (%)
Ancestries Reported - United States (%)
Ancestries Reported - Welsh (%)
Ancestries Reported - West Indian (%)
Ancestries Reported - Other (%)
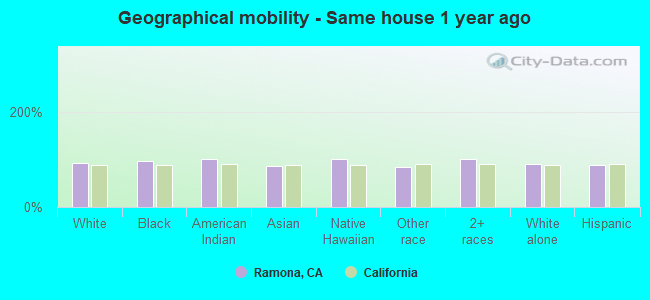
Geographical mobility - Same house 1 year ago (%)
Geographical mobility - Same house 1 year ago (%) - White
Geographical mobility - Same house 1 year ago (%) - Black or African American
Geographical mobility - Same house 1 year ago (%) - Asian
Geographical mobility - Same house 1 year ago (%) - Hispanic or Latino
Geographical mobility - Same house 1 year ago (%) - American Indian and Alaska Native
Geographical mobility - Same house 1 year ago (%) - Multirace
Geographical mobility - Same house 1 year ago (%) - Other Race
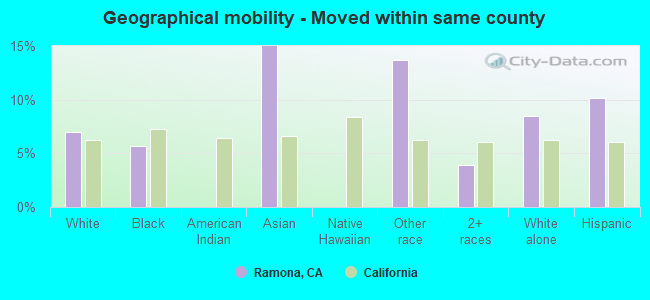
Geographical mobility - Moved within same county (%)
Geographical mobility - Moved within same county (%) - White
Geographical mobility - Moved within same county (%) - Black or African American
Geographical mobility - Moved within same county (%) - Asian
Geographical mobility - Moved within same county (%) - Hispanic or Latino
Geographical mobility - Moved within same county (%) - American Indian and Alaska Native
Geographical mobility - Moved within same county (%) - Multirace
Geographical mobility - Moved within same county (%) - Other Race
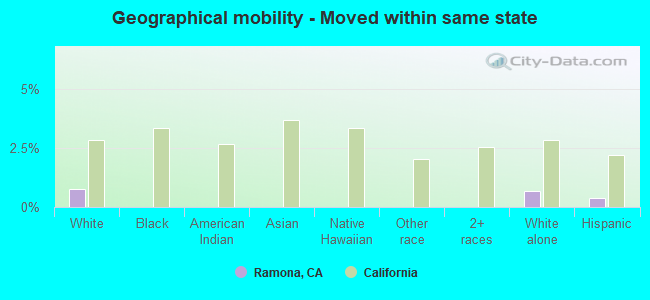
Geographical mobility - Moved from different county within same state (%)
Geographical mobility - Moved from different county within same state (%) - White
Geographical mobility - Moved from different county within same state (%) - Black or African American
Geographical mobility - Moved from different county within same state (%) - Asian
Geographical mobility - Moved from different county within same state (%) - Hispanic or Latino
Geographical mobility - Moved from different county within same state (%) - American Indian and Alaska Native
Geographical mobility - Moved from different county within same state (%) - Multirace
Geographical mobility - Moved from different county within same state (%) - Other Race
Geographical mobility - Moved from different state (%)
Geographical mobility - Moved from different state (%) - White
Geographical mobility - Moved from different state (%) - Black or African American
Geographical mobility - Moved from different state (%) - Asian
Geographical mobility - Moved from different state (%) - Hispanic or Latino
Geographical mobility - Moved from different state (%) - American Indian and Alaska Native
Geographical mobility - Moved from different state (%) - Multirace
Geographical mobility - Moved from different state (%) - Other Race
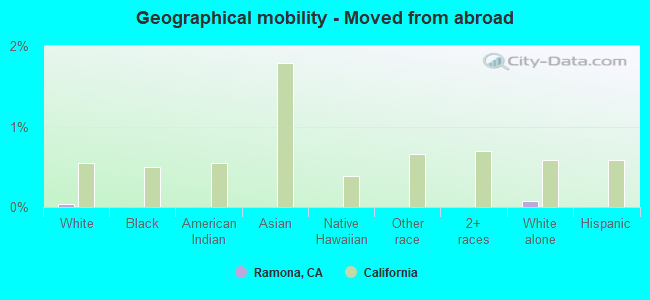
Geographical mobility - Moved from abroad (%)
Geographical mobility - Moved from abroad (%) - White
Geographical mobility - Moved from abroad (%) - Black or African American
Geographical mobility - Moved from abroad (%) - Asian
Geographical mobility - Moved from abroad (%) - Hispanic or Latino
Geographical mobility - Moved from abroad (%) - American Indian and Alaska Native
Geographical mobility - Moved from abroad (%) - Multirace
Geographical mobility - Moved from abroad (%) - Other Race
Place of birth for the foreign-born population - Ireland (%)
Place of birth for the foreign-born population - Denmark (%)
Place of birth for the foreign-born population - Norway (%)
Place of birth for the foreign-born population - Sweden (%)
Place of birth for the foreign-born population - United Kingdom (%)
Place of birth for the foreign-born population - England (%)
Place of birth for the foreign-born population - Scotland (%)
Place of birth for the foreign-born population - Other Northern Europe (%)
Place of birth for the foreign-born population - Austria (%)
Place of birth for the foreign-born population - Belgium (%)
Place of birth for the foreign-born population - France (%)
Place of birth for the foreign-born population - Germany (%)
Place of birth for the foreign-born population - Netherlands (%)
Place of birth for the foreign-born population - Switzerland (%)
Place of birth for the foreign-born population - Other Western Europe (%)
Place of birth for the foreign-born population - Greece (%)
Place of birth for the foreign-born population - Italy (%)
Place of birth for the foreign-born population - Portugal (%)
Place of birth for the foreign-born population - Spain (%)
Place of birth for the foreign-born population - Other Southern Europe (%)
Place of birth for the foreign-born population - Albania (%)
Place of birth for the foreign-born population - Belarus (%)
Place of birth for the foreign-born population - Bosnia and Herzegovina (%)
Place of birth for the foreign-born population - Bulgaria (%)
Place of birth for the foreign-born population - Croatia (%)
Place of birth for the foreign-born population - Czechoslovakia (%)
Place of birth for the foreign-born population - Hungary (%)
Place of birth for the foreign-born population - Latvia (%)
Place of birth for the foreign-born population - Lithuania (%)
Place of birth for the foreign-born population - North Macedonia (Macedonia) (%)
Place of birth for the foreign-born population - Moldova (%)
Place of birth for the foreign-born population - Poland (%)
Place of birth for the foreign-born population - Romania (%)
Place of birth for the foreign-born population - Russia (%)
Place of birth for the foreign-born population - Serbia (%)
Place of birth for the foreign-born population - Ukraine (%)
Place of birth for the foreign-born population - Other Eastern Europe (%)
Place of birth for the foreign-born population - China (%)
Place of birth for the foreign-born population - Hong Kong (%)
Place of birth for the foreign-born population - Taiwan (%)
Place of birth for the foreign-born population - Japan (%)
Place of birth for the foreign-born population - Korea (%)
Place of birth for the foreign-born population - Other Eastern Asia (%)
Place of birth for the foreign-born population - Afghanistan (%)
Place of birth for the foreign-born population - Bangladesh (%)
Place of birth for the foreign-born population - India (%)
Place of birth for the foreign-born population - Iran (%)
Place of birth for the foreign-born population - Kazakhstan (%)
Place of birth for the foreign-born population - Nepal (%)
Place of birth for the foreign-born population - Pakistan (%)
Place of birth for the foreign-born population - Sri Lanka (%)
Place of birth for the foreign-born population - Uzbekistan (%)
Place of birth for the foreign-born population - Other South Central Asia (%)
Place of birth for the foreign-born population - Burma (%)
Place of birth for the foreign-born population - Cambodia (%)
Place of birth for the foreign-born population - Indonesia (%)
Place of birth for the foreign-born population - Laos (%)
Place of birth for the foreign-born population - Malaysia (%)
Place of birth for the foreign-born population - Philippines (%)
Place of birth for the foreign-born population - Singapore (%)
Place of birth for the foreign-born population - Thailand (%)
Place of birth for the foreign-born population - Vietnam (%)
Place of birth for the foreign-born population - Other South Eastern Asia (%)
Place of birth for the foreign-born population - Armenia (%)
Place of birth for the foreign-born population - Iraq (%)
Place of birth for the foreign-born population - Israel (%)
Place of birth for the foreign-born population - Jordan (%)
Place of birth for the foreign-born population - Kuwait (%)
Place of birth for the foreign-born population - Lebanon (%)
Place of birth for the foreign-born population - Saudi Arabia (%)
Place of birth for the foreign-born population - Syria (%)
Place of birth for the foreign-born population - Turkey (%)
Place of birth for the foreign-born population - Yemen (%)
Place of birth for the foreign-born population - Other Western Asia (%)
Place of birth for the foreign-born population - Eritrea (%)
Place of birth for the foreign-born population - Ethiopia (%)
Place of birth for the foreign-born population - Kenya (%)
Place of birth for the foreign-born population - Somalia (%)
Place of birth for the foreign-born population - Uganda (%)
Place of birth for the foreign-born population - Zimbabwe (%)
Place of birth for the foreign-born population - Other Eastern Africa (%)
Place of birth for the foreign-born population - Cameroon (%)
Place of birth for the foreign-born population - Congo (%)
Place of birth for the foreign-born population - Democratic Republic of Congo (Zaire) (%)
Place of birth for the foreign-born population - Other Middle Africa (%)
Place of birth for the foreign-born population - Egypt (%)
Place of birth for the foreign-born population - Morocco (%)
Place of birth for the foreign-born population - Sudan (%)
Place of birth for the foreign-born population - Other Northern Africa (%)
Place of birth for the foreign-born population - South Africa (%)
Place of birth for the foreign-born population - Other Southern Africa (%)
Place of birth for the foreign-born population - Cabo Verde (%)
Place of birth for the foreign-born population - Ghana (%)
Place of birth for the foreign-born population - Liberia (%)
Place of birth for the foreign-born population - Nigeria (%)
Place of birth for the foreign-born population - Senegal (%)
Place of birth for the foreign-born population - Sierra Leone (%)
Place of birth for the foreign-born population - Other Western Africa (%)
Place of birth for the foreign-born population - Australia (%)
Place of birth for the foreign-born population - New Zealand (%)
Place of birth for the foreign-born population - Fiji (%)
Place of birth for the foreign-born population - Micronesia (%)
Place of birth for the foreign-born population - Bahamas (%)
Place of birth for the foreign-born population - Barbados (%)
Place of birth for the foreign-born population - Cuba (%)
Place of birth for the foreign-born population - Dominica (%)
Place of birth for the foreign-born population - Dominican Republic (%)
Place of birth for the foreign-born population - Grenada (%)
Place of birth for the foreign-born population - Haiti (%)
Place of birth for the foreign-born population - Jamaica (%)
Place of birth for the foreign-born population - St. Vincent and the Grenadines (%)
Place of birth for the foreign-born population - Trinidad and Tobago (%)
Place of birth for the foreign-born population - West Indies (%)
Place of birth for the foreign-born population - Other Caribbean (%)
Place of birth for the foreign-born population - Belize (%)
Place of birth for the foreign-born population - Costa Rica (%)
Place of birth for the foreign-born population - El Salvador (%)
Place of birth for the foreign-born population - Guatemala (%)
Place of birth for the foreign-born population - Honduras (%)
Place of birth for the foreign-born population - Mexico (%)
Place of birth for the foreign-born population - Nicaragua (%)
Place of birth for the foreign-born population - Panama (%)
Place of birth for the foreign-born population - Other Central America (%)
Place of birth for the foreign-born population - Argentina (%)
Place of birth for the foreign-born population - Bolivia (%)
Place of birth for the foreign-born population - Brazil (%)
Place of birth for the foreign-born population - Chile (%)
Place of birth for the foreign-born population - Colombia (%)
Place of birth for the foreign-born population - Ecuador (%)
Place of birth for the foreign-born population - Guyana (%)
Place of birth for the foreign-born population - Peru (%)
Place of birth for the foreign-born population - Uruguay (%)
Place of birth for the foreign-born population - Venezuela (%)
Place of birth for the foreign-born population - Other South America (%)
Place of birth for the foreign-born population - Canada (%)
Place of birth for the foreign-born population - Other Northern America (%)
Place of birth for the foreign-born population - Other (%)
Latest news about races in Ramona, CA collected exclusively by city-data.com from local newspapers, TV, and radio stations
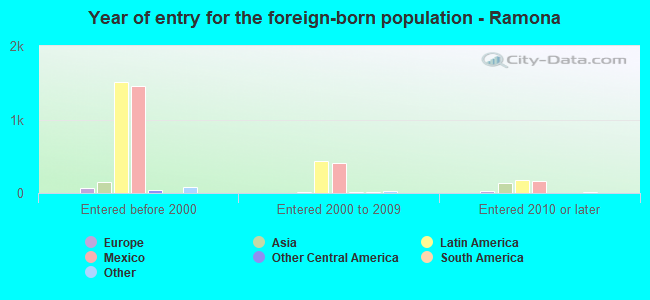
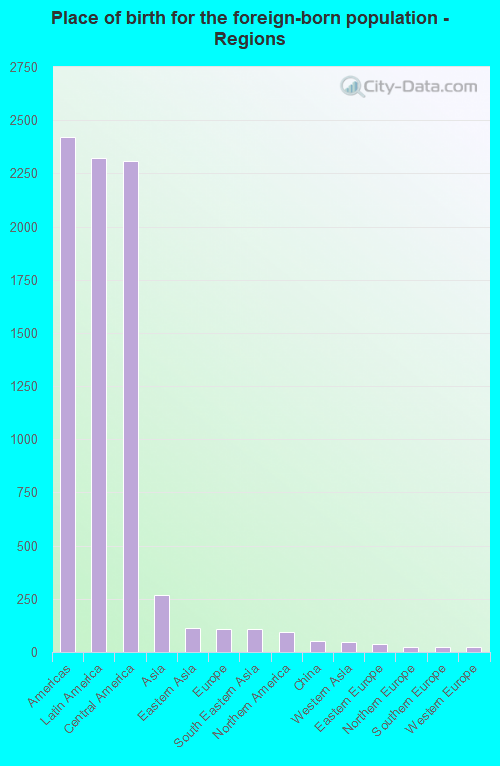
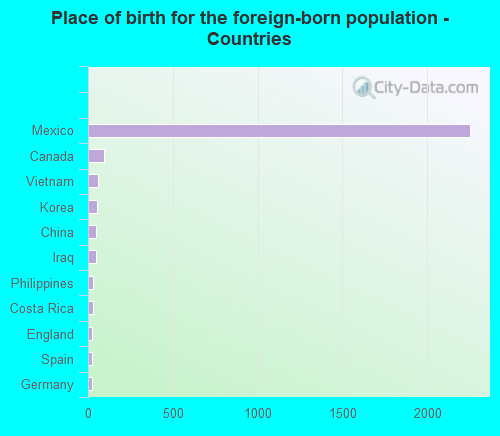
According to 2022 data, the most numerous races in Ramona, CA are Hispanic (7,989 residents), White alone (11,578 residents), and Asian alone (360 residents). 75.5% of Ramona residents speak English at home. 13.1% of Ramona, CA residents are foreign-born (10.8% born in Latin America), which is 98.1% less than the foreign-born rate of 26.0% across the entire state of California.
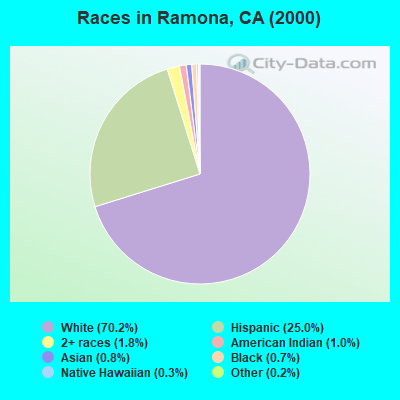
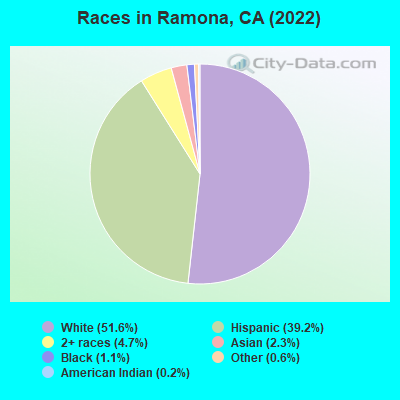
Race distribution in Ramona
2000 2022
15,816,790 46.7% White alone 10,966,556 32.4% Hispanic 3,648,860 10.8% Asian alone 2,181,926 6.4% Black alone 903,115 2.7% Two or more races 178,984 0.5% American Indian alone 103,736 0.3% Native Hawaiian and Other 71,681 0.2% Other race alone
15,732,184 40.3% Hispanic 13,160,426 33.7% White alone 5,957,867 15.3% Asian alone 2,025,218 5.2% Black alone 1,663,222 4.3% Two or more races 251,618 0.6% Other race alone 135,777 0.3% Native Hawaiian and Other 103,030 0.3% American Indian alone
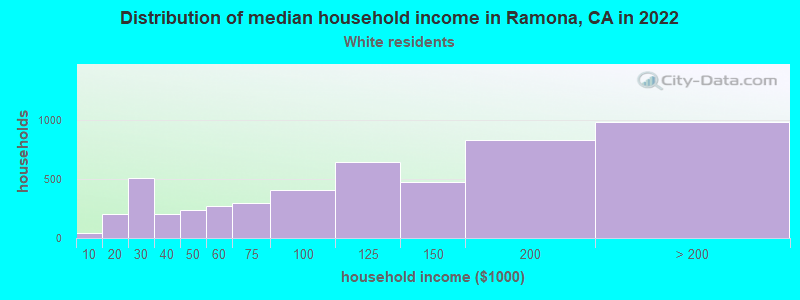
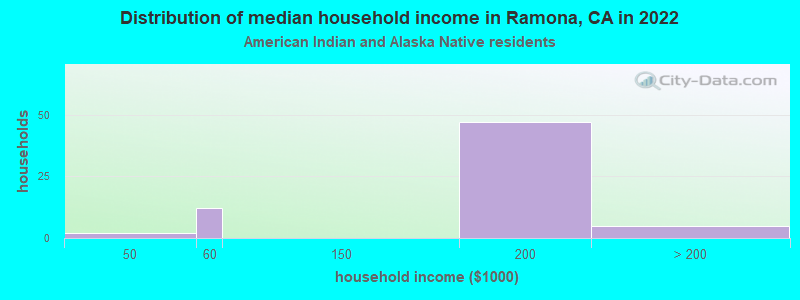
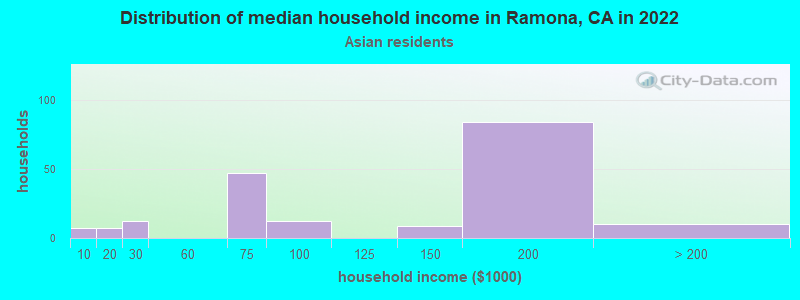
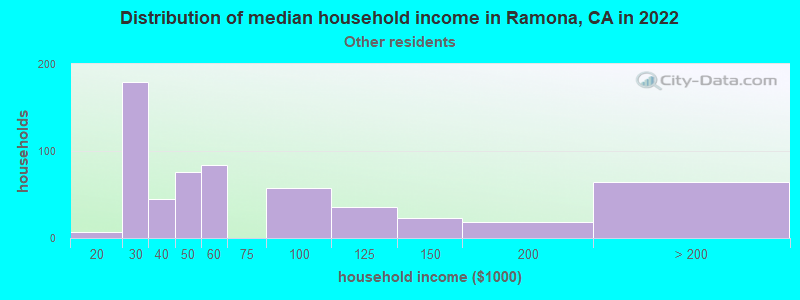
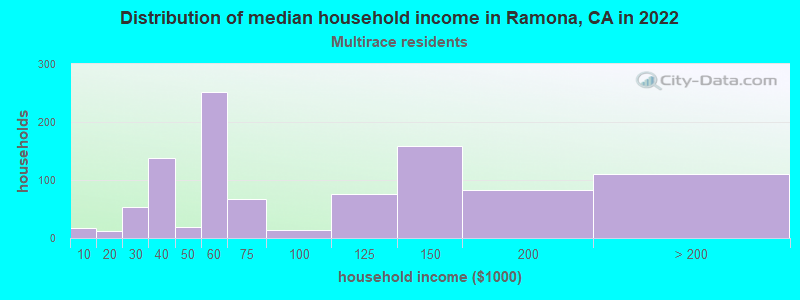
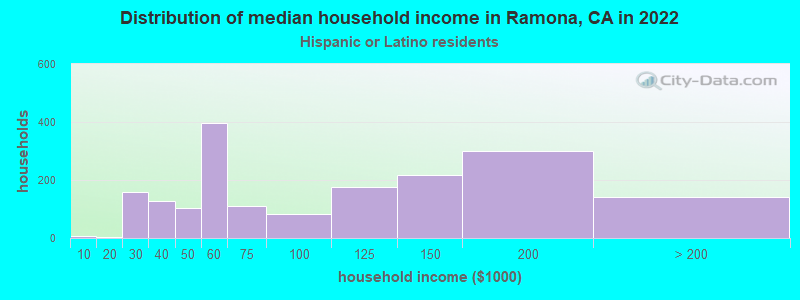
Income and house value in Ramona Median household income in 2022 $108,726 White non-Hispanic householders$87,001 Black householders$153,966 American Indian and Alaska Native householders$147,022 Asian householders$114,632 Native Hawaiian and other Pacific Islander householders$97,772 Some other race householders$118,342 Two or more races householders$116,834 Hispanic or Latino race householdersMedian 2022 house value $788,605 White Non-Hispanic householders$809,841 Black or African American householders$579,126 American Indian or Alaska Native householders $681,706 Asian householders$609,000 Native Hawaiian and other Pacific Islander householders$749,733 Some other race householders$807,682 Two or more races householders$669,109 Hispanic or Latino householders
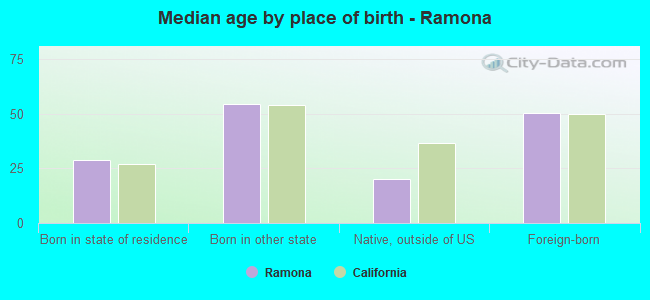
Median age by race in Ramona
40.5 Median age for White residents40.3 41.3 60.2 Median age for Black or African American residents11.3 Median age for American Indian / Alaska Native residents35.5 Median age for Asian residents31.4 41.6 46.9 Median age for Native Hawaiian / Pacific Islander residents36.3 Median age for Other race residents34.3 47.9 23.7 Median age for Two or more races residents35.2 17.5 47.0 Median age for White alone residents44.4 48.0 29.5 Median age for Hispanic or Latino residents30.3 28.7
Owner/renter occupied households by race in Ramona
House owners and renters - White residents 3,515 68.7% Owner occupied1,604 31.3% Renter occupiedHouse owners and renters - Black or African American residents 18 100.0% Renter occupiedHouse owners and renters - American Indian / Alaska Native residents 39 100.0% Owner occupiedHouse owners and renters - Asian residents 105 93.4% Owner occupied7 6.6% Renter occupiedHouse owners and renters - Native Hawaiian / Pacific Islander residents 34 100.0% Renter occupiedHouse owners and renters - Other race residents 364 70.9% Owner occupied149 29.1% Renter occupiedHouse owners and renters - Two or more races residents 333 76.0% Owner occupied105 24.0% Renter occupiedHouse owners and renters - White alone residents 3,313 73.0% Owner occupied1,224 27.0% Renter occupiedHouse owners and renters - Hispanic or Latino residents 892 52.8% Owner occupied796 47.2% Renter occupied
Language usage in Ramona
English speakers - Total 75.5% of residents of Ramona speak English at home.
22.5% of residents speak Spanish at home 3,043 67.5% Speak English very well1,463 32.5% Speak English less than very well2.1% of residents speak other language at home 233 54.2% Speak English very well197 45.8% Speak English less than very well
English speakers - Born in the United States 96.0% of residents of Ramona speak English at home.
3.3% of residents speak Spanish at home 135 82.3% Speak English very well29 17.7% Speak English less than very well0.3% of residents speak other language at home 16 100.0% Speak English very well
English speakers - Native, born elsewhere 70.1% of residents of Ramona speak English at home.
30.9% of residents speak Spanish at home 90 100.0% Speak English very well
English speakers - Foreign-born 19.4% of residents of Ramona speak English at home.
70.1% of residents speak Spanish at home 644 33.8% Speak English very well1,264 66.2% Speak English less than very well9.6% of residents speak other language at home 66 25.3% Speak English very well195 74.7% Speak English less than very well
White (Caucasian) - Speak only English Native:
90.7% (11,567)Foreign-born:
28.5% (369)
White (Caucasian) - Speak another language Native:
11.0% (1,398)Foreign-born:
75.0% (972)
Asian - Speak only English Native:
66.6% (108)Foreign-born:
11.4% (23)
Asian - Speak another language Native:
32.8% (53)Foreign-born:
88.3% (178)
Other race - Speak only English Native:
79.3% (1,220)Foreign-born:
17.4% (85)
Other race - Speak another language Native:
30.9% (475)Foreign-born:
86.7% (424)
Two or more races - Speak only English Native:
70.5% (1,551)Foreign-born:
70.4% (82)
White alone - Speak only English Native:
98.4% (10,579)Foreign-born:
75.3% (194)
White alone - Speak another language Native:
1.3% (143)Foreign-born:
24.4% (63)
Hispanic or Latino - Speak only English Native:
54.7% (2,926)Foreign-born:
18.0% (372)
Hispanic or Latino - Speak another language Native:
47.2% (2,529)Foreign-born:
86.5% (1,792)
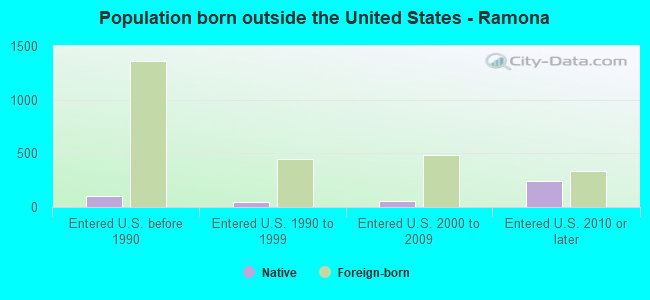
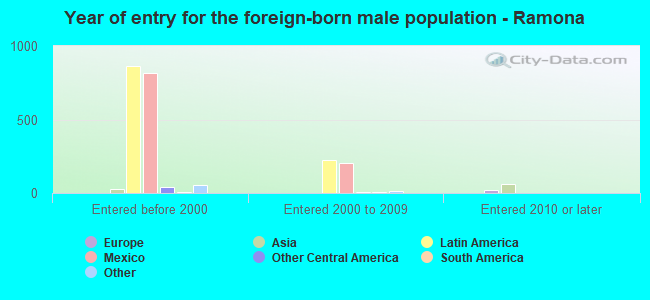
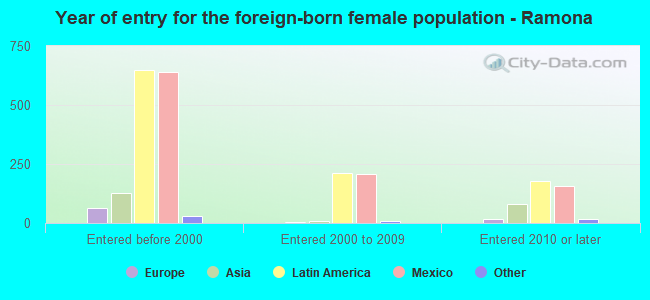
Foreign-born residents in Ramona 2,823 residents are foreign born (10.8% Latin America ).
This city:
13.1%California:
100.0%
Marital status for residents in Ramona Marital status - White (Caucasian) population 15 years and over
Males 35.7% Never married50.6% Now married1.9% Separated1.2% Widowed10.6% DivorcedFemales 27.7% Never married51.0% Now married0.8% Separated7.9% Widowed12.5% DivorcedWomen who gave birth in the past 12 months Now married:
83.6% (144)Unmarried:
16.4% (28)
Women who did not give birth in the past 12 months Now married:
42.0% (1,257)Unmarried:
58.0% (1,735)
Marital status - Black or African American population 15 years and over
Males 37.0% Never married45.0% Now married0.0% Separated18.0% Widowed0.0% DivorcedFemales 41.4% Never married58.6% Now married0.0% Separated0.0% Widowed0.0% DivorcedWomen who did not give birth in the past 12 months Now married:
0.0% (0)Unmarried:
100.0% (11)
Marital status - American Indian / Alaska Native population 15 years and over
Males 0.0% Never married100.0% Now married0.0% Separated0.0% Widowed0.0% DivorcedFemales 0.0% Never married0.0% Now married0.0% Separated100.0% Widowed0.0% DivorcedWomen who did not give birth in the past 12 months Now married:
0.0% (0)Unmarried:
100.0% (24)
Marital status - Asian population 15 years and over
Males 30.9% Never married61.9% Now married0.0% Separated0.0% Widowed7.2% DivorcedFemales 24.3% Never married61.8% Now married0.0% Separated13.9% Widowed0.0% DivorcedWomen who gave birth in the past 12 months Now married:
100.0% (8)Unmarried:
0.0% (0)
Women who did not give birth in the past 12 months Now married:
61.5% (70)Unmarried:
38.5% (44)
Marital status - Other race population 15 years and over
Males 69.3% Never married29.6% Now married1.1% Separated0.0% Widowed0.0% DivorcedFemales 24.0% Never married47.8% Now married1.6% Separated8.3% Widowed18.3% DivorcedWomen who did not give birth in the past 12 months Now married:
63.4% (270)Unmarried:
36.6% (156)
Marital status - Two or more races population 15 years and over
Males 31.1% Never married55.8% Now married0.0% Separated8.7% Widowed4.4% DivorcedFemales 28.8% Never married39.3% Now married0.0% Separated4.5% Widowed27.3% DivorcedWomen who did not give birth in the past 12 months Now married:
36.6% (188)Unmarried:
63.4% (325)
Marital status - White alone, not Hispanic / Latino population 15 years and over
Males 29.1% Never married54.3% Now married2.4% Separated1.8% Widowed12.4% DivorcedFemales 23.2% Never married52.2% Now married0.7% Separated9.2% Widowed14.8% DivorcedWomen who gave birth in the past 12 months Now married:
100.0% (137)Unmarried:
0.0% (0)
Women who did not give birth in the past 12 months Now married:
41.3% (946)Unmarried:
58.7% (1,346)
Marital status - Hispanic or Latino population 15 years and over
Males 55.8% Never married38.6% Now married1.0% Separated0.0% Widowed4.6% DivorcedFemales 36.9% Never married48.0% Now married1.3% Separated5.4% Widowed8.4% DivorcedWomen who gave birth in the past 12 months Now married:
47.8% (34)Unmarried:
52.2% (37)
Women who did not give birth in the past 12 months Now married:
49.0% (862)Unmarried:
51.0% (895)
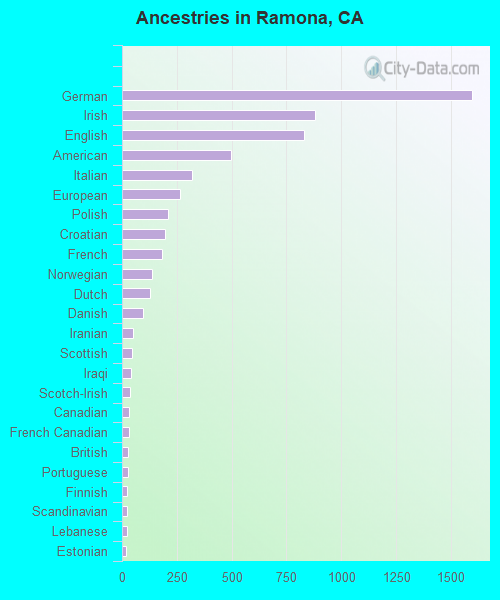
Ancestries in Ramona
850 7.9% Irish773 7.2% German620 5.8% English450 4.2% American308 2.9% European269 2.5% Italian152 1.4% British78 0.7% Scottish76 0.7% Norwegian67 0.6% Polish56 0.5% Iraqi49 0.5% Northern European45 0.4% French44 0.4% Canadian39 0.4% French Canadian38 0.4% Scotch-Irish37 0.3% Czech33 0.3% Lebanese33 0.3% Portuguese31 0.3% Danish26 0.2% Swedish25 0.2% Scandinavian22 0.2% Dutch21 0.2% Sudanese18 0.2% Finnish9 0.08% Russian8 0.07% Swiss5 0.05% Austrian5 0.05% Czechoslovakian3 0.03% Welsh3 0.03% Yugoslavian1 0.01% Arab
Geographical mobility in Ramona Same house 1 year ago 13,426 92.4% White (Caucasian)118 95.8% Black or African American84 100.0% American Indian / Alaska Native315 85.1% Asian34 100.0% Native Hawaiian / Pacific Islander1,613 82.6% Other race2,439 100.0% Two or more races10,410 90.1% White alone, not Hispanic / Latino6,903 88.8% Hispanic or LatinoMoved within same county 1,016 7.0% White / Caucasian7 5.7% Black or African American56 15.0% Asian267 13.7% Other race96 3.9% Two or more races976 8.4% White alone, not Hispanic / Latino787 10.1% Hispanic or LatinoMoved within same state 109 0.7% White / Caucasian78 0.7% White alone, not Hispanic / Latino29 0.4% Hispanic or LatinoMoved from different state 68 0.5% White / Caucasian84 0.7% White alone, not Hispanic / LatinoMoved from abroad 5 0.0% White8 0.1% White alone, not Hispanic / Latino
Children Nativity (place of birth) in Ramona
Children under 6 years - Living with two parents Both parents native 791 100.0% NativeBoth parents foreign-born 23 100.0% NativeOne native, one foreign-born parent 147 100.0% NativeChildren under 6 years - Living with one parent Native parent 406 100.0% NativeForeign-born parent 23 36.8% Native40 63.2% Foreign-bornChildren 6 to 17 years - Living with two parents Both parents native 1,143 100.0% NativeBoth parents foreign-born 324 94.6% Native19 5.4% Foreign-bornOne native, one foreign-born parent 310 100.0% NativeChildren 6 to 17 years - Living with one parent Native parent 661 100.0% NativeForeign-born parent 318 51.4% Native300 48.6% Foreign-born
Grandparents responsible for own grandchildren in Ramona
Grandparents (30 to 59 years) White / Caucasian 111 47.8% Responsible for grandchildren122 52.2% Not responsible for grandchildrenAmerican Indian / Alaska Native 22 100.0% Not responsible for grandchildrenWhite alone, not Hispanic / Latino 12 23.8% Responsible for grandchildren37 76.2% Not responsible for grandchildrenHispanic or Latino 140 48.1% Responsible for grandchildren151 51.9% Not responsible for grandchildrenGrandparents (60 years and over) White / Caucasian 35 17.1% Responsible for grandchildren168 82.9% Not responsible for grandchildrenWhite alone, not Hispanic / Latino 12 9.3% Responsible for grandchildren121 90.7% Not responsible for grandchildrenHispanic or Latino 32 22.1% Responsible for grandchildren113 77.9% Not responsible for grandchildren