Estimated zip code population in 2022: 36,530 Zip code population in 2010: 35,414 Zip code population in 2000: 33,087
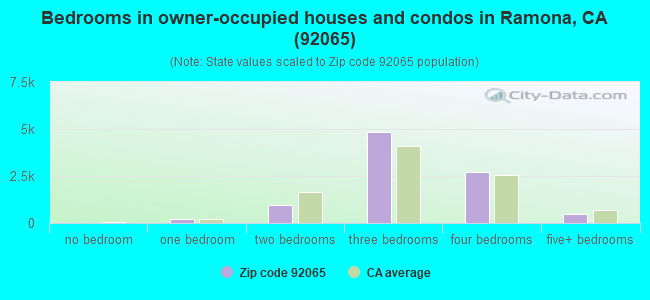
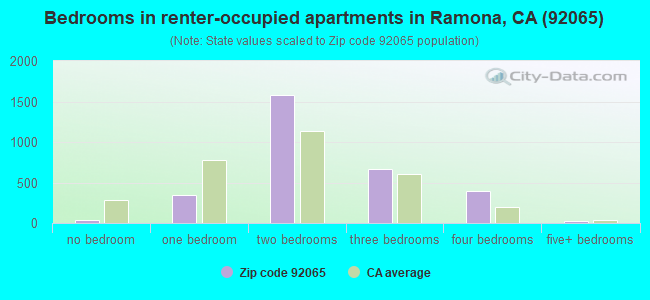
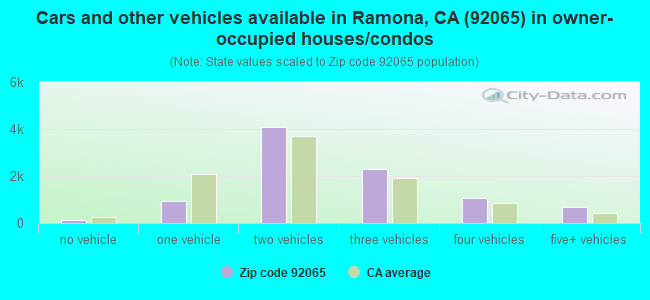
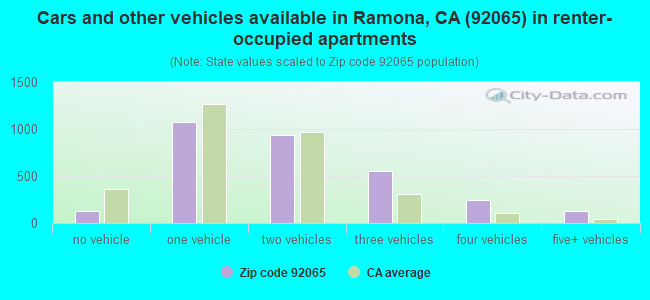
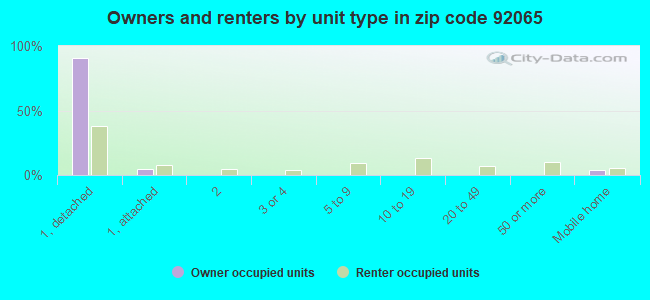
Houses and condos: 12,986 Renter-occupied apartments: 3,060
% of renters here:
25%
State:
44%
March 2022 cost of living index in zip code 92065: 119.9 (more than average, U.S. average is 100)
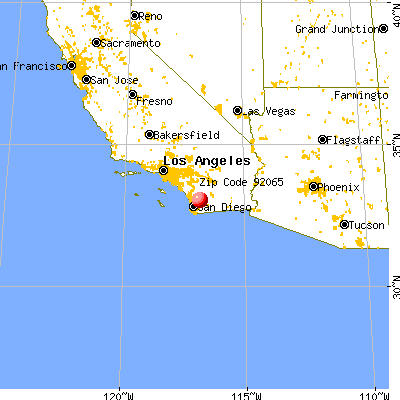
Land area: 165.2 sq. mi. Water area: 0.5 sq. mi.
Population density: 221 people per square mile
(very low).
OSM Map
General Map
Google Map
MSN Map
OSM Map
General Map
Google Map
MSN Map
OSM Map
General Map
Google Map
MSN Map
OSM Map
General Map
Google Map
MSN Map
Please wait while loading the map...
Real estate property taxes paid for housing units in 2022:
This zip code:
0.7% ($5,365)
California:
0.7% ($4,831)
Median real estate property taxes paid for housing units with mortgages in 2022: $5,893 (0.8%) Median real estate property taxes paid for housing units with no mortgage in 2022: $3,453 (0.5%)
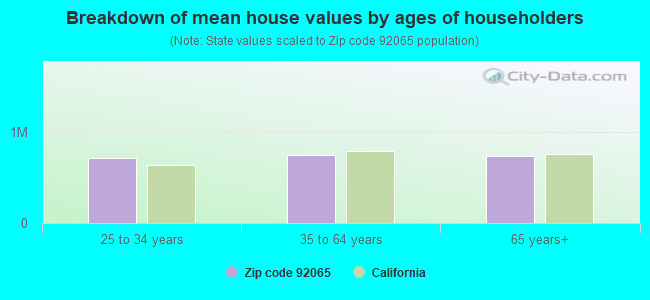
Estimated median house/condo value in 2022: $737,074
92065:
$737,074
California:
$715,900
According to our research of California and other state lists, there were 28 registered sex offenders living in 92065 zip code as of May 11, 2024. The ratio of all residents to sex offenders in zip code 92065 is 1,363 to 1. The ratio of registered sex offenders to all residents in this zip code is lower than the state average.
Median resident age:
This zip code:
40.9 years
California median age:
37.9 years
Average household size:
This zip code:
2.9 people
California:
2.8 people
Averages for the 2020 tax year for zip code 92065, filed in 2021:
Average Adjusted Gross Income (AGI) in 2020: $82,972 (Individual Income Tax Returns)
Here:
$82,972
State:
$95,910
Salary/wage: $72,041 (reported on 80.6% of returns)
Here:
$72,041
State:
$77,331
(% of AGI for various income ranges: 1241.1% for AGIs below $25k, 3806.5% for AGIs $25k-50k, 6700.6% for AGIs $50k-75k, 9910.6% for AGIs $75k-100k, 19680.9% for AGIs $100k-200k, 64449.3% for AGIs over 200k)
Taxable interest for individuals: $953 (reported on 40.8% of returns)
This zip code:
$953
California:
$2,294
(% of AGI for various income ranges: 13.6% for AGIs below $25k, 25.8% for AGIs $25k-50k, 43.4% for AGIs $50k-75k, 71.2% for AGIs $75k-100k, 82.1% for AGIs $100k-200k, 611.8% for AGIs over 200k)
Ordinary dividends: $6,079 (reported on 19.2% of returns)
Here:
$6,079
State:
$10,949
(% of AGI for various income ranges: 30.0% for AGIs below $25k, 44.4% for AGIs $25k-50k, 108.3% for AGIs $50k-75k, 158.1% for AGIs $75k-100k, 262.5% for AGIs $100k-200k, 2286.8% for AGIs over 200k)
Net capital gain/loss in AGI: +$19,955 (reported on 18.7% of returns)
Here:
+$19,955
State:
+$49,306
(% of AGI for various income ranges: 11.3% for AGIs below $25k, 34.9% for AGIs $25k-50k, 83.7% for AGIs $50k-75k, 215.4% for AGIs $75k-100k, 597.1% for AGIs $100k-200k, 11446.6% for AGIs over 200k)
Profit/loss from business: +$13,670 (reported on 17.1% of returns)
Here:
+$13,670
State:
+$15,671
(% of AGI for various income ranges: 170.5% for AGIs below $25k, 211.2% for AGIs $25k-50k, 273.0% for AGIs $50k-75k, 306.6% for AGIs $75k-100k, 573.5% for AGIs $100k-200k, 2606.8% for AGIs over 200k)
Taxable individual retirement arrangement distribution: $22,130 (reported on 9.3% of returns)
92065:
$22,130
California:
$23,505
(% of AGI for various income ranges: 53.3% for AGIs below $25k, 112.9% for AGIs $25k-50k, 262.3% for AGIs $50k-75k, 432.5% for AGIs $75k-100k, 668.9% for AGIs $100k-200k, 2212.5% for AGIs over 200k)
Self-employed (Keogh) retirement plans: $27,250 (reported on 0.4% of returns)
92065:
$27,250
California:
$30,163
(% of AGI for various income ranges: 38.6% for AGIs $100k-200k, 318.2% for AGIs over 200k)
Total itemized deductions: $32,574 (reported on 20.5% of returns)
Here:
$32,574
State:
$39,517
(% of AGI for various income ranges: 114.7% for AGIs below $25k, 262.4% for AGIs $25k-50k, 653.7% for AGIs $50k-75k, 1256.0% for AGIs $75k-100k, 2558.2% for AGIs $100k-200k, 7548.6% for AGIs over 200k)
Charity contributions: $5,342 (reported on 16.1% of returns)
Here:
$5,342
State:
$12,598
(% of AGI for various income ranges: 5.0% for AGIs below $25k, 23.1% for AGIs $25k-50k, 52.3% for AGIs $50k-75k, 127.7% for AGIs $75k-100k, 340.2% for AGIs $100k-200k, 1253.4% for AGIs over 200k)
Taxes paid: $8,858 (reported on 20.5% of returns)
92065:
$8,858
State:
$8,807
(% of AGI for various income ranges: 22.6% for AGIs below $25k, 62.8% for AGIs $25k-50k, 171.6% for AGIs $50k-75k, 377.8% for AGIs $75k-100k, 771.1% for AGIs $100k-200k, 1745.9% for AGIs over 200k)
Earned income credit: $1,941 (reported on 10.7% of returns)
Here:
$1,941
State:
$2,074
(% of AGI for various income ranges: 68.3% for AGIs below $25k, 58.2% for AGIs $25k-50k, 1.4% for AGIs $50k-75k)
Percentage of individuals using paid preparers for their 2020 taxes: 92.7%
Here:
93%
State:
92%
(% for various income ranges: 89.8% for AGIs below $25k, 91.8% for AGIs $25k-50k, 94.3% for AGIs $50k-75k, 93.7% for AGIs $75k-100k, 94.8% for AGIs $100k-200k, 95.5% for AGIs over 200k)
Averages for the 2012 tax year for zip code 92065, filed in 2013:
Average Adjusted Gross Income (AGI) in 2012: $69,286 (Individual Income Tax Returns)
Here:
$69,286
State:
$72,726
Salary/wage: $60,931 (reported on 82.8% of returns)
Here:
$60,931
State:
$59,079
(% of AGI for various income ranges: 72.8% for AGIs below $25k, 76.9% for AGIs $25k-50k, 74.1% for AGIs $50k-75k, 75.7% for AGIs $75k-100k, 77.0% for AGIs $100k-200k, 61.5% for AGIs over 200k)
Taxable interest for individuals: $1,035 (reported on 41.4% of returns)
This zip code:
$1,035
California:
$2,146
(% of AGI for various income ranges: 1.0% for AGIs below $25k, 0.7% for AGIs $25k-50k, 0.6% for AGIs $50k-75k, 0.6% for AGIs $75k-100k, 0.5% for AGIs $100k-200k, 0.6% for AGIs over 200k)
Ordinary dividends: $4,048 (reported on 19.4% of returns)
Here:
$4,048
State:
$9,308
(% of AGI for various income ranges: 1.4% for AGIs below $25k, 1.1% for AGIs $25k-50k, 1.1% for AGIs $50k-75k, 1.0% for AGIs $75k-100k, 0.8% for AGIs $100k-200k, 1.7% for AGIs over 200k)
Net capital gain/loss in AGI: +$12,246 (reported on 16.7% of returns)
Here:
+$12,246
State:
+$30,460
(% of AGI for various income ranges: 0.1% for AGIs $25k-50k, 0.3% for AGIs $50k-75k, 0.5% for AGIs $75k-100k, 1.1% for AGIs $100k-200k, 11.4% for AGIs over 200k)
Profit/loss from business: +$13,259 (reported on 18.2% of returns)
Here:
+$13,259
State:
+$17,064
(% of AGI for various income ranges: 10.3% for AGIs below $25k, 4.6% for AGIs $25k-50k, 4.0% for AGIs $50k-75k, 3.3% for AGIs $75k-100k, 2.4% for AGIs $100k-200k, 2.6% for AGIs over 200k)
Taxable individual retirement arrangement distribution: $17,948 (reported on 9.9% of returns)
92065:
$17,948
California:
$19,557
(% of AGI for various income ranges: 2.9% for AGIs below $25k, 2.7% for AGIs $25k-50k, 2.8% for AGIs $50k-75k, 2.6% for AGIs $75k-100k, 3.0% for AGIs $100k-200k, 1.4% for AGIs over 200k)
Self-employment retirement plans: $21,233 (reported on 0.6% of returns)
92065:
$21,233
California:
$24,530
(% of AGI for various income ranges: 0.3% for AGIs $50k-75k, 0.1% for AGIs $100k-200k, 0.4% for AGIs over 200k)
Total itemized deductions: $29,436 (26% of AGI, reported on 46.3% of returns)
Here:
$29,436
State:
$34,004
Here:
25.9% of AGI
State:
22.7% of AGI
(% of AGI for various income ranges: 15.7% for AGIs below $25k, 15.6% for AGIs $25k-50k, 21.1% for AGIs $50k-75k, 21.3% for AGIs $75k-100k, 21.3% for AGIs $100k-200k, 18.2% for AGIs over 200k)
Charity contributions: $3,102 (reported on 37.6% of returns)
Here:
$3,102
State:
$4,659
(% of AGI for various income ranges: 0.8% for AGIs below $25k, 1.1% for AGIs $25k-50k, 1.7% for AGIs $50k-75k, 1.7% for AGIs $75k-100k, 1.9% for AGIs $100k-200k, 1.8% for AGIs over 200k)
Taxes paid: $10,415 (reported on 46.1% of returns)
92065:
$10,415
State:
$14,448
(% of AGI for various income ranges: 3.8% for AGIs below $25k, 3.6% for AGIs $25k-50k, 5.1% for AGIs $50k-75k, 6.6% for AGIs $75k-100k, 8.0% for AGIs $100k-200k, 9.0% for AGIs over 200k)
Earned income credit: $2,073 (reported on 13.5% of returns)
Here:
$2,073
State:
$2,286
(% of AGI for various income ranges: 4.9% for AGIs below $25k, 1.1% for AGIs $25k-50k)
Percentage of individuals using paid preparers for their 2012 taxes: 59.0%
Here:
59%
State:
64%
(% for various income ranges: 53.3% for AGIs below $25k, 57.7% for AGIs $25k-50k, 62.7% for AGIs $50k-75k, 62.9% for AGIs $75k-100k, 63.0% for AGIs $100k-200k, 70.3% for AGIs over 200k)
Averages for the 2004 tax year for zip code 92065, filed in 2005:
Average Adjusted Gross Income (AGI) in 2004: $58,938 (Individual Income Tax Returns)
Here:
$58,938
State:
$58,600
Salary/wage: $54,007 (reported on 83.8% of returns)
Here:
$54,007
State:
$49,455
(% of AGI for various income ranges: 252.4% for AGIs below $10k, 75.9% for AGIs $10k-25k, 78.6% for AGIs $25k-50k, 79.4% for AGIs $50k-75k, 81.9% for AGIs $75k-100k, 72.1% for AGIs over 100k)
Taxable interest for individuals: $1,473 (reported on 54.3% of returns)
This zip code:
$1,473
California:
$2,365
(% of AGI for various income ranges: 13.4% for AGIs below $10k, 2.0% for AGIs $10k-25k, 1.3% for AGIs $25k-50k, 1.3% for AGIs $50k-75k, 0.9% for AGIs $75k-100k, 1.3% for AGIs over 100k)
Taxable dividends: $2,175 (reported on 24.1% of returns)
Here:
$2,175
State:
$4,746
(% of AGI for various income ranges: 10.2% for AGIs below $10k, 1.5% for AGIs $10k-25k, 1.1% for AGIs $25k-50k, 0.9% for AGIs $50k-75k, 0.6% for AGIs $75k-100k, 0.8% for AGIs over 100k)
Net capital gain/loss: +$16,938 (reported on 20.9% of returns)
Here:
+$16,938
State:
+$23,418
(% of AGI for various income ranges: 1.8% for AGIs below $10k, 0.5% for AGIs $10k-25k, 0.7% for AGIs $25k-50k, 1.1% for AGIs $50k-75k, 1.1% for AGIs $75k-100k, 11.3% for AGIs over 100k)
Profit/loss from business: +$14,393 (reported on 19.4% of returns)
Here:
+$14,393
State:
+$16,826
(% of AGI for various income ranges: 11.5% for AGIs below $10k, 7.7% for AGIs $10k-25k, 5.6% for AGIs $25k-50k, 4.9% for AGIs $50k-75k, 4.5% for AGIs $75k-100k, 4.1% for AGIs over 100k)
IRA payment deduction: $3,267 (reported on 3.0% of returns)
92065:
$3,267
California:
$3,192
(% of AGI for various income ranges: 1.2% for AGIs below $10k, 0.2% for AGIs $10k-25k, 0.3% for AGIs $25k-50k, 0.2% for AGIs $50k-75k, 0.2% for AGIs $75k-100k, 0.1% for AGIs over 100k)
Self-employed pension: $12,240 (reported on 1.3% of returns)
Here:
$12,240
California:
$17,688
(% of AGI for various income ranges: 0.8% for AGIs below $10k, 0.1% for AGIs $25k-50k, 0.1% for AGIs $50k-75k, 0.3% for AGIs $75k-100k, 0.4% for AGIs over 100k)
Total itemized deductions: $27,915 (30% of AGI, reported on 50.1% of returns)
Here:
$27,915
State:
$28,113
Here:
29.7% of AGI
State:
25.3% of AGI
(% of AGI for various income ranges: 79.9% for AGIs below $10k, 16.7% for AGIs $10k-25k, 21.9% for AGIs $25k-50k, 26.9% for AGIs $50k-75k, 27.2% for AGIs $75k-100k, 22.3% for AGIs over 100k)
Charity contributions deductions: $2,821 (3% of AGI, reported on 43.6% of returns)
Here:
$2,821
State:
$3,923
Here:
2.9% of AGI
State:
3.3% of AGI
(% of AGI for various income ranges: 3.1% for AGIs below $10k, 1.3% for AGIs $10k-25k, 1.8% for AGIs $25k-50k, 2.3% for AGIs $50k-75k, 2.3% for AGIs $75k-100k, 2.1% for AGIs over 100k)
Total tax: $8,460 (reported on 78.8% of returns)
92065:
$8,460
State:
$10,761
(% of AGI for various income ranges: 10.3% for AGIs below $10k, 4.6% for AGIs $10k-25k, 6.7% for AGIs $25k-50k, 7.6% for AGIs $50k-75k, 8.7% for AGIs $75k-100k, 15.3% for AGIs over 100k)
Earned income credit: $1,648 (reported on 10.0% of returns)
Here:
$1,648
State:
$1,763
Percentage of individuals using paid preparers for their 2004 taxes: 61.3%
Here:
61%
State:
66%
(% for various income ranges: 46.8% for AGIs below $10k, 59.1% for AGIs $10k-25k, 63.6% for AGIs $25k-50k, 67.6% for AGIs $50k-75k, 64.0% for AGIs $75k-100k, 68.3% for AGIs over 100k)
Likely homosexual households (counted as self-reported same-sex unmarried-partner households)
Lesbian couples: 0.1% of all households
Gay men: 0.1% of all households
Household received Food Stamps/SNAP in the past 12 months: 762 Household did not receive Food Stamps/SNAP in the past 12 months: 11,391
Women who had a birth in the past 12 months: 457 (347 now married, 109 unmarried) Women who did not have a birth in the past 12 months: 7,917 (3,768 now married, 4,122 unmarried)
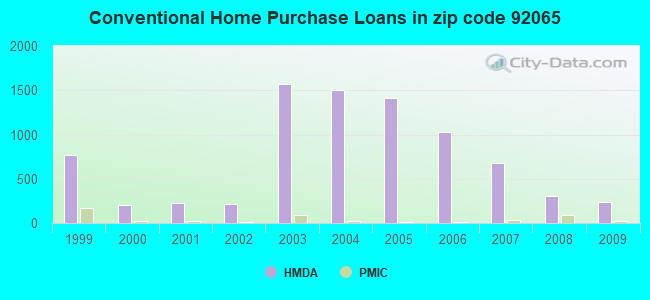
Housing units in zip code 92065 with a mortgage: 6,998 (551 second mortgage, 22 home equity loan, 507 both second mortgage and home equity loan) Houses without a mortgage: 95
Median monthly owner costs for units with a mortgage: $2,975 Median monthly owner costs for units without a mortgage: $780
Residents with income below the poverty level in 2022:
This zip code:
4.8%
Whole state:
12.2%
Residents with income below 50% of the poverty level in 2022:
This zip code:
2.5%
Whole state:
6.2%
Median number of rooms in houses and condos:
Here:
6.0
State:
6.0
Median number of rooms in apartments:
Here:
4.3
State:
3.9
Notable locations in this zip code not listed on our city pages
Notable locations in zip code 92065: Rincon Refugio (A), Goose Valley Ranger Station (B), Devils Jumpoff (C), Poole Ranch (D), Bassett Ranch (E), Mykrantz Ranch (F), Almond Ranch (G), Ramona Guard Station (H), Pine Hill Egg Ranch (I), Ramona Heli-Tack (J), Ramona Duck Farm (K), Ramona Landfill (L), Mount Woodson Country Club (M), San Vincente Country Club and Golf Course (N), Wildwood Ranch (O), Witch Creek (P), Witch Creek Fire Control Station (Q), Woodson Mountain Lookout (R), Goat Ranch (S), Ramona Community Center (T). Display/hide their locations on the map
Churches in zip code 92065 include: Calvary Chapel (A), The Church of Jesus Christ of Latter Day Saints (B), First Church of Christ Scientist (C), First Congregational Church (D), Grace Community Church (E), Immaculate Heart of Mary Catholic Church (F), Lutheran Church of Ramona (G), Neighborhood Baptist Church (H), Ramona First Baptist Church (I). Display/hide their locations on the map
Creeks: Hatfield Creek (A), Klondike Creek (B), Wash Hollow Creek (C), Daly Creek (D), Temescal Creek (E), Bear Creek (F). Display/hide their locations on the map
Parks in zip code 92065 include: Collier Park (1), Mount Gower Open Space Preserve (2), Ramona Community Park (3), Dos Picos County Park (4). Display/hide their locations on the map
5,698 married couples with children.
1,066 single-parent households (560 men, 506 women).
74.8% of residents of 92065 zip code speak English at home.
21.6% of residents speak Spanish at home (65% very well, 20% well, 12% not well, 4% not at all).
1.0% of residents speak other Indo-European language at home (55% very well, 31% well, 2% not well, 12% not at all).
1.6% of residents speak Asian or Pacific Island language at home (65% very well, 25% well, 4% not well, 6% not at all).
0.5% of residents speak other language at home (96% very well, 4% not well).
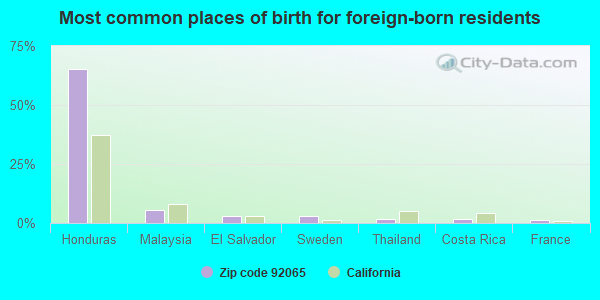
Foreign born population: 4,775 (13.1%) (61.5% of them are naturalized citizens)
This zip code:
13.1%
Whole state:
26.7%
65%Honduras
6%Malaysia
3%El Salvador
3%Sweden
2%Thailand
2%Costa Rica
1%France
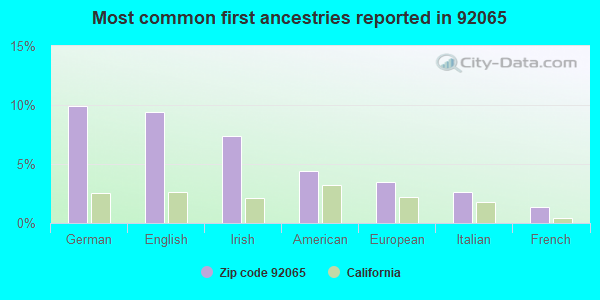
10%German
9%English
7%Irish
4%American
3%European
3%Italian
1%French
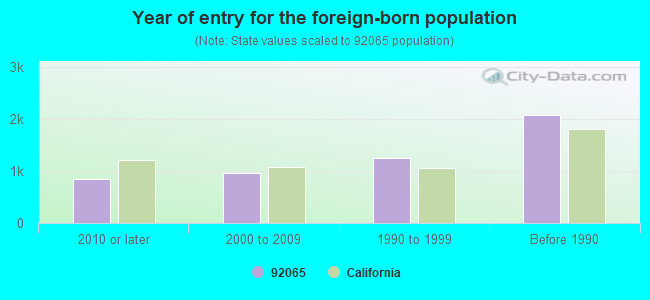
Year of entry for the foreign-born population
8552010 or later
9622000 to 2009
1,2551990 to 1999
2,082Before 1990
Facilities with environmental interests located in this zip code:
HANSON LANE ELEMENTARY (1825 HANSON LANE in RAMONA, CA)
(National Center for Education Statistics) - STATE ID-6039028 Organizations: RAMONA CITY UNIFIED (SCHOOL DISTRICT)
MONTECITO HIGH (CONT.) (720 NINTH ST. in RAMONA, CA)
(National Center for Education Statistics) - STATE ID-3735958 Organizations: RAMONA CITY UNIFIED (SCHOOL DISTRICT)
MT. WOODSON ELEMENTARY (17427 ARCHIE MOORE ROAD in RAMONA, CA)
(National Center for Education Statistics) - STATE ID-6107999 Organizations: RAMONA CITY UNIFIED (SCHOOL DISTRICT)
ADVANCED AUTO SERVICE CENTER (136 TENTH ST STE J in RAMONA, CA)
(Resource Conservation and Recovery Act (tracking hazardous waste)) Organizations: ALAN T HORRALL (CONTACT/OWNER)
HIGH-COUNTRY CHEV-OLDS INC (1939 MAIN ST\ in RAMONA, CA)
(Resource Conservation and Recovery Act (tracking hazardous waste)) Organizations: JIM WILLIAMS (CONTACT/OWNER)
JEFF READE CHEVROLET OLDSMOBILE (1939 MAIN ST in RAMONA, CA)
(Resource Conservation and Recovery Act (tracking hazardous waste)) Organizations: JEFF READE CHEV OLDS (CONTACT/OWNER)
ARCO #1783 (1015 MAIN ST in RAMONA, CA)
CRITERIA AND HAZARDOUS AIR POLLUTANT INVENTORY (Inventory of air pollution sources) Business SIC classification: GASOLINE SERVICE STATIONS
GVS SYSTEMS / RAMONA DAY N NIT (1910 MAIN ST in RAMONA, CA)
CRITERIA AND HAZARDOUS AIR POLLUTANT INVENTORY (Inventory of air pollution sources) Business SIC classification: GASOLINE SERVICE STATIONS
HABIB PARCEL (16TH AND MAIN in RAMONA, CA)
ENFORCEMENT/COMPLIANCE ACTIVITY (Integrated Compliance Information System)
HORIZON GROWERS (P.O. BOX 2330 in RAMONA, CA)
COMPLIANCE ACTIVITY (Tracking inspections of insecticide, fungicide, and rodenticide, and toxic substances)
INLAND PACIFIC MARBLE INC (106 5TH ST in RAMONA, CA)
CRITERIA AND HAZARDOUS AIR POLLUTANT INVENTORY (Inventory of air pollution sources) Business SIC classification: SPECIAL TRADE CONTRACTORS
CHEVRON / RAMONA (802 MAIN ST in RAMONA, CA)
CRITERIA AND HAZARDOUS AIR POLLUTANT INVENTORY (Inventory of air pollution sources) Business SIC classification: GASOLINE SERVICE STATIONS
NANCYS CLEANERS / RAMONA (1668 MAIN ST #D in RAMONA, CA)
CRITERIA AND HAZARDOUS AIR POLLUTANT INVENTORY (Inventory of air pollution sources) Business SIC classification: DRYCLEANING PLANTS, EXCEPT RUG CLEANING
Housing units lacking complete plumbing facilities: 0.1% Housing units lacking complete kitchen facilities: 0.7%
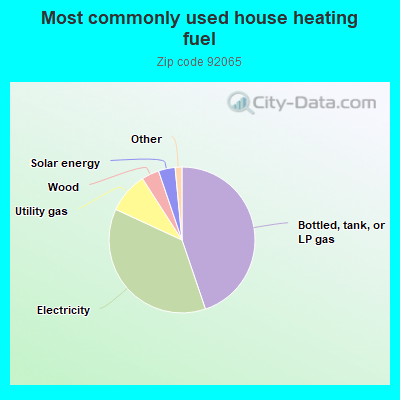
44.8%Bottled, tank, or LP gas
37.1%Electricity
9.0%Utility gas
3.9%Wood
3.7%Solar energy
0.7%No fuel used
0.5%Fuel oil, kerosene, etc.
Population in 1990: 27,744. Population change in the 1990s: +5,343 (+19.3%).
Place of birth for U.S.-born residents:
This state: 21,556
Northeast: 1,852
Midwest: 3,089
South: 2,424
West: 2,171
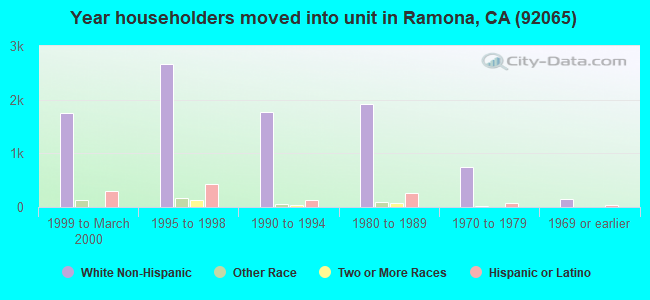
52% of the 92065 zip code residents lived in the same house 5 years ago. Out of people who lived in different houses, 73% lived in this county. Out of people who lived in different counties, 50% lived in California.
90% of the 92065 zip code residents lived in the same house 1 year ago. Out of people who lived in different houses, 83% moved from this county. Out of people who lived in different houses, 4% moved from different county within same state. Out of people who lived in different houses, 10% moved from different state.
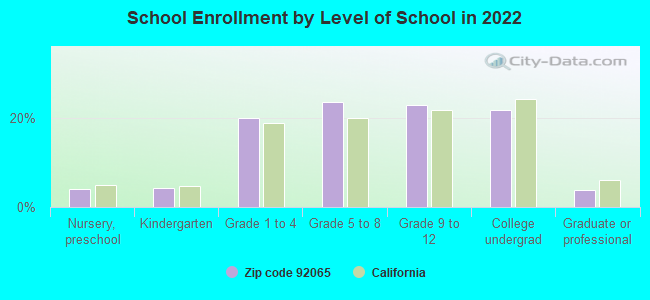
Private vs. public school enrollment:
Students in private schools in grades 1 to 8 (elementary and middle school): 542
Here:
14.6%
California:
10.5%
Students in private schools in grades 9 to 12 (high school): 185
Here:
9.5%
California:
8.5%
Students in private undergraduate colleges: 275
Here:
14.8%
California:
15.9%
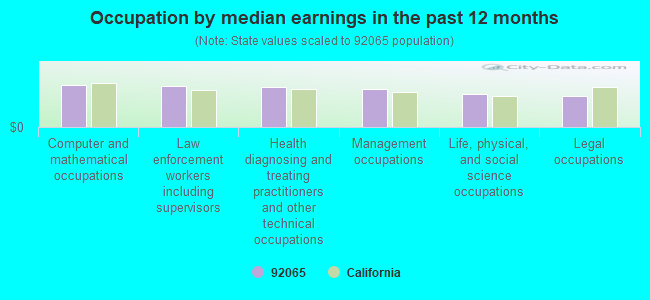
Occupation by median earnings in the past 12 months ($)
117,831Computer and mathematical occupations
114,531Law enforcement workers including supervisors
110,606Health diagnosing and treating practitioners and other technical occupations
105,729Management occupations
91,077Life, physical, and social science occupations
84,918Legal occupations
Companies with biggest federal contracts located in this zip code (RAMONA, CA):
R A BURCH CONSTRUCTION CO INC (1122 B ST; small business) : $179,987,962 in 216 contractsfrom 1999 to 2006
Contracts for Construction of Structures and Facilities -- Other Airfield Structures, Construction of Structures and Facilities -- Government-Owned Government-Operated (GOGO) R&D Facilities, Construction of Structures and Facilities -- Other Industrial Buildings, Construction of Structures and Facilities -- Highways, Roads, Streets, Bridges, and Railways (includes resurfacing), and moreby Navy, Army, Air Force Signed by year:2000: $21,197,062; 2001: $10,119,607; 2002: $21,438,649; 2003: $54,831,562; 2004: $4,183,410; 2005: $41,190,187; 2006: $12,647,464.
Biggest contracts:
$30,300,000 with Navy for Construction of Structures and Facilities -- Other Airfield Structures. Signed on 2003-12-29. Completion date: 2007-01-12.
$17,100,000 with Navy for Construction of Structures and Facilities -- Government-Owned Government-Operated (GOGO) R&D Facilities. Signed on 2006-02-22. Completion date: 2007-07-02.
$11,283,290 with Navy for Construction of Structures and Facilities -- Other Industrial Buildings. Signed on 2003-01-30. Completion date: 2003-09-30.
$10,752,388 with Navy for Construction of Structures and Facilities -- Highways, Roads, Streets, Bridges, and Railways (includes resurfacing). Signed on 2005-07-29. Completion date: 2007-08-13.
CHOCTAW CONSTRUCTION COMPANY I (23839 OAK MEADOW DR; small business) : $4,105,421 in 44 contractsfrom 2000 to 2006
Contracts for Maintenance, Repair or Alteration of Real Property -- Hospitals and Infirmaries, Maintenance, Repair or Alteration of Real Property -- Restoration of real property, Construction of Structures and Facilities -- Other Non-Building Facilities, Maintenance, Repair or Alteration of Real Property -- Laboratories and Clinics, and moreby Department of Veterans Affairs, Navy, Forest Service Signed by year:2000: $9,888; 2001: $734,995; 2002: $649,093; 2003: $1,386,836; 2004: $665,298; 2005: $644,641; 2006: $14,670.
Biggest contracts:
$684,000 with Department of Veterans Affairs for Maintenance, Repair or Alteration of Real Property -- Hospitals and Infirmaries. Signed on 2001-01-15. Completion date: 2001-08-15.
$503,405, same as above.Signed on 2003-08-15. Completion date: 2003-12-15.
$429,925 with Navy for Maintenance, Repair or Alteration of Real Property -- Restoration of real property. Signed on 2004-12-06. Completion date: 2005-02-06.
$266,311 with Navy for Construction of Structures and Facilities -- Other Non-Building Facilities. Signed on 2003-09-30. Completion date: 2004-01-30.
AMERICAN PROCESSING COMPANY IN (1210 OLIVE STREET NO US; small business) : $2,205,543 in 60 contractsfrom 2002 to 2005
Contracts for Facilities Operations Support Services, Trash/Garbage Collection Services - Including Portable Sanitation Services by Navy, Air Force Signed by year:2000: $0; 2001: $0; 2002: $588,188; 2003: $816,974; 2004: $645,949; 2005: $154,432; 2006: $0.
Biggest contracts:
$503,200 with Navy for Facilities Operations Support Services. Signed on 2004-09-30. Completion date: 2006-09-30.
$472,596, same as above.Signed on 2003-10-31. Completion date: 2006-09-30.
$328,740, same as above.Signed on 2002-12-12. Completion date: 2002-09-30.
$136,975, same as above.Signed on 2002-05-17. Completion date: 2002-09-30.
J D FONTANA & ASSOCIATES, INC (17095 OBSIDIN; small business)
$247,564 with Air Force for Weapons -- Applied Research and Exploratory Development (R&D). Signed on 2006-03-13. Completion date: 2007-06-12.
HOCKIN DIVERSIFIED HOLDING, IN (1672 MAIN STREET, SUITE E,; small business) : $190,452 in 2 contractsfrom 2001 to 2005
$181,696 with Navy for Motor Vehicle Maintenance and Repair Shop Specialized Equipment. Signed on 2001-05-22. Completion date: 2001-11-16.
$8,756 with Air Force for Miscellaneous Service and Trade Equipment. Signed on 2005-06-17. Completion date: 2005-07-26.
STARTING POINT SOFTWARE, INC (1672E MAIN ST #263; small business) : $75,135 in 3 contractsfrom 2002 to 2004
$35,500 with Department of Veterans Affairs for Medical and Surgical Instruments, Equipment, and Supplies. Signed on 2003-12-31. Completion date: 2004-02-02.
$33,000 with Federal Technology Service for ADP Software. Signed on 2002-10-15. Completion date: 2002-10-15.
$6,635 with Air Force for Maintenance, Repair and Rebuilding of Equipment -- Automatic Data Processing Equipment (Including Firmware), Software, Supplies and Support Equipment. Taking place in AZ. Signed on 2004-10-01. Completion date: 2005-09-30.
PALADIN SOFTWARE INC (17110 PETROLIA CT; small business) : $51,300 in 3 contractsfrom 2002 to 2005
$36,800 with Navy for Other Professional Services. Signed on 2004-07-19. Completion date: 2004-12-31.
$8,000 with Navy for Other ADP and Telecommunications Services (includes data storage on tapes, compact disks, etc.). Signed on 2002-09-28. Completion date: 2002-12-04.
$6,500 with Navy for ADP Software. Signed on 2005-08-26. Completion date: 2005-10-25.
WEST COAST BIO-MEDICAL LLC (607 BRAZOS ST STE G; small business) : $51,132 in 5 contractsfrom 2002 to 2005
Contracts for Maintenance, Repair and Rebuilding of Equipment -- Medical, Dental, and Veterinary Equipment and Supplies by Navy Signed by year:2000: $0; 2001: $0; 2002: $15,540; 2003: $17,292; 2004: $18,300; 2005: $0; 2006: $0.
Biggest contracts:
$18,300 with Navy for Maintenance, Repair and Rebuilding of Equipment -- Medical, Dental, and Veterinary Equipment and Supplies. Signed on 2005-06-22. Completion date: 2003-09-30.
$18,300, same as above.Signed on 2004-08-05. Completion date: 2003-09-30.
$17,292, same as above.Signed on 2003-10-09. Completion date: 2004-09-30.
$15,540, same as above.Signed on 2002-10-01. Completion date: 2003-09-30.
S AND S FARMS (1650 WARNOCK DR; small business) : $49,849 in 32 contractsfrom 2003 to 2005
Contracts for Medical and Surgical Instruments, Equipment, and Supplies, Live Animals, Not Raised for Food, In Vitro Diagnostic Substances, Reagents, Test Kits, and Sets, Miscellaneous Crude Agricultural and Forestry Products, and moreby Navy, Air Force Signed by year:2000: $0; 2001: $0; 2002: $0; 2003: $1,460; 2004: $40,813; 2005: $7,576; 2006: $0.
Biggest contracts:
$24,900 with Navy for Medical and Surgical Instruments, Equipment, and Supplies. Signed on 2004-09-16. Completion date: 2005-09-30.
$4,125 with Air Force for Live Animals, Not Raised for Food. Signed on 2004-03-04. Completion date: 2004-03-15.
$3,270 with Navy for Live Animals, Not Raised for Food. Signed on 2005-10-25. Completion date: 2005-12-01.
$2,635, same as above.Signed on 2005-03-16. Completion date: 2005-03-31.
ASUBO SUPPLY SOURCES (16255 HIGHLAND VALLEY RD; small business)
$41,069 with Navy for Miscellaneous Prefabricated Structures. Signed on 2000-09-30. Completion date: 2000-10-30.
Top industries in this zip code by the number of employees in 2005:
Other Services (except Public Administration): Other Similar Organizations (except Business, Professional, Labor, and Political Organizations) (100-249: 1, 20-49: 1, 5-9: 1, 1-4: 2)
Construction: New Single-Family Housing Construction (except Operative Builders) (20-49: 1, 10-19: 4, 5-9: 5, 1-4: 30)
2005 - 2018 National Fire Incident Reporting System (NFIRS) incidents
According to the data from the years 2005 - 2018 the average number of fires per year is 124. The highest number of reported fire incidents - 753 took place in 2007, and the least - 53 in 2012. The data has an increasing trend.
When looking into fire subcategories, the most reports belonged to: Outside Fires (35.9%), and Structure Fires (33.7%).
Fire incident types reported to NFIRS in Zip Code 92065


 Nearest zip codes: 92027, 92040, 92070, 92064, 92145, 92021.


 According to the data from the years 2005 - 2018 the average number of fires per year is 124. The highest number of reported fire incidents - 753 took place in 2007, and the least - 53 in 2012. The data has an increasing trend.
 When looking into fire subcategories, the most reports belonged to: Outside Fires (35.9%), and Structure Fires (33.7%).