Races in Salem, Massachusetts (MA) Detailed Stats
Data:
Races - White alone (%)
Races - White alone (% change since 2000)
Races - Black alone (%)
Races - Black alone (% change since 2000)
Races - American Indian alone (%)
Races - American Indian alone (% change since 2000)
Races - Asian alone (%)
Races - Asian alone (% change since 2000)
Races - Hispanic (%)
Races - Hispanic (% change since 2000)
Races - Native Hawaiian and Other Pacific Islander alone (%)
Races - Native Hawaiian and Other Pacific Islander alone (% change since 2000)
Races - Two or more races(%)
Races - Two or more races(% change since 2000)
Races - Other race alone (%)
Races - Other race alone (% change since 2000)
Racial diversity
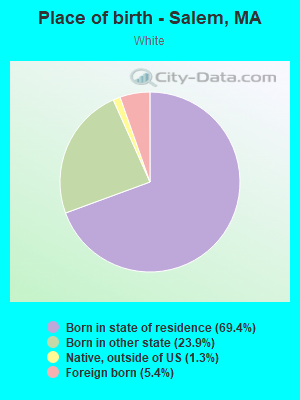
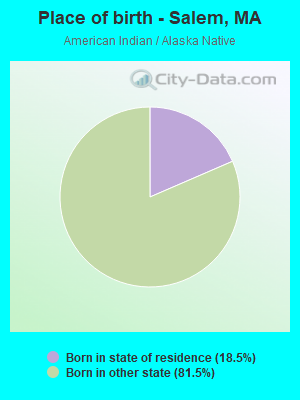
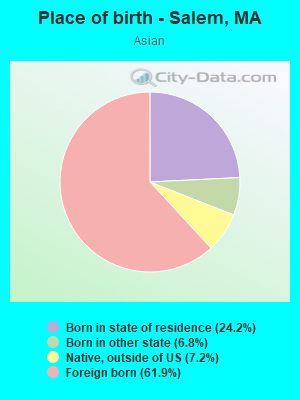
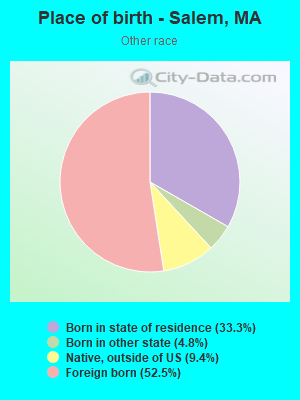
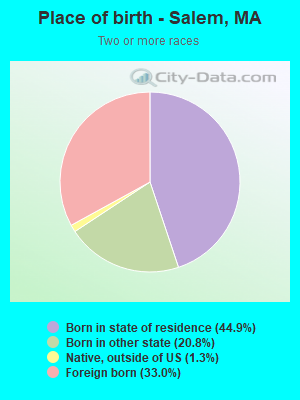
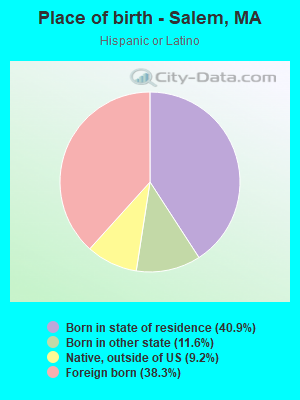
Place of birth - Born in state of residence (%)
Place of birth - Born in state of residence (%) - White
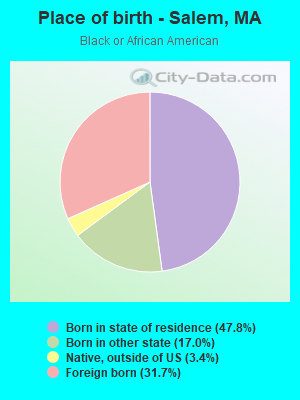
Place of birth - Born in state of residence (%) - Black or African American
Place of birth - Born in state of residence (%) - Asian
Place of birth - Born in state of residence (%) - Hispanic or Latino
Place of birth - Born in state of residence (%) - American Indian and Alaska Native
Place of birth - Born in state of residence (%) - Multirace
Place of birth - Born in state of residence (%) - Other Race
Place of birth - Born in other state (%)
Place of birth - Born in other state (%) - White
Place of birth - Born in other state (%) - Black or African American
Place of birth - Born in other state (%) - Asian
Place of birth - Born in other state (%) - Hispanic or Latino
Place of birth - Born in other state (%) - American Indian and Alaska Native
Place of birth - Born in other state (%) - Multirace
Place of birth - Born in other state (%) - Other Race
Place of birth - Native, outside of US (%)
Place of birth - Native, outside of US (%) - White
Place of birth - Native, outside of US (%) - Black or African American
Place of birth - Native, outside of US (%) - Asian
Place of birth - Native, outside of US (%) - Hispanic or Latino
Place of birth - Native, outside of US (%) - American Indian and Alaska Native
Place of birth - Native, outside of US (%) - Multirace
Place of birth - Native, outside of US (%) - Other Race
Place of birth - Foreign born (%)
Place of birth - Foreign born (%) - White
Place of birth - Foreign born (%) - Black or African American
Place of birth - Foreign born (%) - Asian
Place of birth - Foreign born (%) - Hispanic or Latino
Place of birth - Foreign born (%) - American Indian and Alaska Native
Place of birth - Foreign born (%) - Multirace
Place of birth - Foreign born (%) - Other Race
Residents speaking English at home (%)
Residents speaking English at home - Born in the United States (%)
Residents speaking English at home - Native, born elsewhere (%)
Residents speaking English at home - Foreign born (%)
Residents speaking Spanish at home (%)
Residents speaking Spanish at home - Born in the United States (%)
Residents speaking Spanish at home - Native, born elsewhere (%)
Residents speaking Spanish at home - Foreign born (%)
Residents speaking other language at home (%)
Residents speaking other language at home - Born in the United States (%)
Residents speaking other language at home - Native, born elsewhere (%)
Residents speaking other language at home - Foreign born (%)
Marital status - Never married (%)
Marital status - Now married (%)
Marital status - Separated (%)
Marital status - Widowed (%)
Marital status - Divorced (%)
Ancestries Reported - Arab (%)
Ancestries Reported - Czech (%)
Ancestries Reported - Danish (%)
Ancestries Reported - Dutch (%)
Ancestries Reported - English (%)
Ancestries Reported - French (%)
Ancestries Reported - French Canadian (%)
Ancestries Reported - German (%)
Ancestries Reported - Greek (%)
Ancestries Reported - Hungarian (%)
Ancestries Reported - Irish (%)
Ancestries Reported - Italian (%)
Ancestries Reported - Lithuanian (%)
Ancestries Reported - Norwegian (%)
Ancestries Reported - Polish (%)
Ancestries Reported - Portuguese (%)
Ancestries Reported - Russian (%)
Ancestries Reported - Scotch-Irish (%)
Ancestries Reported - Scottish (%)
Ancestries Reported - Slovak (%)
Ancestries Reported - Subsaharan African (%)
Ancestries Reported - Swedish (%)
Ancestries Reported - Swiss (%)
Ancestries Reported - Ukrainian (%)
Ancestries Reported - United States (%)
Ancestries Reported - Welsh (%)
Ancestries Reported - West Indian (%)
Ancestries Reported - Other (%)
Geographical mobility - Same house 1 year ago (%)
Geographical mobility - Same house 1 year ago (%) - White
Geographical mobility - Same house 1 year ago (%) - Black or African American
Geographical mobility - Same house 1 year ago (%) - Asian
Geographical mobility - Same house 1 year ago (%) - Hispanic or Latino
Geographical mobility - Same house 1 year ago (%) - American Indian and Alaska Native
Geographical mobility - Same house 1 year ago (%) - Multirace
Geographical mobility - Same house 1 year ago (%) - Other Race
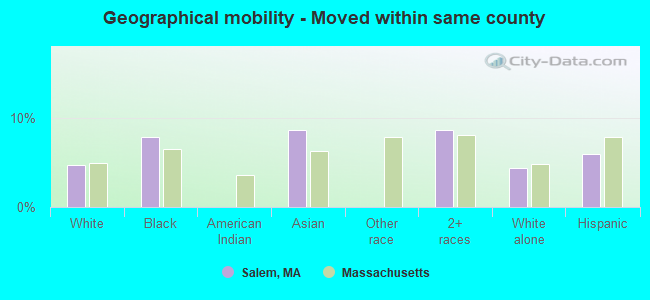
Geographical mobility - Moved within same county (%)
Geographical mobility - Moved within same county (%) - White
Geographical mobility - Moved within same county (%) - Black or African American
Geographical mobility - Moved within same county (%) - Asian
Geographical mobility - Moved within same county (%) - Hispanic or Latino
Geographical mobility - Moved within same county (%) - American Indian and Alaska Native
Geographical mobility - Moved within same county (%) - Multirace
Geographical mobility - Moved within same county (%) - Other Race
Geographical mobility - Moved from different county within same state (%)
Geographical mobility - Moved from different county within same state (%) - White
Geographical mobility - Moved from different county within same state (%) - Black or African American
Geographical mobility - Moved from different county within same state (%) - Asian
Geographical mobility - Moved from different county within same state (%) - Hispanic or Latino
Geographical mobility - Moved from different county within same state (%) - American Indian and Alaska Native
Geographical mobility - Moved from different county within same state (%) - Multirace
Geographical mobility - Moved from different county within same state (%) - Other Race
Geographical mobility - Moved from different state (%)
Geographical mobility - Moved from different state (%) - White
Geographical mobility - Moved from different state (%) - Black or African American
Geographical mobility - Moved from different state (%) - Asian
Geographical mobility - Moved from different state (%) - Hispanic or Latino
Geographical mobility - Moved from different state (%) - American Indian and Alaska Native
Geographical mobility - Moved from different state (%) - Multirace
Geographical mobility - Moved from different state (%) - Other Race
Geographical mobility - Moved from abroad (%)
Geographical mobility - Moved from abroad (%) - White
Geographical mobility - Moved from abroad (%) - Black or African American
Geographical mobility - Moved from abroad (%) - Asian
Geographical mobility - Moved from abroad (%) - Hispanic or Latino
Geographical mobility - Moved from abroad (%) - American Indian and Alaska Native
Geographical mobility - Moved from abroad (%) - Multirace
Geographical mobility - Moved from abroad (%) - Other Race
Place of birth for the foreign-born population - Ireland (%)
Place of birth for the foreign-born population - Denmark (%)
Place of birth for the foreign-born population - Norway (%)
Place of birth for the foreign-born population - Sweden (%)
Place of birth for the foreign-born population - United Kingdom (%)
Place of birth for the foreign-born population - England (%)
Place of birth for the foreign-born population - Scotland (%)
Place of birth for the foreign-born population - Other Northern Europe (%)
Place of birth for the foreign-born population - Austria (%)
Place of birth for the foreign-born population - Belgium (%)
Place of birth for the foreign-born population - France (%)
Place of birth for the foreign-born population - Germany (%)
Place of birth for the foreign-born population - Netherlands (%)
Place of birth for the foreign-born population - Switzerland (%)
Place of birth for the foreign-born population - Other Western Europe (%)
Place of birth for the foreign-born population - Greece (%)
Place of birth for the foreign-born population - Italy (%)
Place of birth for the foreign-born population - Portugal (%)
Place of birth for the foreign-born population - Spain (%)
Place of birth for the foreign-born population - Other Southern Europe (%)
Place of birth for the foreign-born population - Albania (%)
Place of birth for the foreign-born population - Belarus (%)
Place of birth for the foreign-born population - Bosnia and Herzegovina (%)
Place of birth for the foreign-born population - Bulgaria (%)
Place of birth for the foreign-born population - Croatia (%)
Place of birth for the foreign-born population - Czechoslovakia (%)
Place of birth for the foreign-born population - Hungary (%)
Place of birth for the foreign-born population - Latvia (%)
Place of birth for the foreign-born population - Lithuania (%)
Place of birth for the foreign-born population - North Macedonia (Macedonia) (%)
Place of birth for the foreign-born population - Moldova (%)
Place of birth for the foreign-born population - Poland (%)
Place of birth for the foreign-born population - Romania (%)
Place of birth for the foreign-born population - Russia (%)
Place of birth for the foreign-born population - Serbia (%)
Place of birth for the foreign-born population - Ukraine (%)
Place of birth for the foreign-born population - Other Eastern Europe (%)
Place of birth for the foreign-born population - China (%)
Place of birth for the foreign-born population - Hong Kong (%)
Place of birth for the foreign-born population - Taiwan (%)
Place of birth for the foreign-born population - Japan (%)
Place of birth for the foreign-born population - Korea (%)
Place of birth for the foreign-born population - Other Eastern Asia (%)
Place of birth for the foreign-born population - Afghanistan (%)
Place of birth for the foreign-born population - Bangladesh (%)
Place of birth for the foreign-born population - India (%)
Place of birth for the foreign-born population - Iran (%)
Place of birth for the foreign-born population - Kazakhstan (%)
Place of birth for the foreign-born population - Nepal (%)
Place of birth for the foreign-born population - Pakistan (%)
Place of birth for the foreign-born population - Sri Lanka (%)
Place of birth for the foreign-born population - Uzbekistan (%)
Place of birth for the foreign-born population - Other South Central Asia (%)
Place of birth for the foreign-born population - Burma (%)
Place of birth for the foreign-born population - Cambodia (%)
Place of birth for the foreign-born population - Indonesia (%)
Place of birth for the foreign-born population - Laos (%)
Place of birth for the foreign-born population - Malaysia (%)
Place of birth for the foreign-born population - Philippines (%)
Place of birth for the foreign-born population - Singapore (%)
Place of birth for the foreign-born population - Thailand (%)
Place of birth for the foreign-born population - Vietnam (%)
Place of birth for the foreign-born population - Other South Eastern Asia (%)
Place of birth for the foreign-born population - Armenia (%)
Place of birth for the foreign-born population - Iraq (%)
Place of birth for the foreign-born population - Israel (%)
Place of birth for the foreign-born population - Jordan (%)
Place of birth for the foreign-born population - Kuwait (%)
Place of birth for the foreign-born population - Lebanon (%)
Place of birth for the foreign-born population - Saudi Arabia (%)
Place of birth for the foreign-born population - Syria (%)
Place of birth for the foreign-born population - Turkey (%)
Place of birth for the foreign-born population - Yemen (%)
Place of birth for the foreign-born population - Other Western Asia (%)
Place of birth for the foreign-born population - Eritrea (%)
Place of birth for the foreign-born population - Ethiopia (%)
Place of birth for the foreign-born population - Kenya (%)
Place of birth for the foreign-born population - Somalia (%)
Place of birth for the foreign-born population - Uganda (%)
Place of birth for the foreign-born population - Zimbabwe (%)
Place of birth for the foreign-born population - Other Eastern Africa (%)
Place of birth for the foreign-born population - Cameroon (%)
Place of birth for the foreign-born population - Congo (%)
Place of birth for the foreign-born population - Democratic Republic of Congo (Zaire) (%)
Place of birth for the foreign-born population - Other Middle Africa (%)
Place of birth for the foreign-born population - Egypt (%)
Place of birth for the foreign-born population - Morocco (%)
Place of birth for the foreign-born population - Sudan (%)
Place of birth for the foreign-born population - Other Northern Africa (%)
Place of birth for the foreign-born population - South Africa (%)
Place of birth for the foreign-born population - Other Southern Africa (%)
Place of birth for the foreign-born population - Cabo Verde (%)
Place of birth for the foreign-born population - Ghana (%)
Place of birth for the foreign-born population - Liberia (%)
Place of birth for the foreign-born population - Nigeria (%)
Place of birth for the foreign-born population - Senegal (%)
Place of birth for the foreign-born population - Sierra Leone (%)
Place of birth for the foreign-born population - Other Western Africa (%)
Place of birth for the foreign-born population - Australia (%)
Place of birth for the foreign-born population - New Zealand (%)
Place of birth for the foreign-born population - Fiji (%)
Place of birth for the foreign-born population - Micronesia (%)
Place of birth for the foreign-born population - Bahamas (%)
Place of birth for the foreign-born population - Barbados (%)
Place of birth for the foreign-born population - Cuba (%)
Place of birth for the foreign-born population - Dominica (%)
Place of birth for the foreign-born population - Dominican Republic (%)
Place of birth for the foreign-born population - Grenada (%)
Place of birth for the foreign-born population - Haiti (%)
Place of birth for the foreign-born population - Jamaica (%)
Place of birth for the foreign-born population - St. Vincent and the Grenadines (%)
Place of birth for the foreign-born population - Trinidad and Tobago (%)
Place of birth for the foreign-born population - West Indies (%)
Place of birth for the foreign-born population - Other Caribbean (%)
Place of birth for the foreign-born population - Belize (%)
Place of birth for the foreign-born population - Costa Rica (%)
Place of birth for the foreign-born population - El Salvador (%)
Place of birth for the foreign-born population - Guatemala (%)
Place of birth for the foreign-born population - Honduras (%)
Place of birth for the foreign-born population - Mexico (%)
Place of birth for the foreign-born population - Nicaragua (%)
Place of birth for the foreign-born population - Panama (%)
Place of birth for the foreign-born population - Other Central America (%)
Place of birth for the foreign-born population - Argentina (%)
Place of birth for the foreign-born population - Bolivia (%)
Place of birth for the foreign-born population - Brazil (%)
Place of birth for the foreign-born population - Chile (%)
Place of birth for the foreign-born population - Colombia (%)
Place of birth for the foreign-born population - Ecuador (%)
Place of birth for the foreign-born population - Guyana (%)
Place of birth for the foreign-born population - Peru (%)
Place of birth for the foreign-born population - Uruguay (%)
Place of birth for the foreign-born population - Venezuela (%)
Place of birth for the foreign-born population - Other South America (%)
Place of birth for the foreign-born population - Canada (%)
Place of birth for the foreign-born population - Other Northern America (%)
Place of birth for the foreign-born population - Other (%)
Latest news about races in Salem, MA collected exclusively by city-data.com from local newspapers, TV, and radio stations
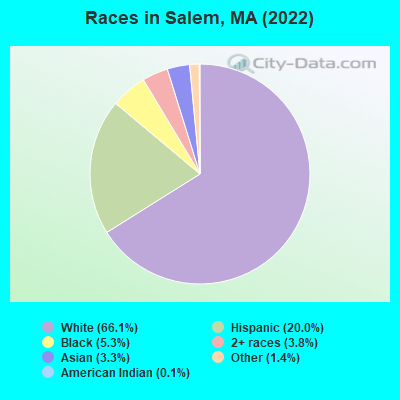
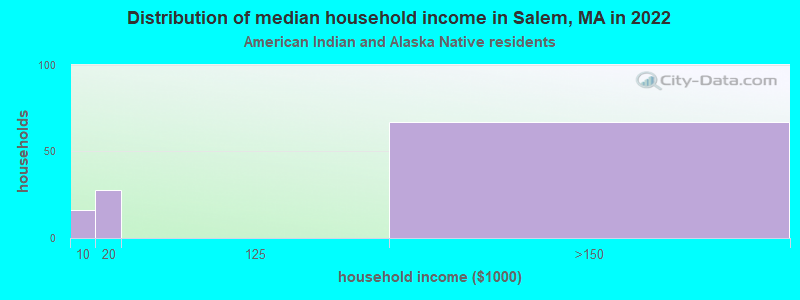
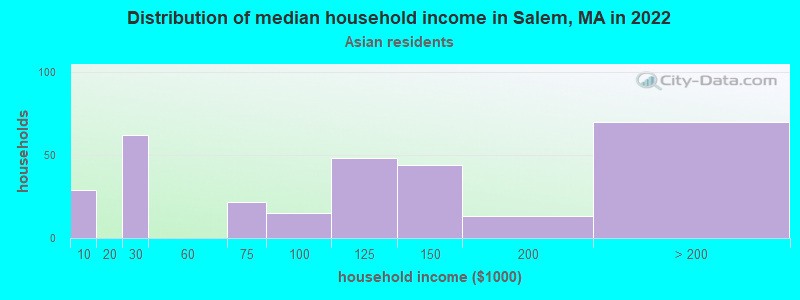
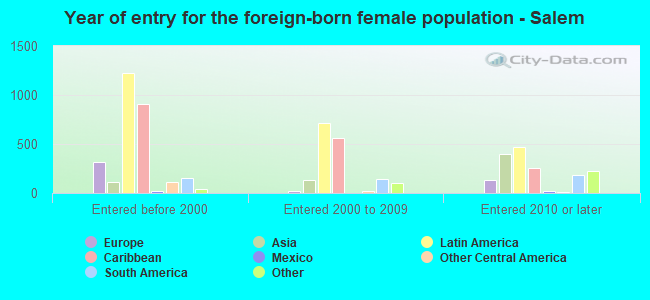
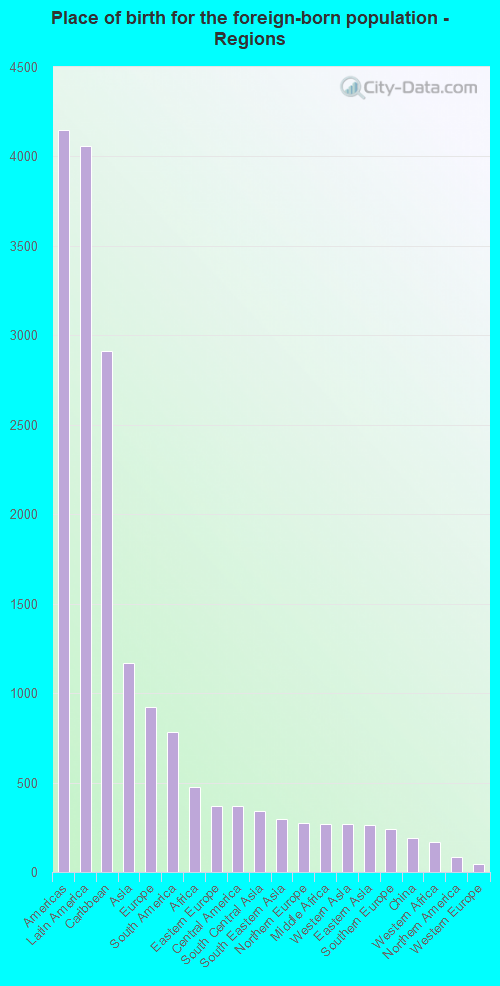
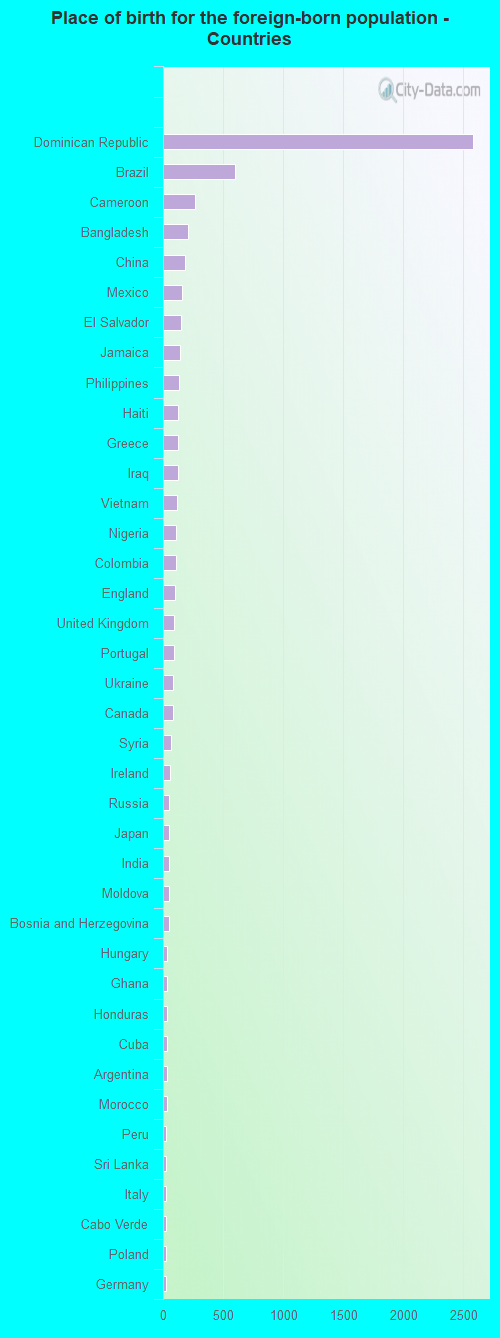
According to 2022 data, the most numerous races in Salem, MA are White alone (29,484 residents), Hispanic (8,910 residents), and Asian alone (1,483 residents). 76.8% of Salem residents speak English at home. 15.1% of Salem, MA residents are foreign-born (8.9% born in Latin America, 2.6% born in Asia, 2.0% born in Europe), which is 19.3% less than the foreign-born rate of 18.0% across the entire state of Massachusetts.
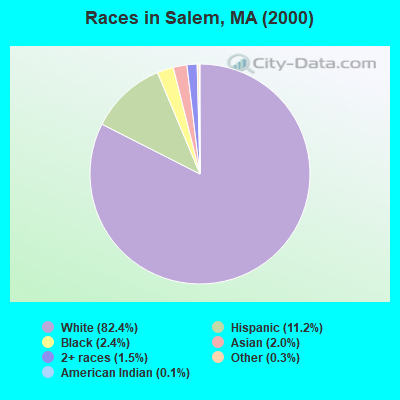
Race distribution in Salem
2000 2022
5,198,359 81.9% White alone 428,729 6.8% Hispanic 318,329 5.0% Black alone 236,786 3.7% Asian alone 110,338 1.7% Two or more races 43,586 0.7% Other race alone 11,264 0.2% American Indian alone 1,706 0.03% Native Hawaiian and Other
4,676,627 67.0% White alone 911,038 13.0% Hispanic 501,463 7.2% Asian alone 459,740 6.6% Black alone 341,889 4.9% Two or more races 84,403 1.2% Other race alone 5,838 0.08% American Indian alone 976 0.01% Native Hawaiian and Other
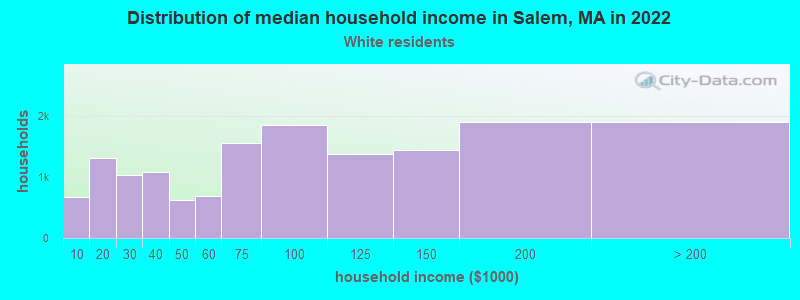
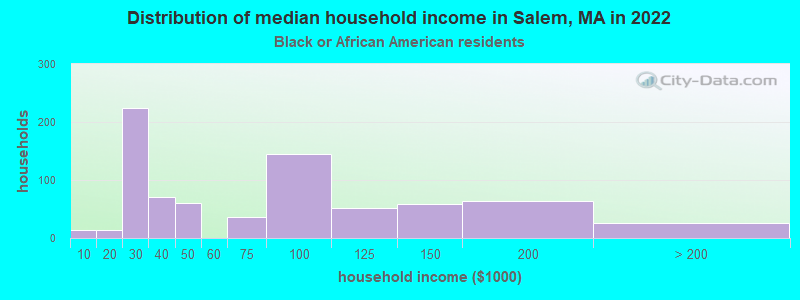
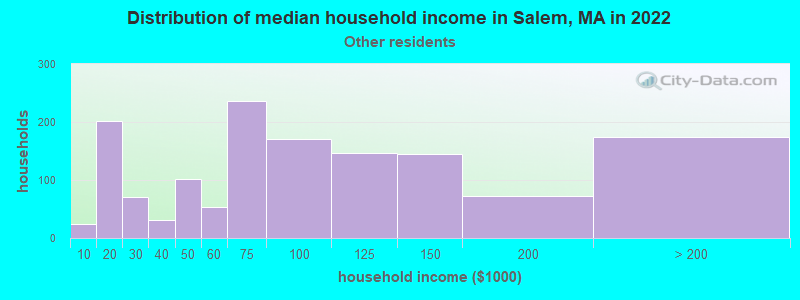
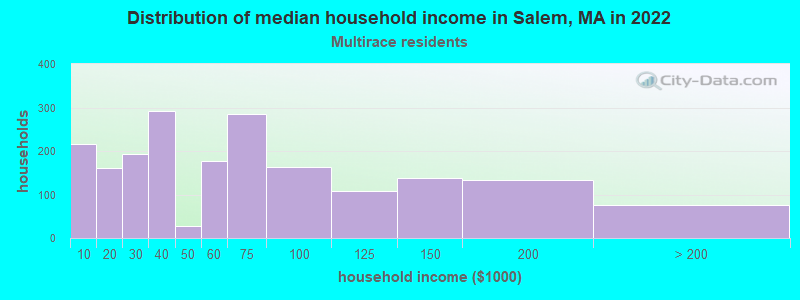
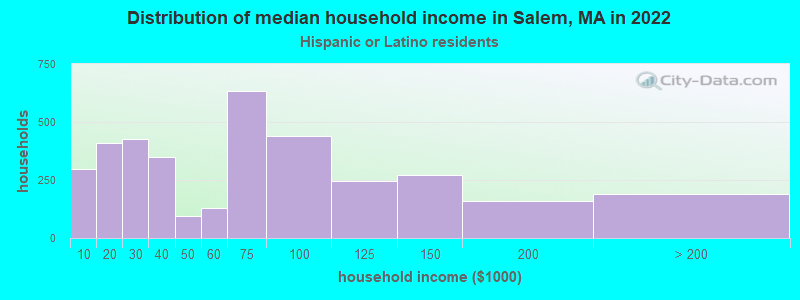
Income and house value in Salem Median household income in 2022 $89,048 White non-Hispanic householders$81,893 Black householders$97,112 Asian householders$71,967 Some other race householders$53,853 Two or more races householders$62,893 Hispanic or Latino race householdersMedian 2022 house value $504,993 White Non-Hispanic householders$462,465 Black or African American householders $516,762 Asian householders$675,375 Some other race householders$434,647 Two or more races householders$550,732 Hispanic or Latino householders
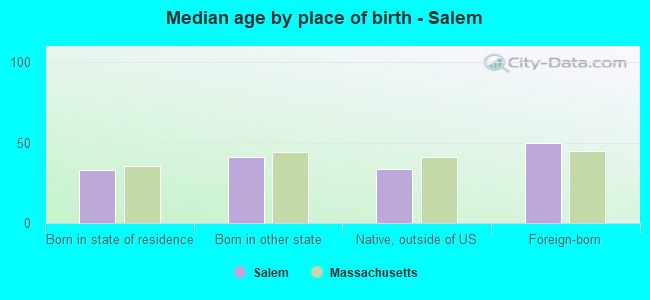
Median age by race in Salem
41.1 Median age for White residents39.3 42.9 26.5 Median age for Black or African American residents27.0 26.3 41.6 Median age for American Indian / Alaska Native residents-679,156,908.0 -364,551,862.7 36.0 Median age for Asian residents34.5 39.9 -514,227,641.8 Median age for Native Hawaiian / Pacific Islander residents-666,666,666.0 -508,717,948.2 35.7 Median age for Other race residents31.8 42.6 32.9 Median age for Two or more races residents32.1 35.5 42.4 Median age for White alone residents41.0 44.0 31.7 Median age for Hispanic or Latino residents29.2 35.6
Owner/renter occupied households by race in Salem
House owners and renters - White residents 8,875 58.6% Owner occupied6,280 41.4% Renter occupiedHouse owners and renters - Black or African American residents 216 32.1% Owner occupied456 67.9% Renter occupiedHouse owners and renters - American Indian / Alaska Native residents 91 66.9% Owner occupied45 33.1% Renter occupiedHouse owners and renters - Asian residents 176 52.8% Owner occupied158 47.2% Renter occupiedHouse owners and renters - Other race residents 282 19.0% Owner occupied1,203 81.0% Renter occupiedHouse owners and renters - Two or more races residents 609 30.2% Owner occupied1,406 69.8% Renter occupiedHouse owners and renters - White alone residents 8,834 61.5% Owner occupied5,532 38.5% Renter occupiedHouse owners and renters - Hispanic or Latino residents 673 18.4% Owner occupied2,980 81.6% Renter occupied
Language usage in Salem
English speakers - Total 76.8% of residents of Salem speak English at home.
13.0% of residents speak Spanish at home 2,489 45.0% Speak English very well3,041 55.0% Speak English less than very well9.9% of residents speak other language at home 2,407 57.5% Speak English very well1,782 42.5% Speak English less than very well
English speakers - Born in the United States 94.1% of residents of Salem speak English at home.
3.4% of residents speak Spanish at home 291 94.2% Speak English very well18 5.8% Speak English less than very well2.7% of residents speak other language at home 219 90.1% Speak English very well24 9.9% Speak English less than very well
English speakers - Native, born elsewhere 31.6% of residents of Salem speak English at home.
59.0% of residents speak Spanish at home 410 62.1% Speak English very well250 37.9% Speak English less than very well7.9% of residents speak other language at home 25 28.4% Speak English very well63 71.6% Speak English less than very well
English speakers - Foreign-born 18.0% of residents of Salem speak English at home.
42.1% of residents speak Spanish at home 394 13.5% Speak English very well2,527 86.5% Speak English less than very well40.8% of residents speak other language at home 1,312 46.3% Speak English very well1,519 53.7% Speak English less than very well
White (Caucasian) - Speak only English Native:
94.6% (27,139)Foreign-born:
23.9% (400)
White (Caucasian) - Speak another language Native:
5.3% (1,511)Foreign-born:
75.9% (1,271)
Black or African American - Speak only English Native:
82.9% (1,339)Foreign-born:
31.6% (255)
Black or African American - Speak another language Native:
17.7% (285)Foreign-born:
69.4% (560)
Asian - Speak only English Native:
59.0% (303)Foreign-born:
17.5% (160)
Asian - Speak another language Native:
41.8% (214)Foreign-born:
81.5% (748)
Other race - Speak only English Native:
27.3% (397)Foreign-born:
16.1% (292)
Other race - Speak another language Native:
73.3% (1,064)Foreign-born:
84.4% (1,536)
Two or more races - Speak only English Native:
76.8% (2,000)Foreign-born:
17.4% (267)
Two or more races - Speak another language Native:
19.9% (518)Foreign-born:
85.3% (1,311)
White alone - Speak only English Native:
96.4% (26,260)Foreign-born:
23.7% (305)
White alone - Speak another language Native:
3.6% (971)Foreign-born:
76.6% (988)
Hispanic or Latino - Speak only English Native:
49.0% (2,292)Foreign-born:
17.0% (577)
Hispanic or Latino - Speak another language Native:
52.1% (2,439)Foreign-born:
83.9% (2,850)
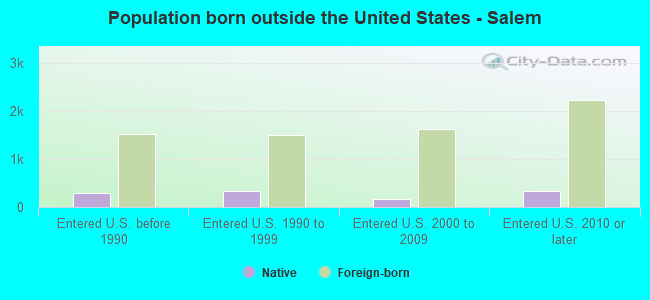
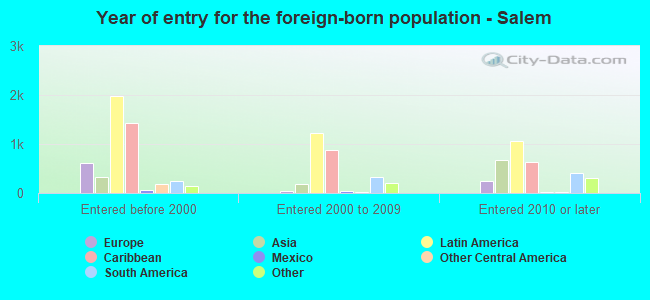
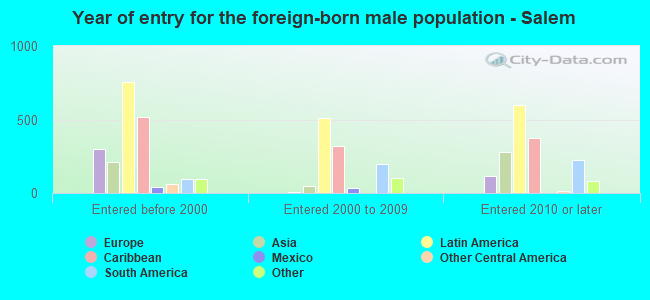
Foreign-born residents in Salem 6,726 residents are foreign born (8.9% Latin America , 2.6% Asia , 2.0% Europe ).
This city:
15.1%Massachusetts:
17.6%
Marital status for residents in Salem Marital status - White (Caucasian) population 15 years and over
Males 42.1% Never married46.3% Now married1.0% Separated1.7% Widowed8.8% DivorcedFemales 43.3% Never married35.6% Now married1.9% Separated6.9% Widowed12.3% DivorcedWomen who gave birth in the past 12 months Now married:
58.4% (245)Unmarried:
41.6% (174)
Women who did not give birth in the past 12 months Now married:
31.3% (2,561)Unmarried:
68.7% (5,632)
Marital status - Black or African American population 15 years and over
Males 61.4% Never married36.9% Now married0.0% Separated0.0% Widowed1.7% DivorcedFemales 52.3% Never married34.9% Now married2.6% Separated8.2% Widowed2.0% DivorcedWomen who gave birth in the past 12 months Now married:
0.0% (0)Unmarried:
100.0% (45)
Women who did not give birth in the past 12 months Now married:
42.7% (300)Unmarried:
57.3% (403)
Marital status - American Indian / Alaska Native population 15 years and over
Males 0.0% Never married0.0% Now married0.0% Separated0.0% Widowed100.0% DivorcedFemales 0.0% Never married100.0% Now married0.0% Separated0.0% Widowed0.0% DivorcedWomen who did not give birth in the past 12 months Now married:
100.0% (64)Unmarried:
0.0% (0)
Marital status - Asian population 15 years and over
Males 55.1% Never married36.9% Now married0.0% Separated6.1% Widowed1.9% DivorcedFemales 35.4% Never married56.8% Now married0.0% Separated5.9% Widowed1.9% DivorcedWomen who gave birth in the past 12 months Now married:
100.0% (20)Unmarried:
0.0% (0)
Women who did not give birth in the past 12 months Now married:
54.0% (264)Unmarried:
46.0% (225)
Marital status - Other race population 15 years and over
Males 45.8% Never married44.6% Now married2.9% Separated0.0% Widowed6.7% DivorcedFemales 38.5% Never married39.2% Now married8.5% Separated4.6% Widowed9.1% DivorcedWomen who did not give birth in the past 12 months Now married:
52.3% (459)Unmarried:
47.7% (419)
Marital status - Two or more races population 15 years and over
Males 35.9% Never married33.0% Now married13.3% Separated1.2% Widowed16.6% DivorcedFemales 65.4% Never married24.4% Now married0.6% Separated2.3% Widowed7.3% DivorcedWomen who gave birth in the past 12 months Now married:
88.4% (81)Unmarried:
11.6% (11)
Women who did not give birth in the past 12 months Now married:
13.0% (172)Unmarried:
87.0% (1,150)
Marital status - White alone, not Hispanic / Latino population 15 years and over
Males 40.8% Never married47.5% Now married0.7% Separated1.8% Widowed9.3% DivorcedFemales 40.5% Never married37.5% Now married1.7% Separated7.4% Widowed12.9% DivorcedWomen who gave birth in the past 12 months Now married:
85.6% (219)Unmarried:
14.4% (37)
Women who did not give birth in the past 12 months Now married:
32.3% (2,505)Unmarried:
67.7% (5,258)
Marital status - Hispanic or Latino population 15 years and over
Males 47.1% Never married38.0% Now married8.6% Separated0.3% Widowed5.9% DivorcedFemales 59.6% Never married26.1% Now married4.4% Separated3.3% Widowed6.6% DivorcedWomen who gave birth in the past 12 months Now married:
38.6% (108)Unmarried:
61.4% (172)
Women who did not give birth in the past 12 months Now married:
29.1% (689)Unmarried:
70.9% (1,682)
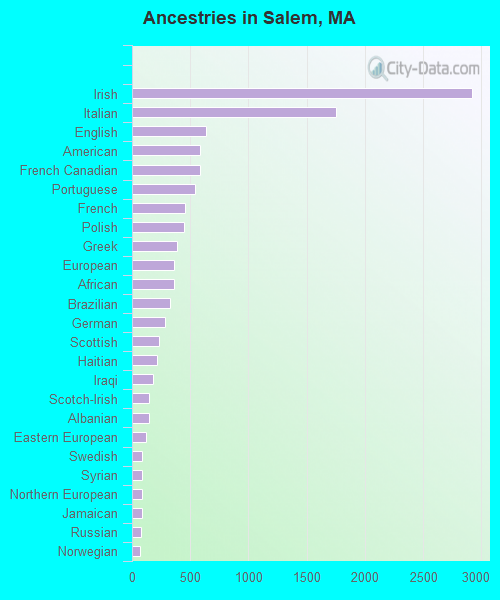
Ancestries in Salem
2,920 14.3% Irish1,756 8.6% Italian638 3.1% English588 2.9% American587 2.9% French Canadian545 2.7% Portuguese451 2.2% French443 2.2% Polish389 1.9% Greek364 1.8% European358 1.8% African325 1.6% Brazilian287 1.4% German235 1.1% Scottish219 1.1% Haitian177 0.9% Iraqi146 0.7% Scotch-Irish143 0.7% Albanian122 0.6% Eastern European90 0.4% Swedish88 0.4% Syrian87 0.4% Northern European85 0.4% Jamaican79 0.4% Russian69 0.3% Norwegian69 0.3% Romanian67 0.3% Ukrainian59 0.3% Finnish59 0.3% Yugoslavian57 0.3% Canadian51 0.2% Cape Verdean49 0.2% Moroccan40 0.2% Turkish32 0.2% Danish32 0.2% Swiss31 0.2% Nigerian30 0.1% Hungarian26 0.1% Armenian26 0.1% Scandinavian25 0.1% Cypriot24 0.1% British23 0.1% Trinidadian and Tobagonian20 0.10% Lebanese18 0.09% Iranian15 0.07% Welsh12 0.06% Dutch11 0.05% Jordanian9 0.04% Czech8 0.04% Czechoslovakian8 0.04% British West Indian4 0.02% Lithuanian3 0.01% Guyanese
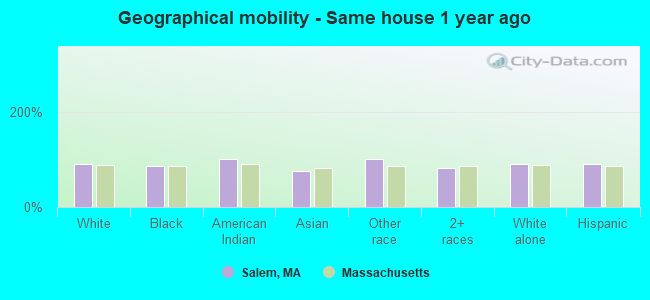
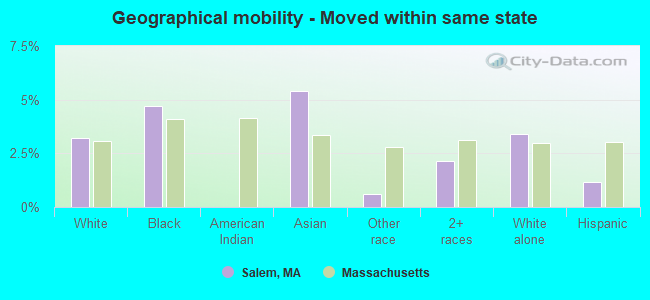
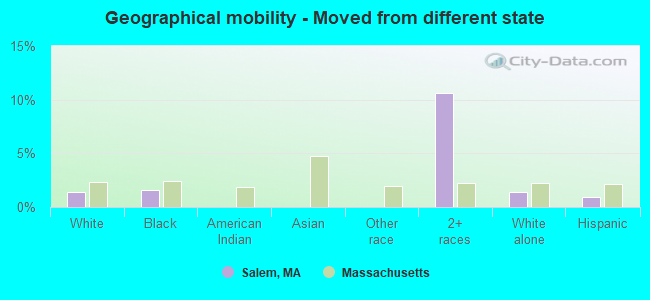
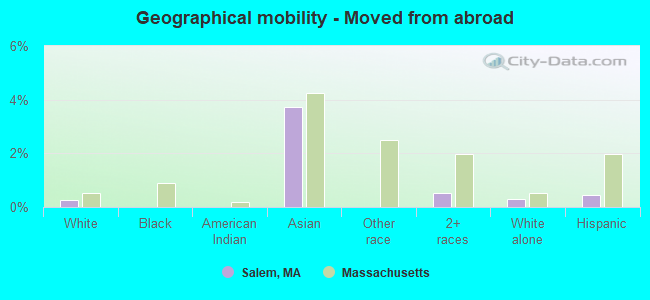
Geographical mobility in Salem Same house 1 year ago 28,228 90.5% White (Caucasian)2,214 85.5% Black or African American132 100.0% American Indian / Alaska Native1,142 76.2% Asian3,547 100.0% Other race3,679 82.0% Two or more races26,563 90.6% White alone, not Hispanic / Latino7,886 90.8% Hispanic or LatinoMoved within same county 1,458 4.7% White / Caucasian202 7.8% Black or African American128 8.6% Asian387 8.6% Two or more races1,262 4.3% White alone, not Hispanic / Latino517 5.9% Hispanic or LatinoMoved within same state 1,010 3.2% White / Caucasian122 4.7% Black or African American81 5.4% Asian21 0.6% Other race97 2.2% Two or more races995 3.4% White alone, not Hispanic / Latino102 1.2% Hispanic or LatinoMoved from different state 429 1.4% White / Caucasian41 1.6% Black or African American475 10.6% Two or more races413 1.4% White alone, not Hispanic / Latino77 0.9% Hispanic or LatinoMoved from abroad 82 0.3% White56 3.7% Asian24 0.5% Two or more races89 0.3% White alone, not Hispanic / Latino40 0.5% Hispanic or Latino
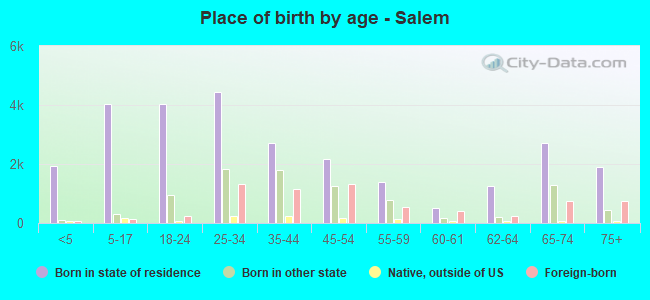
Children Nativity (place of birth) in Salem
Children under 6 years - Living with two parents Both parents native 1,068 100.0% NativeBoth parents foreign-born 495 95.9% Native21 4.1% Foreign-bornOne native, one foreign-born parent 151 100.0% NativeChildren under 6 years - Living with one parent Native parent 633 100.0% NativeForeign-born parent 188 100.0% NativeChildren 6 to 17 years - Living with two parents Both parents native 1,020 100.0% NativeBoth parents foreign-born 804 93.3% Native58 6.7% Foreign-bornOne native, one foreign-born parent 361 92.4% Native30 7.6% Foreign-bornChildren 6 to 17 years - Living with one parent Native parent 1,542 100.0% NativeForeign-born parent 366 53.2% Native323 46.8% Foreign-born
Grandparents responsible for own grandchildren in Salem
Grandparents (30 to 59 years) White / Caucasian 49 100.0% Not responsible for grandchildrenWhite alone, not Hispanic / Latino 53 100.0% Not responsible for grandchildrenHispanic or Latino 6 100.0% Not responsible for grandchildren
Grandparents (60 years and over) White / Caucasian 219 100.0% Not responsible for grandchildrenWhite alone, not Hispanic / Latino 200 100.0% Not responsible for grandchildrenHispanic or Latino 93 100.0% Not responsible for grandchildren