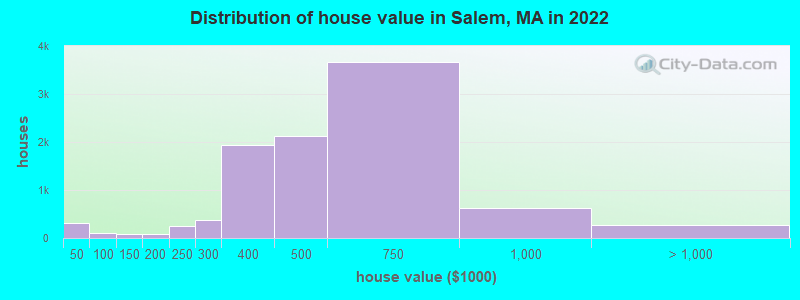
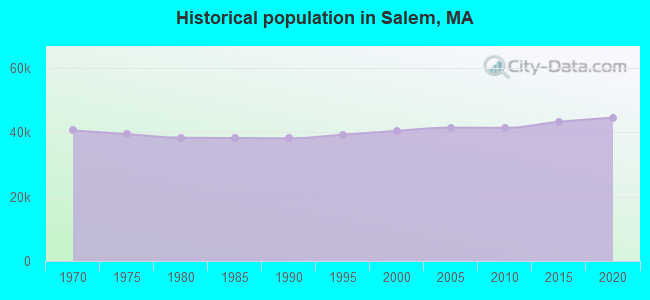
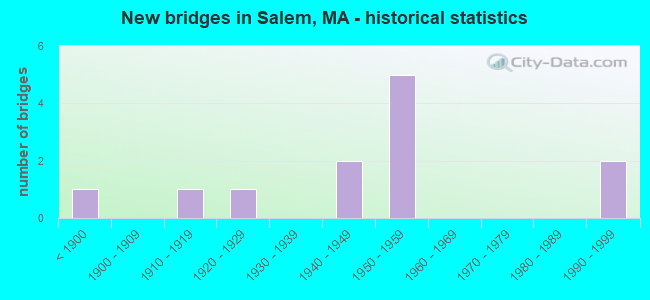
Estimated median house or condo value in 2022: $503,657 (it was $188,300 in 2000)
Salem:
$503,657
MA:
$534,700
Mean prices in 2022:all housing units: $546,504; detached houses: $578,713; townhouses or other attached units: $560,505; in 2-unit structures: $566,944; in 3-to-4-unit structures: $505,667; in 5-or-more-unit structures: $428,162; occupied boats, rvs, vans, etc.: $114,185
Median gross rent in 2022: $1,799.
March 2022 cost of living index in Salem: 138.1 (high, U.S. average is 100)
Percentage of residents living in poverty in 2022: 13.7%
(8.9% for White Non-Hispanic residents, 18.8% for Black residents, 25.5% for Hispanic or Latino residents, 43.2% for American Indian residents, 16.6% for other race residents, 18.9% for two or more races residents)
According to our research of Massachusetts and other state lists, there were 28 registered sex offenders living in Salem, Massachusetts as of April 27, 2024. The ratio of all residents to sex offenders in Salem is 1,548 to 1. The ratio of registered sex offenders to all residents in this city is near the state average.
Crime rates in Salem by year
Type
2009
2010
2011
2012
2013
2014
2015
2016
2017
2018
2019
2020
2021
2022
Murders (per 100,000)
0 (0.0)
1 (2.4)
0 (0.0)
0 (0.0)
0 (0.0)
0 (0.0)
1 (2.3)
2 (4.7)
0 (0.0)
0 (0.0)
0 (0.0)
1 (2.3)
0 (0.0)
0 (0.0)
Rapes (per 100,000)
11 (26.2)
15 (36.3)
15 (36.1)
7 (16.7)
3 (7.1)
8 (18.7)
7 (16.2)
11 (25.6)
19 (43.8)
5 (11.5)
14 (32.2)
16 (37.1)
7 (15.9)
10 (22.1)
Robberies (per 100,000)
22 (52.3)
26 (62.9)
22 (52.9)
17 (40.5)
22 (51.8)
26 (60.7)
23 (53.4)
33 (76.9)
28 (64.5)
22 (50.4)
21 (48.3)
16 (37.1)
15 (34.0)
11 (24.3)
Assaults (per 100,000)
81 (192.7)
146 (353.2)
82 (197.2)
135 (321.2)
103 (242.5)
120 (280.1)
94 (218.1)
85 (198.2)
69 (159.0)
57 (130.6)
73 (168.0)
75 (173.8)
78 (176.8)
64 (141.1)
Burglaries (per 100,000)
183 (435.3)
213 (515.2)
173 (415.9)
148 (352.2)
135 (317.9)
103 (240.4)
171 (396.8)
111 (258.8)
113 (260.5)
97 (222.3)
87 (200.3)
47 (108.9)
67 (151.9)
57 (125.7)
Thefts (per 100,000)
685 (1,629)
729 (1,763)
744 (1,789)
754 (1,794)
1,058 (2,491)
1,019 (2,378)
1,087 (2,523)
877 (2,045)
787 (1,814)
689 (1,579)
595 (1,370)
565 (1,309)
482 (1,092)
452 (996.8)
Auto thefts (per 100,000)
68 (161.7)
73 (176.6)
69 (165.9)
53 (126.1)
45 (106.0)
35 (81.7)
52 (120.7)
45 (104.9)
51 (117.6)
40 (91.7)
46 (105.9)
38 (88.1)
40 (90.7)
28 (61.7)
Arson (per 100,000)
0 (0.0)
0 (0.0)
0 (0.0)
3 (7.1)
8 (18.8)
2 (4.7)
0 (0.0)
2 (4.7)
3 (6.9)
0 (0.0)
6 (13.8)
6 (13.9)
0 (0.0)
7 (15.4)
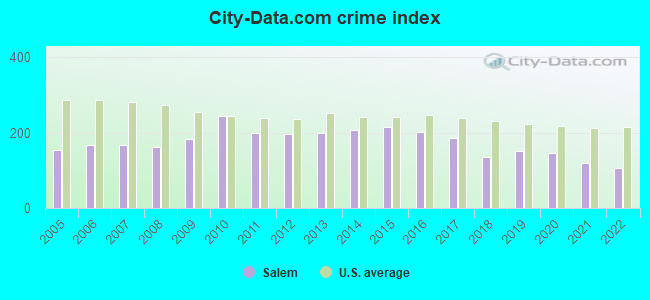
City-Data.com crime index
183.7
244.1
198.1
196.2
200.1
207.6
215.6
200.9
186.4
136.5
151.2
147.2
119.8
106.8
The City-Data.com crime index weighs serious crimes and violent crimes more heavily. Higher means more crime, U.S. average is 246.1. It adjusts for the number of visitors and daily workers commuting into cities.
Ancestries: Irish (14.3%), Italian (8.7%), American (3.1%), French Canadian (3.0%), English (2.8%), Portuguese (2.7%).
Current Local Time: EST time zone
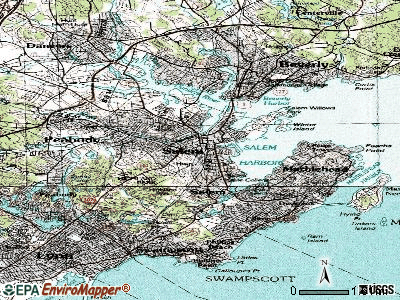
Elevation: 9 feet
Land area: 8.10 square miles.
Population density: 5,518 people per square mile (average).
6,726 residents are foreign born (8.9% Latin America, 2.6% Asia, 2.0% Europe).
This city:
15.1%
Massachusetts:
17.6%
Median real estate property taxes paid for housing units with mortgages in 2022: $5,822 (1.2%) Median real estate property taxes paid for housing units with no mortgage in 2022: $5,689 (1.1%)
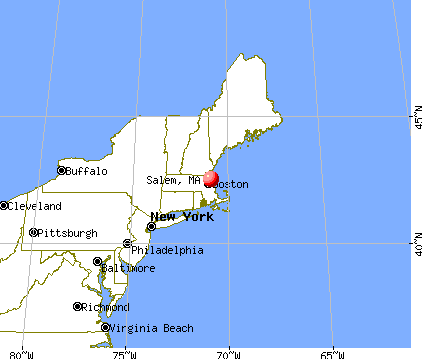
Nearest city with pop. 50,000+: Lynn, MA (4.2 miles , pop. 89,050).
Nearest city with pop. 200,000+: Boston, MA (16.6 miles , pop. 589,141).
Nearest city with pop. 1,000,000+: Bronx, NY (192.2 miles , pop. 1,332,650).
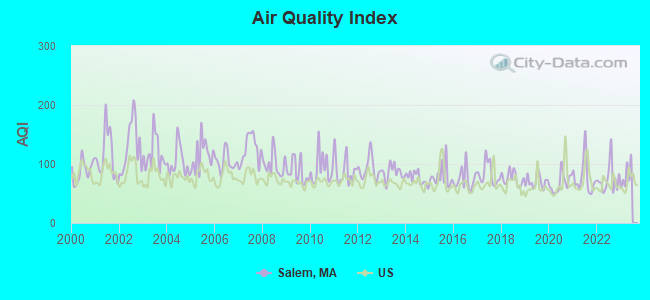
Air Quality Index (AQI) level in 2022 was 74.3. This is about average.
City:
74.3
U.S.:
72.6
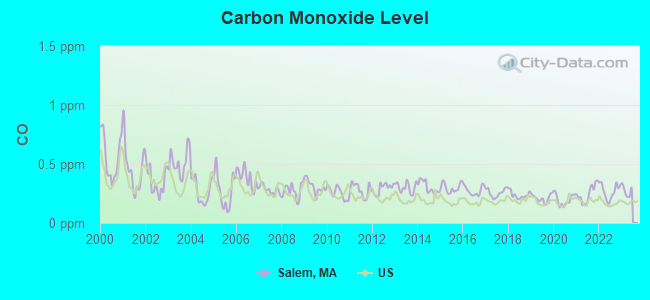
Carbon Monoxide (CO) [ppm] level in 2022 was 0.269. This is about average.Closest monitor was 11.6 miles away from the city center.
City:
0.269
U.S.:
0.251
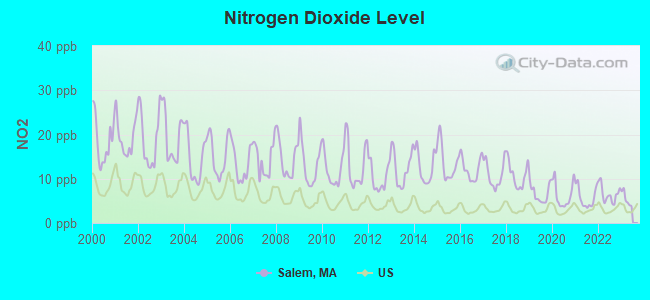
Nitrogen Dioxide (NO2) [ppb] level in 2022 was 6.51. This is worse than average.Closest monitor was 1.9 miles away from the city center.
City:
6.51
U.S.:
5.11
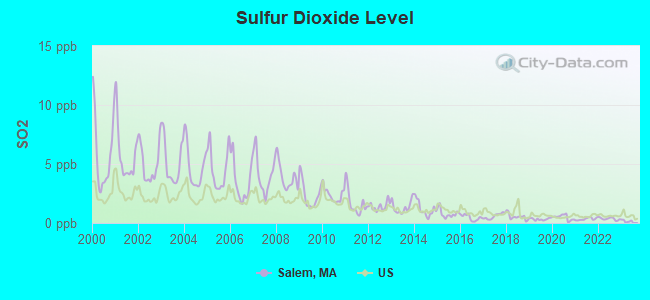
Sulfur Dioxide (SO2) [ppb] level in 2022 was 0.358. This is significantly better than average.Closest monitor was 0.7 miles away from the city center.
City:
0.358
U.S.:
1.515
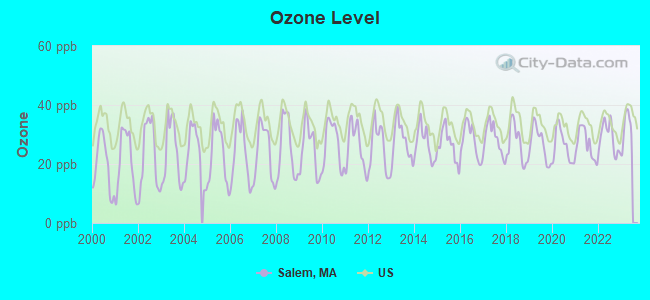
Ozone [ppb] level in 2022 was 28.9. This is about average.Closest monitor was 0.9 miles away from the city center.
City:
28.9
U.S.:
33.3
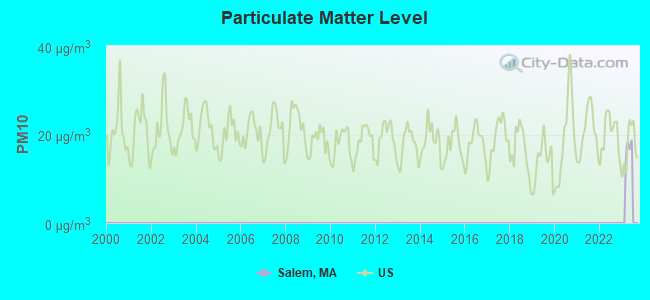
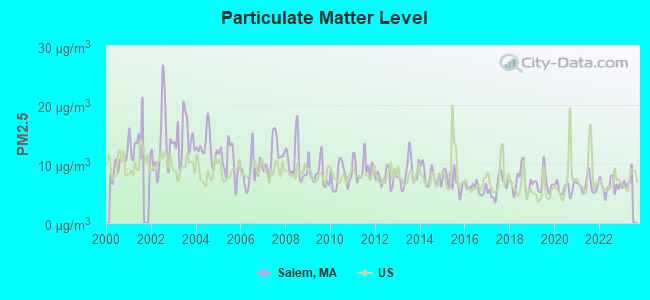
Particulate Matter (PM2.5) [µg/m3] level in 2022 was 6.30. This is better than average.Closest monitor was 4.7 miles away from the city center.
City:
6.30
U.S.:
8.11
Tornado activity:
Salem-area historical tornado activity is slightly below Massachusetts state average. It is 50% smaller than the overall U.S. average.
On 6/9/1953, a category F4 (max. wind speeds 207-260 mph) tornado 35.1 miles away from the Salem city center killed 90 peopleand injured 1228 peopleand causedbetween $50,000,000 and $500,000,000 in damages.
On 9/29/1974, a category F3 (max. wind speeds 158-206 mph) tornado 16.9 miles away from the city center injured one personand causedbetween $50,000 and $500,000 in damages.
Earthquake activity:
Salem-area historical earthquake activity is significantly above Massachusetts state average. It is 74% smaller than the overall U.S. average.
On 4/20/2002 at 10:50:47, a magnitude 5.3 (5.3 ML, Depth: 3.0 mi, Class: Moderate, Intensity: VI - VII) earthquake occurred 196.9 miles away from Salem center On 10/7/1983 at 10:18:46, a magnitude 5.3 (5.1 MB, 5.3 LG, 5.1 ML) earthquake occurred 199.9 miles away from the city center On 10/16/2012 at 23:12:25, a magnitude 4.7 (4.7 ML, Depth: 10.0 mi, Class: Light, Intensity: IV - V) earthquake occurred 75.7 miles away from the city center On 1/19/1982 at 00:14:42, a magnitude 4.7 (4.5 MB, 4.7 MD, 4.5 LG) earthquake occurred 76.7 miles away from the city center On 4/20/2002 at 10:50:47, a magnitude 5.2 (5.2 MB, 4.2 MS, 5.2 MW, 5.0 MW) earthquake occurred 196.4 miles away from the city center On 8/22/1992 at 12:20:32, a magnitude 4.8 (4.8 MB, 3.8 MS, 4.7 LG, Depth: 6.2 mi) earthquake occurred 237.9 miles away from the city center Magnitude types: regional Lg-wave magnitude (LG), body-wave magnitude (MB), duration magnitude (MD), local magnitude (ML), surface-wave magnitude (MS), moment magnitude (MW)
Natural disasters:
The number of natural disasters in Essex County (33) is a lot greater than the US average (15). Major Disasters (Presidential) Declared: 20 Emergencies Declared: 13
Causes of natural disasters: Floods: 14, Storms: 11, Hurricanes: 6, Snowstorms: 5, Winter Storms: 5, Snows: 3, Blizzards: 2, Fire: 1, Heavy Rain: 1, Snowfall: 1, Water Main Break: 1, Wind: 1 (Note: some incidents may be assigned to more than one category).
Hospitals and medical centers in Salem:
NORTH SHORE CHILDRENS HOSPITAL (57 HIGHLAND AVENUE)
NORTH SHORE MEDICAL CENTER (Voluntary non-profit - Private, 81 HIGHLAND AVENUE)
SALEM HOSPITAL CORPORATION,THE (81 HIGHLAND AVENUE)
GROSVENOR PARK (7 LORING HILLS AVENUE)
NEWHALL MANOR NURSING HOME (7 CARPENTER ST)
TRANSITIONAL CARE UNIT AT SPAULDING HOSP NORTH SHO (DOVE AVENUE)
SALEM NORTHEAST DIALYSIS (10 COLONIAL ROAD)
SERAPHIC SPRINGS HEALTHCARE (121 LORING AVENUE, SUITE 810)
SALEM PUBLIC LIBRARY (Operating income: $1,252,607; Location: 370 ESSEX ST.; 119,242 books; 11,294 audio materials; 15,317 video materials; 7 local licensed databases; 34 state licensed databases; 11 other licensed databases; 99 print serial subscriptions)
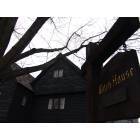
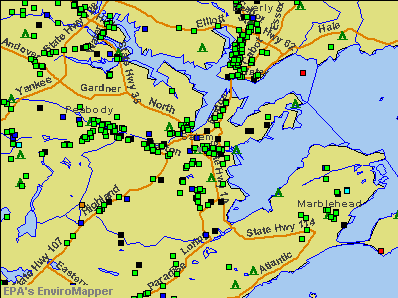
Notable locations in Salem: Hatchs Wharf (A), Hawthorne Birthplace (B), Hawthorne Cove Marina (C), Kernwood Golf Course (D), Derby Wharf Light (E), Salem Station (F), Pickering Wharf (G), Highland Plaza (H), Derby Wharf (I), Essex Institute Museum Building (J), John Ward House (K), Gardner-Pingree House (L), Andrew-Safford House (M), Ropes Mansion and Garden (N), Jonathan Corwin House (O), Salem Fire Department Station 4 (P), Salem Fire Department Station 5 (Q), Salem Fire Department Station 2 (R), Salem City Hall (S), Hathaway House (T). Display/hide their locations on the map
Shopping Centers: East India Mall Shopping Center (1), Hawthorne Square Mall Shopping Center (2), Highlander Plaza Shopping Center (3), Hawthorne Square Mall (4). Display/hide their locations on the map
Churches in Salem include: Prophet Elias Monastery (A), Grace Episcopal Church (B), First Church Unitarian Church (C), First Baptist Church in Salem (D), Crombie Street United Church (E), Christian Renewal Church (F). Display/hide their locations on the map
Parks in Salem include: Forest River Park (1), Highland Park (2), Salem Common (3), Kernwood Park (4), Crowninshield-Bentley House (5), Charter Street Historic District (6), Chestnut Street District (7), Salem Maritime National Historic Site (8), Winter Island Maritime Park (9). Display/hide their locations on the map
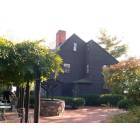
Tourist attractions: House Of The Seven Gables Settlement (Cultural Attractions- Events- & Facilities; 114 Derby), House of The Seven Gables Historic Sites (Cultural Attractions- Events- & Facilities; 54 Turner St), Museum Of Hawthorne & Poe The (Cultural Attractions- Events- & Facilities; 285 Derby), Salem Willows Amusement Park (Amusement & Theme Parks; 173 Fort Avenue), North Shore Conference Center Museum Place Mall (123 Essex Street), Destination Salem (63 Wharf Street), L H Resources (29 Leach Street), New England Pirate Museum (274 Derby Street), North Shore Children's Museum (209 Essex Street).
Hotels: Hawthorne Hotel (18 Washington Square West), Lafayette Hotel (116 Lafayette Street), Salem Inn (7 Summer Street).
Courts: Mass Commonwealth - Superior Court (34 Federal Street), Mass Commonwealth - Courts- Juvenile Courts- Salem Juvenile Court- Clerks (45 Congress Street), Essex County - Superior Court- District Attorney (1 East India Square Mall), Essex County - Probate and Family Court (36 Federal Street), Essex County - District Courts- District Court of Salem- Clerks Office (65 Washington Street).
Birthplace of: Charles Grafton Page - Physicist, Frank Weston Benson - Artist, Edward Filene - Businessman and philanthropist, Paul Douglas - Politician, Jones Very - Poet and essayist, John F. Tierney - Politician, Nathaniel Hawthorne - (1804-1864), author, Gardner Dozois - Science fiction writer, Eric M. Hammel - Military historian, Nathaniel Bowditch - Mathematician.
Essex County has a predicted average indoor radon screening level greater than 4 pCi/L (pico curies per liter) - Highest Potential
Drinking water stations with addresses in Salem that have no violations reported:
SALEM WATER DEPARTMENT (Address: 4TH FLOOR , Population served: 40,407,Primary Water Source Type: Purch surface water)
Average household size:
This city:
2.2 people
Massachusetts:
2.5 people
Percentage of family households:
This city:
54.1%
Whole state:
63.0%
Percentage of households with unmarried partners:
This city:
8.5%
Whole state:
7.0%
Likely homosexual households (counted as self-reported same-sex unmarried-partner households)
Lesbian couples: 0.8% of all households
Gay men: 0.7% of all households
People in group quarters in Salem in 2010:
1,478 people in college/university student housing
156 people in nursing facilities/skilled-nursing facilities
59 people in emergency and transitional shelters (with sleeping facilities) for people experiencing homelessness
43 people in other noninstitutional facilities
23 people in group homes intended for adults
11 people in residential treatment centers for juveniles (non-correctional)
People in group quarters in Salem in 2000:
897 people in college dormitories (includes college quarters off campus)
149 people in nursing homes
72 people in other noninstitutional group quarters
16 people in homes or halfway houses for drug/alcohol abuse
13 people in homes for abused, dependent, and neglected children
9 people in religious group quarters
4 people in homes for the mentally retarded
Banks with most branches in Salem (2011 data):
Eastern Bank: Pickering Wharf Branch, Washington Street Branch, Loring Avenue Branch, Highlander Branch. Info updated 2011/03/30: Bank assets: $7,812.9 mil, Deposits: $6,295.8 mil, headquarters in Boston, MA, positive income, Commercial Lending Specialization, 94 total offices, Holding Company: Eastern Bank Corporation
People's United Bank: Salem Branch, Salem Branch, Trader's Way Branch. Info updated 2012/02/16: Bank assets: $27,319.3 mil, Deposits: $20,835.4 mil, headquarters in Bridgeport, CT, positive income, Commercial Lending Specialization, 374 total offices
Salem Five Cents Savings Bank: Directbanking Branch, Salem Branch, at 71 Washington Street. Info updated 2011/07/11: Bank assets: $2,876.6 mil, Deposits: $2,019.1 mil, local headquarters, positive income, Commercial Lending Specialization, 23 total offices, Holding Company: Salem Five Bancorp
North Shore Bank, a Co-operative Bank: Staples Plaza Branch at 3-27 Paradise Road, branch established on 2005/04/13; Highland Avenue Branch at 319 Highland Avenue, branch established on 1998/02/17. Info updated 2006/11/03: Bank assets: $453.6 mil, Deposits: $345.2 mil, headquarters in Peabody, MA, positive income, Commercial Lending Specialization, 8 total offices, Holding Company: North Shore Bancorp
Bank of America, National Association: Salem Branch at 193 Washington Street, branch established on 1990/07/09; Vinnin Square Branch at 21 Paradise Road, branch established on 2002/09/23. Info updated 2009/11/18: Bank assets: $1,451,969.3 mil, Deposits: $1,077,176.8 mil, headquarters in Charlotte, NC, positive income, 5782 total offices, Holding Company: Bank Of America Corporation
Century Bank and Trust Company: Salem Branch at 37 Central Street, branch established on 1947/12/01. Info updated 2010/05/27: Bank assets: $2,740.5 mil, Deposits: $2,148.1 mil, headquarters in Somerville, MA, positive income, Mortgage Lending Specialization, 25 total offices, Holding Company: Century Bancorp, Inc.
Beverly Co-operative Bank: Salem Branch at 73 Lafayette Street, branch established on 2004/05/27. Info updated 2006/11/03: Bank assets: $297.6 mil, Deposits: $245.9 mil, headquarters in Beverly, MA, positive income, Commercial Lending Specialization, 6 total offices, Holding Company: Beverly Financial, Mhc
Sovereign Bank, National Association: Salem Branch at 253 Essex St, branch established on 2000/07/24. Info updated 2012/01/31: Bank assets: $78,146.9 mil, Deposits: $48,042.9 mil, headquarters in Wilmington, DE, positive income, Commercial Lending Specialization, 718 total offices, Holding Company: Banco Santander, S.A.
TD Bank, National Association: Salem Branch at 600 Loring Avenue, branch established on 1997/08/26. Info updated 2010/10/04: Bank assets: $188,912.6 mil, Deposits: $153,149.8 mil, headquarters in Wilmington, DE, positive income, 1314 total offices, Holding Company: Toronto-Dominion Bank, The
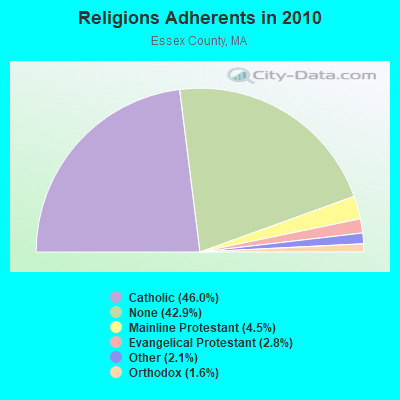
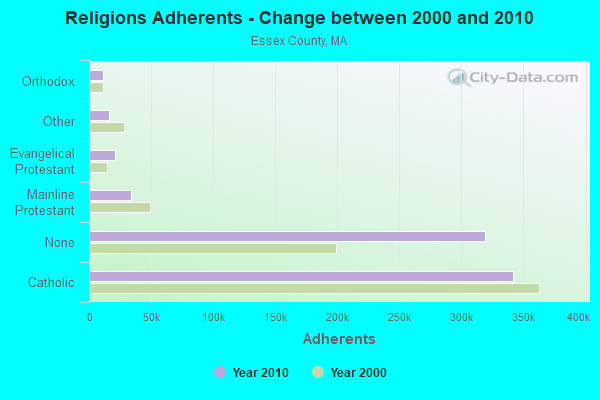
Religion statistics for Salem, MA (based on Essex County data)
Religion
Adherents
Congregations
Catholic
341,970
55
Mainline Protestant
33,710
140
Evangelical Protestant
20,925
160
Other
15,882
63
Orthodox
11,590
13
Black Protestant
376
3
None
318,706
-
Source: Clifford Grammich, Kirk Hadaway, Richard Houseal, Dale E.Jones, Alexei Krindatch, Richie Stanley and Richard H.Taylor. 2012. 2010 U.S.Religion Census: Religious Congregations & Membership Study. Association of Statisticians of American Religious Bodies. Jones, Dale E., et al. 2002. Congregations and Membership in the United States 2000. Nashville, TN: Glenmary Research Center. Graphs represent county-level data
Aircraft: CESSNA 150K (Category: Land, Seats: 2, Weight: Up to 12,499 Pounds, Speed: 90 mph), Engine: CONT MOTOR 0-200 SERIES (100 HP) (Reciprocating) N-Number: 6092G, N6092G, N-6092G, Serial Number: 15071592, Year manufactured: 1969, Airworthiness Date: 12/11/1969, Certificate Issue Date: 12/15/2015 Registrant (Co-Owned): Joseph J Trustee Michallyszyn, 6 Center St, Salem, MA 01970, Other Owners: Lianne Trustee Feener
Aircraft: KONRATH RAYMOND J MONNETT-MONERAI S (Category: Land, Weight: Up to 12,499 Pounds), Engine: None N-Number: 75RK, N75RK, N-75RK, Serial Number: 0003, Airworthiness Date: 08/08/1984, Certificate Issue Date: 03/03/1999 Registrant (Individual): Edward S Mansfield, 14 Hemenway Rd, Salem, MA 01970
Aircraft: RUEHLE HP-14 (Category: Land, Weight: Up to 12,499 Pounds, Speed: 60 mph), Engine: None N-Number: 9159, N9159, N-9159, Serial Number: WHR-2, Year manufactured: 1969, Airworthiness Date: 04/01/1980, Certificate Issue Date: 06/13/2001 Registrant (Individual): Edward S Mansfield, 14 Hemenway Rd, Salem, MA 01970
Aircraft: FREEFLY SYSTEMS ALTA (Category: Land, Engines: 6), Engine: Electric N-Number: 52PS, N52PS, N-52PS, Serial Number: 979544, Certificate Issue Date: 05/19/2016 Registrant (LLC): Pictures From The Sky LLC, 222 Derby St, Salem, MA 01970
Aircraft: DJI INSPIRE 1 (Category: Land, Engines: 4), Engine: Electric N-Number: 63PS, N63PS, N-63PS, Serial Number: W13DCC23030265, Certificate Issue Date: 05/26/2016 Registrant (LLC): Pictures From The Sky LLC, 222 Derby St, Salem, MA 01970
Home Mortgage Disclosure Act Aggregated Statistics For Year 2009 (Based on 9 full tracts)
A) FHA, FSA/RHS & VA Home Purchase Loans
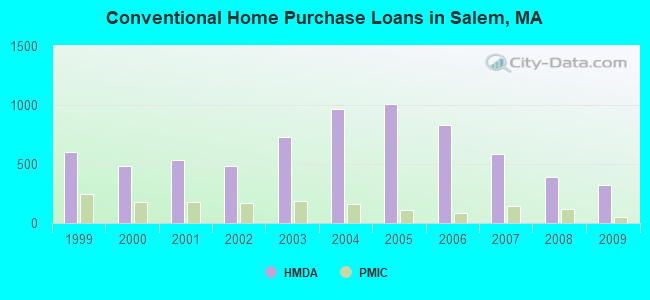
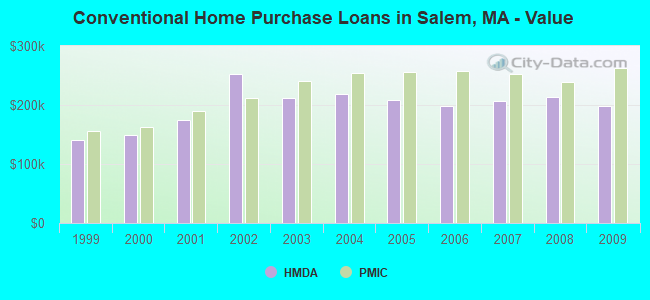
B) Conventional Home Purchase Loans
C) Refinancings
D) Home Improvement Loans
E) Loans on Dwellings For 5+ Families
F) Non-occupant Loans on < 5 Family Dwellings (A B C & D)
Number
Average Value
Number
Average Value
Number
Average Value
Number
Average Value
Number
Average Value
Number
Average Value
LOANS ORIGINATED
155
$255,406
326
$199,098
976
$221,198
41
$131,317
7
$622,714
57
$209,018
APPLICATIONS APPROVED, NOT ACCEPTED
11
$263,091
15
$200,733
69
$238,696
2
$115,000
1
$400,000
3
$193,333
APPLICATIONS DENIED
31
$199,161
44
$168,932
280
$249,679
34
$118,118
2
$489,000
29
$217,069
APPLICATIONS WITHDRAWN
18
$241,000
49
$193,735
178
$247,652
6
$244,833
0
$0
13
$236,462
FILES CLOSED FOR INCOMPLETENESS
6
$233,333
8
$207,625
42
$224,976
2
$50,000
0
$0
3
$144,000
Aggregated Statistics For Year 2008 (Based on 9 full tracts)
A) FHA, FSA/RHS & VA Home Purchase Loans
B) Conventional Home Purchase Loans
C) Refinancings
D) Home Improvement Loans
E) Loans on Dwellings For 5+ Families
F) Non-occupant Loans on < 5 Family Dwellings (A B C & D)
Number
Average Value
Number
Average Value
Number
Average Value
Number
Average Value
Number
Average Value
Number
Average Value
LOANS ORIGINATED
83
$266,795
389
$213,039
479
$236,213
57
$116,351
14
$418,357
103
$234,544
APPLICATIONS APPROVED, NOT ACCEPTED
8
$260,250
34
$242,765
67
$271,060
9
$97,889
2
$506,500
10
$251,800
APPLICATIONS DENIED
14
$217,500
50
$253,240
239
$253,063
50
$51,540
2
$287,500
37
$272,162
APPLICATIONS WITHDRAWN
8
$236,000
54
$205,537
101
$251,149
6
$146,333
0
$0
14
$256,857
FILES CLOSED FOR INCOMPLETENESS
2
$180,000
12
$161,500
31
$243,290
2
$151,500
0
$0
3
$114,667
Aggregated Statistics For Year 2007 (Based on 9 full tracts)
A) FHA, FSA/RHS & VA Home Purchase Loans
B) Conventional Home Purchase Loans
C) Refinancings
D) Home Improvement Loans
E) Loans on Dwellings For 5+ Families
F) Non-occupant Loans on < 5 Family Dwellings (A B C & D)
G) Loans On Manufactured Home Dwelling (A B C & D)
Number
Average Value
Number
Average Value
Number
Average Value
Number
Average Value
Number
Average Value
Number
Average Value
Number
Average Value
LOANS ORIGINATED
19
$283,737
581
$207,196
636
$224,160
108
$92,981
19
$393,421
95
$236,884
3
$48,333
APPLICATIONS APPROVED, NOT ACCEPTED
0
$0
73
$187,274
126
$234,825
15
$51,600
1
$420,000
23
$242,348
1
$17,000
APPLICATIONS DENIED
7
$290,571
118
$245,915
410
$252,971
59
$106,017
1
$300,000
45
$224,356
1
$35,000
APPLICATIONS WITHDRAWN
4
$335,750
51
$201,392
165
$245,067
12
$117,833
3
$526,667
11
$215,091
0
$0
FILES CLOSED FOR INCOMPLETENESS
0
$0
12
$286,417
51
$267,118
3
$38,333
0
$0
2
$164,000
0
$0
Aggregated Statistics For Year 2006 (Based on 9 full tracts)
A) FHA, FSA/RHS & VA Home Purchase Loans
B) Conventional Home Purchase Loans
C) Refinancings
D) Home Improvement Loans
E) Loans on Dwellings For 5+ Families
F) Non-occupant Loans on < 5 Family Dwellings (A B C & D)
G) Loans On Manufactured Home Dwelling (A B C & D)
Number
Average Value
Number
Average Value
Number
Average Value
Number
Average Value
Number
Average Value
Number
Average Value
Number
Average Value
LOANS ORIGINATED
5
$317,800
833
$198,125
917
$211,641
164
$95,177
15
$574,067
132
$231,894
2
$32,500
APPLICATIONS APPROVED, NOT ACCEPTED
0
$0
98
$184,051
118
$201,966
23
$67,870
2
$280,500
23
$248,696
0
$0
APPLICATIONS DENIED
0
$0
147
$205,803
470
$232,785
73
$107,301
1
$132,000
50
$234,300
1
$200,000
APPLICATIONS WITHDRAWN
0
$0
81
$231,259
327
$245,012
16
$136,938
3
$466,667
22
$268,273
2
$257,500
FILES CLOSED FOR INCOMPLETENESS
0
$0
20
$172,300
59
$240,780
5
$145,000
0
$0
8
$225,875
0
$0
Aggregated Statistics For Year 2005 (Based on 9 full tracts)
A) FHA, FSA/RHS & VA Home Purchase Loans
B) Conventional Home Purchase Loans
C) Refinancings
D) Home Improvement Loans
E) Loans on Dwellings For 5+ Families
F) Non-occupant Loans on < 5 Family Dwellings (A B C & D)
G) Loans On Manufactured Home Dwelling (A B C & D)
Number
Average Value
Number
Average Value
Number
Average Value
Number
Average Value
Number
Average Value
Number
Average Value
Number
Average Value
LOANS ORIGINATED
4
$244,000
1,010
$208,030
1,145
$220,649
146
$137,082
13
$347,923
177
$246,559
0
$0
APPLICATIONS APPROVED, NOT ACCEPTED
0
$0
104
$222,096
88
$192,852
13
$148,308
0
$0
13
$276,308
2
$100,000
APPLICATIONS DENIED
2
$210,500
135
$202,674
417
$242,010
66
$105,258
3
$1,024,000
34
$244,118
4
$144,750
APPLICATIONS WITHDRAWN
0
$0
130
$227,246
296
$219,777
33
$174,485
3
$288,333
31
$255,452
1
$130,000
FILES CLOSED FOR INCOMPLETENESS
0
$0
28
$199,929
120
$292,983
2
$120,000
0
$0
6
$336,167
0
$0
Aggregated Statistics For Year 2004 (Based on 9 full tracts)
A) FHA, FSA/RHS & VA Home Purchase Loans
B) Conventional Home Purchase Loans
C) Refinancings
D) Home Improvement Loans
E) Loans on Dwellings For 5+ Families
F) Non-occupant Loans on < 5 Family Dwellings (A B C & D)
G) Loans On Manufactured Home Dwelling (A B C & D)
Number
Average Value
Number
Average Value
Number
Average Value
Number
Average Value
Number
Average Value
Number
Average Value
Number
Average Value
LOANS ORIGINATED
10
$316,300
970
$217,835
1,250
$210,190
115
$119,365
24
$641,083
166
$249,139
2
$35,000
APPLICATIONS APPROVED, NOT ACCEPTED
0
$0
83
$230,024
127
$208,559
26
$113,423
1
$1,050,000
25
$262,160
2
$50,000
APPLICATIONS DENIED
1
$257,000
121
$212,835
320
$227,191
74
$82,270
3
$491,667
39
$243,308
3
$45,000
APPLICATIONS WITHDRAWN
1
$175,000
108
$219,093
300
$212,190
24
$97,083
2
$87,000
19
$277,158
3
$156,000
FILES CLOSED FOR INCOMPLETENESS
1
$347,000
27
$194,926
186
$214,000
5
$169,600
0
$0
10
$275,100
0
$0
Aggregated Statistics For Year 2003 (Based on 9 full tracts)
A) FHA, FSA/RHS & VA Home Purchase Loans
B) Conventional Home Purchase Loans
C) Refinancings
D) Home Improvement Loans
E) Loans on Dwellings For 5+ Families
F) Non-occupant Loans on < 5 Family Dwellings (A B C & D)
Number
Average Value
Number
Average Value
Number
Average Value
Number
Average Value
Number
Average Value
Number
Average Value
LOANS ORIGINATED
39
$256,282
732
$211,947
2,905
$174,778
49
$52,755
28
$441,250
212
$200,448
APPLICATIONS APPROVED, NOT ACCEPTED
0
$0
52
$212,731
290
$179,693
24
$30,667
2
$750,000
13
$243,154
APPLICATIONS DENIED
9
$271,778
92
$208,380
562
$180,806
56
$50,911
1
$200,000
57
$227,035
APPLICATIONS WITHDRAWN
3
$302,667
75
$202,173
369
$194,274
20
$37,750
0
$0
24
$225,042
FILES CLOSED FOR INCOMPLETENESS
0
$0
11
$176,364
47
$201,702
0
$0
0
$0
3
$224,000
Aggregated Statistics For Year 2002 (Based on 7 full tracts)
A) FHA, FSA/RHS & VA Home Purchase Loans
B) Conventional Home Purchase Loans
C) Refinancings
D) Home Improvement Loans
E) Loans on Dwellings For 5+ Families
F) Non-occupant Loans on < 5 Family Dwellings (A B C & D)
Number
Average Value
Number
Average Value
Number
Average Value
Number
Average Value
Number
Average Value
Number
Average Value
LOANS ORIGINATED
34
$243,794
482
$252,481
1,556
$169,551
58
$37,966
27
$400,481
162
$196,086
APPLICATIONS APPROVED, NOT ACCEPTED
1
$204,000
49
$210,367
133
$160,376
18
$30,889
0
$0
15
$175,067
APPLICATIONS DENIED
7
$251,000
51
$211,373
206
$173,515
39
$41,103
3
$335,667
31
$196,581
APPLICATIONS WITHDRAWN
4
$184,250
42
$184,738
221
$171,036
18
$56,667
3
$366,000
15
$133,067
FILES CLOSED FOR INCOMPLETENESS
0
$0
11
$210,182
54
$168,463
2
$40,000
2
$214,500
7
$166,571
Aggregated Statistics For Year 2001 (Based on 7 full tracts)
A) FHA, FSA/RHS & VA Home Purchase Loans
B) Conventional Home Purchase Loans
C) Refinancings
D) Home Improvement Loans
E) Loans on Dwellings For 5+ Families
F) Non-occupant Loans on < 5 Family Dwellings (A B C & D)
Number
Average Value
Number
Average Value
Number
Average Value
Number
Average Value
Number
Average Value
Number
Average Value
LOANS ORIGINATED
41
$208,146
535
$175,237
1,273
$154,134
59
$46,644
18
$1,417,833
137
$178,555
APPLICATIONS APPROVED, NOT ACCEPTED
1
$225,000
37
$171,973
130
$139,669
19
$32,895
3
$542,333
19
$164,158
APPLICATIONS DENIED
7
$199,571
74
$157,851
215
$142,098
46
$42,239
0
$0
24
$139,792
APPLICATIONS WITHDRAWN
5
$206,400
33
$160,909
169
$148,426
19
$31,684
3
$5,766,667
10
$133,100
FILES CLOSED FOR INCOMPLETENESS
2
$192,000
2
$200,000
28
$161,536
1
$3,000
0
$0
1
$58,000
Aggregated Statistics For Year 2000 (Based on 7 full tracts)
A) FHA, FSA/RHS & VA Home Purchase Loans
B) Conventional Home Purchase Loans
C) Refinancings
D) Home Improvement Loans
E) Loans on Dwellings For 5+ Families
F) Non-occupant Loans on < 5 Family Dwellings (A B C & D)
Number
Average Value
Number
Average Value
Number
Average Value
Number
Average Value
Number
Average Value
Number
Average Value
LOANS ORIGINATED
32
$195,562
485
$149,561
264
$121,383
46
$29,130
20
$265,950
74
$139,041
APPLICATIONS APPROVED, NOT ACCEPTED
3
$194,667
43
$141,326
45
$119,511
17
$35,412
2
$127,500
13
$134,308
APPLICATIONS DENIED
8
$185,375
68
$164,559
150
$104,920
44
$30,205
2
$125,000
22
$133,773
APPLICATIONS WITHDRAWN
5
$127,600
49
$129,163
99
$110,404
10
$29,600
2
$211,500
7
$100,857
FILES CLOSED FOR INCOMPLETENESS
0
$0
14
$126,071
32
$122,781
3
$86,667
0
$0
3
$130,667
Aggregated Statistics For Year 1999 (Based on 7 full and 1 partial tracts)
A) FHA, FSA/RHS & VA Home Purchase Loans
B) Conventional Home Purchase Loans
C) Refinancings
D) Home Improvement Loans
E) Loans on Dwellings For 5+ Families
F) Non-occupant Loans on < 5 Family Dwellings (A B C & D)
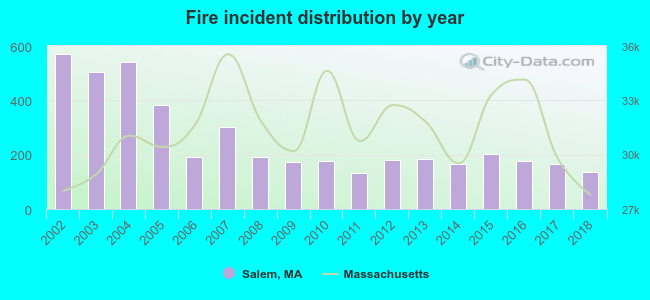
2002 - 2018 National Fire Incident Reporting System (NFIRS) incidents
According to the data from the years 2002 - 2018 the average number of fire incidents per year is 258. The highest number of fires - 571 took place in 2002, and the least - 132 in 2011. The data has a declining trend.
When looking into fire subcategories, the most reports belonged to: Structure Fires (55.7%), and Outside Fires (36.8%).
Fire incident types reported to NFIRS in Salem, MA


 Recent articles from our blog. Our writers, many of them Ph.D. graduates or candidates, create easy-to-read articles on a wide variety of topics.

 (4.2 miles

 According to the data from the years 2002 - 2018 the average number of fire incidents per year is 258. The highest number of fires - 571 took place in 2002, and the least - 132 in 2011. The data has a declining trend.
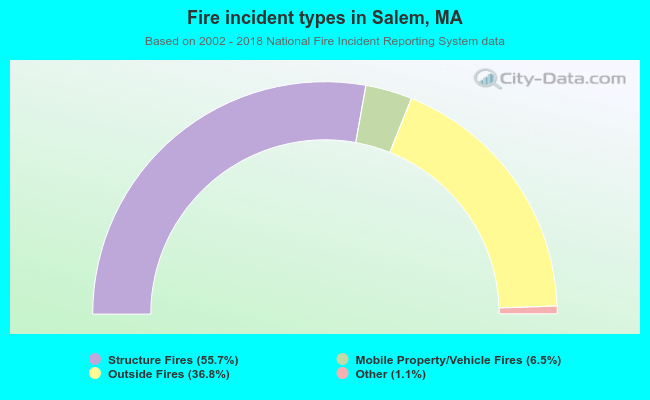 When looking into fire subcategories, the most reports belonged to: Structure Fires (55.7%), and Outside Fires (36.8%).