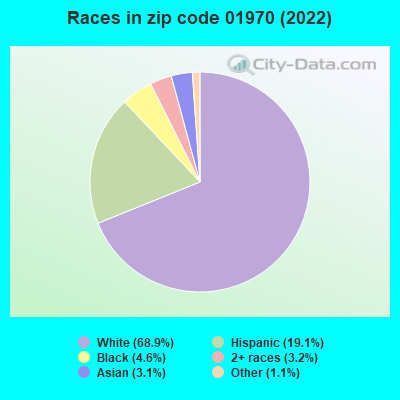
Estimated zip code population in 2022: 44,420 Zip code population in 2010: 41,109 Zip code population in 2000: 40,407
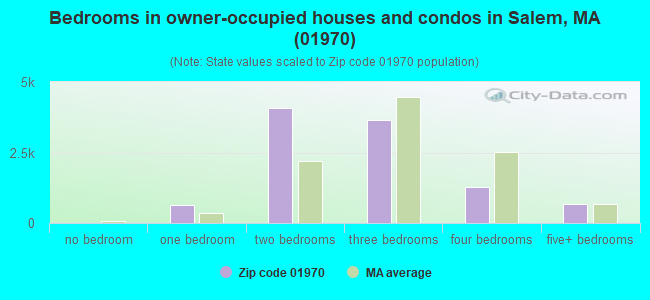
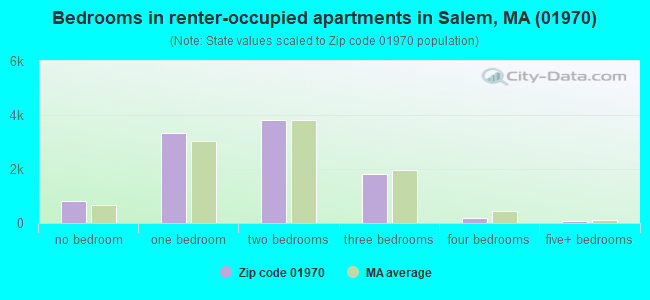
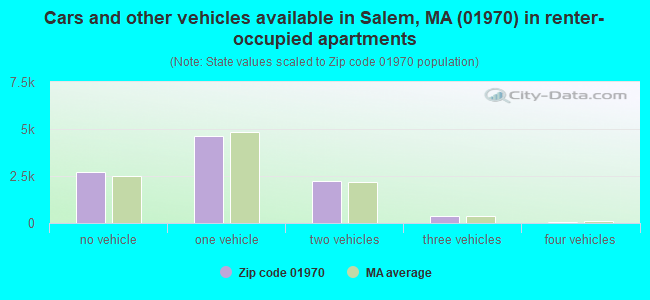
Houses and condos: 21,285 Renter-occupied apartments: 10,025
% of renters here:
49%
State:
38%
March 2022 cost of living index in zip code 01970: 135.3 (high, U.S. average is 100)
Land area: 8.1 sq. mi. Water area: 5.5 sq. mi.
Population density: 5,478 people per square mile
(average).
OSM Map
Google Map
MSN Map
OSM Map
General Map
Google Map
MSN Map
OSM Map
Google Map
MSN Map
OSM Map
Google Map
MSN Map
Please wait while loading the map...
Real estate property taxes paid for housing units in 2022:
This zip code:
1.1% ($5,900)
Massachusetts:
1.0% ($5,536)
Median real estate property taxes paid for housing units with mortgages in 2022: $5,915 (1.1%) Median real estate property taxes paid for housing units with no mortgage in 2022: $5,851 (1.2%)
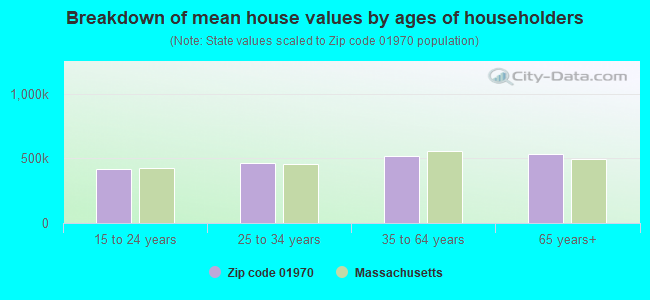
Estimated median house/condo value in 2022: $513,374
01970:
$513,374
Massachusetts:
$534,700
According to our research of Massachusetts and other state lists, there were 31 registered sex offenders living in 01970 zip code as of April 27, 2024. The ratio of all residents to sex offenders in zip code 01970 is 1,396 to 1. The ratio of registered sex offenders to all residents in this zip code is near the state average.
Median resident age:
This zip code:
38.5 years
Massachusetts median age:
40.3 years
Average household size:
This zip code:
2.1 people
Massachusetts:
2.4 people
Averages for the 2020 tax year for zip code 01970, filed in 2021:
Average Adjusted Gross Income (AGI) in 2020: $71,763 (Individual Income Tax Returns)
Here:
$71,763
State:
$105,130
Salary/wage: $63,588 (reported on 83.6% of returns)
Here:
$63,588
State:
$82,951
(% of AGI for various income ranges: 1120.9% for AGIs below $25k, 3485.1% for AGIs $25k-50k, 6650.8% for AGIs $50k-75k, 9813.9% for AGIs $75k-100k, 19418.2% for AGIs $100k-200k, 75714.2% for AGIs over 200k)
Taxable interest for individuals: $1,017 (reported on 31.6% of returns)
This zip code:
$1,017
Massachusetts:
$2,361
(% of AGI for various income ranges: 18.7% for AGIs below $25k, 14.8% for AGIs $25k-50k, 35.8% for AGIs $50k-75k, 58.9% for AGIs $75k-100k, 103.5% for AGIs $100k-200k, 521.1% for AGIs over 200k)
Ordinary dividends: $4,036 (reported on 19.7% of returns)
Here:
$4,036
State:
$10,365
(% of AGI for various income ranges: 28.2% for AGIs below $25k, 33.5% for AGIs $25k-50k, 62.3% for AGIs $50k-75k, 118.2% for AGIs $75k-100k, 264.6% for AGIs $100k-200k, 1831.9% for AGIs over 200k)
Net capital gain/loss in AGI: +$14,413 (reported on 17.4% of returns)
Here:
+$14,413
State:
+$48,178
(% of AGI for various income ranges: 7.6% for AGIs below $25k, 21.9% for AGIs $25k-50k, 56.4% for AGIs $50k-75k, 172.0% for AGIs $75k-100k, 624.4% for AGIs $100k-200k, 11094.7% for AGIs over 200k)
Profit/loss from business: +$16,373 (reported on 15.8% of returns)
Here:
+$16,373
State:
+$20,792
(% of AGI for various income ranges: 128.2% for AGIs below $25k, 159.0% for AGIs $25k-50k, 231.8% for AGIs $50k-75k, 418.1% for AGIs $75k-100k, 750.0% for AGIs $100k-200k, 5195.3% for AGIs over 200k)
Taxable individual retirement arrangement distribution: $19,328 (reported on 8.2% of returns)
01970:
$19,328
Massachusetts:
$22,790
(% of AGI for various income ranges: 55.6% for AGIs below $25k, 83.6% for AGIs $25k-50k, 207.5% for AGIs $50k-75k, 287.4% for AGIs $75k-100k, 581.5% for AGIs $100k-200k, 2138.1% for AGIs over 200k)
Self-employed (Keogh) retirement plans: $18,000 (reported on 0.7% of returns)
01970:
$18,000
Massachusetts:
$26,868
(% of AGI for various income ranges: 12.9% for AGIs $50k-75k, 45.0% for AGIs $100k-200k, 425.6% for AGIs over 200k)
Total itemized deductions: $25,835 (reported on 12.2% of returns)
Here:
$25,835
State:
$36,722
(% of AGI for various income ranges: 74.3% for AGIs below $25k, 127.4% for AGIs $25k-50k, 376.9% for AGIs $50k-75k, 740.6% for AGIs $75k-100k, 1094.6% for AGIs $100k-200k, 5101.1% for AGIs over 200k)
Charity contributions: $4,391 (reported on 9.0% of returns)
Here:
$4,391
State:
$12,529
(% of AGI for various income ranges: 4.1% for AGIs below $25k, 8.2% for AGIs $25k-50k, 26.3% for AGIs $50k-75k, 52.9% for AGIs $75k-100k, 107.8% for AGIs $100k-200k, 1348.6% for AGIs over 200k)
Taxes paid: $8,503 (reported on 12.1% of returns)
01970:
$8,503
State:
$8,782
(% of AGI for various income ranges: 18.5% for AGIs below $25k, 35.1% for AGIs $25k-50k, 138.5% for AGIs $50k-75k, 291.0% for AGIs $75k-100k, 403.7% for AGIs $100k-200k, 1214.4% for AGIs over 200k)
Earned income credit: $1,896 (reported on 11.2% of returns)
Here:
$1,896
State:
$1,909
(% of AGI for various income ranges: 67.0% for AGIs below $25k, 48.3% for AGIs $25k-50k, 0.5% for AGIs $50k-75k)
Percentage of individuals using paid preparers for their 2020 taxes: 93.2%
Here:
93%
State:
92%
(% for various income ranges: 91.1% for AGIs below $25k, 94.0% for AGIs $25k-50k, 93.5% for AGIs $50k-75k, 92.9% for AGIs $75k-100k, 94.4% for AGIs $100k-200k, 95.5% for AGIs over 200k)
Averages for the 2012 tax year for zip code 01970, filed in 2013:
Average Adjusted Gross Income (AGI) in 2012: $54,852 (Individual Income Tax Returns)
Here:
$54,852
State:
$81,425
Salary/wage: $49,516 (reported on 86.1% of returns)
Here:
$49,516
State:
$64,752
(% of AGI for various income ranges: 75.4% for AGIs below $25k, 81.7% for AGIs $25k-50k, 81.8% for AGIs $50k-75k, 79.2% for AGIs $75k-100k, 82.9% for AGIs $100k-200k, 57.0% for AGIs over 200k)
Taxable interest for individuals: $927 (reported on 35.0% of returns)
This zip code:
$927
Massachusetts:
$2,136
(% of AGI for various income ranges: 1.1% for AGIs below $25k, 0.5% for AGIs $25k-50k, 0.6% for AGIs $50k-75k, 0.6% for AGIs $75k-100k, 0.4% for AGIs $100k-200k, 0.8% for AGIs over 200k)
Ordinary dividends: $3,518 (reported on 18.7% of returns)
Here:
$3,518
State:
$9,473
(% of AGI for various income ranges: 1.4% for AGIs below $25k, 0.9% for AGIs $25k-50k, 0.9% for AGIs $50k-75k, 1.0% for AGIs $75k-100k, 1.0% for AGIs $100k-200k, 2.4% for AGIs over 200k)
Net capital gain/loss in AGI: +$6,714 (reported on 13.2% of returns)
Here:
+$6,714
State:
+$31,437
(% of AGI for various income ranges: 0.1% for AGIs $25k-50k, 0.4% for AGIs $50k-75k, 0.6% for AGIs $75k-100k, 1.0% for AGIs $100k-200k, 8.5% for AGIs over 200k)
Profit/loss from business: +$15,897 (reported on 14.0% of returns)
Here:
+$15,897
State:
+$20,662
(% of AGI for various income ranges: 8.3% for AGIs below $25k, 4.0% for AGIs $25k-50k, 3.2% for AGIs $50k-75k, 3.5% for AGIs $75k-100k, 3.1% for AGIs $100k-200k, 5.3% for AGIs over 200k)
Taxable individual retirement arrangement distribution: $13,990 (reported on 9.1% of returns)
01970:
$13,990
Massachusetts:
$18,892
(% of AGI for various income ranges: 2.8% for AGIs below $25k, 2.3% for AGIs $25k-50k, 2.1% for AGIs $50k-75k, 2.5% for AGIs $75k-100k, 2.2% for AGIs $100k-200k, 2.5% for AGIs over 200k)
Self-employment retirement plans: $18,460 (reported on 0.7% of returns)
01970:
$18,460
Massachusetts:
$20,669
(% of AGI for various income ranges: 0.1% for AGIs below $25k, 0.2% for AGIs $50k-75k, 0.3% for AGIs $100k-200k, 0.8% for AGIs over 200k)
Total itemized deductions: $21,073 (22% of AGI, reported on 34.1% of returns)
Here:
$21,073
State:
$28,907
Here:
21.5% of AGI
State:
18.2% of AGI
(% of AGI for various income ranges: 11.7% for AGIs below $25k, 8.8% for AGIs $25k-50k, 13.3% for AGIs $50k-75k, 14.4% for AGIs $75k-100k, 15.0% for AGIs $100k-200k, 13.3% for AGIs over 200k)
Charity contributions: $1,961 (reported on 27.4% of returns)
Here:
$1,961
State:
$4,208
(% of AGI for various income ranges: 0.5% for AGIs below $25k, 0.6% for AGIs $25k-50k, 0.9% for AGIs $50k-75k, 1.0% for AGIs $75k-100k, 1.1% for AGIs $100k-200k, 1.7% for AGIs over 200k)
Taxes paid: $8,865 (reported on 34.0% of returns)
01970:
$8,865
State:
$13,303
(% of AGI for various income ranges: 2.7% for AGIs below $25k, 2.9% for AGIs $25k-50k, 5.0% for AGIs $50k-75k, 5.9% for AGIs $75k-100k, 7.2% for AGIs $100k-200k, 6.8% for AGIs over 200k)
Earned income credit: $2,028 (reported on 15.2% of returns)
Here:
$2,028
State:
$1,971
(% of AGI for various income ranges: 5.6% for AGIs below $25k, 0.6% for AGIs $25k-50k)
Percentage of individuals using paid preparers for their 2012 taxes: 55.3%
Here:
55%
State:
56%
(% for various income ranges: 53.6% for AGIs below $25k, 53.7% for AGIs $25k-50k, 55.5% for AGIs $50k-75k, 56.6% for AGIs $75k-100k, 58.9% for AGIs $100k-200k, 75.6% for AGIs over 200k)
Averages for the 2004 tax year for zip code 01970, filed in 2005:
Average Adjusted Gross Income (AGI) in 2004: $45,453 (Individual Income Tax Returns)
Here:
$45,453
State:
$62,877
Salary/wage: $42,860 (reported on 85.6% of returns)
Here:
$42,860
State:
$52,969
(% of AGI for various income ranges: 95.3% for AGIs below $10k, 75.7% for AGIs $10k-25k, 85.2% for AGIs $25k-50k, 84.3% for AGIs $50k-75k, 85.9% for AGIs $75k-100k, 72.9% for AGIs over 100k)
Taxable interest for individuals: $1,199 (reported on 49.8% of returns)
This zip code:
$1,199
Massachusetts:
$1,945
(% of AGI for various income ranges: 4.8% for AGIs below $10k, 2.3% for AGIs $10k-25k, 1.2% for AGIs $25k-50k, 1.1% for AGIs $50k-75k, 1.1% for AGIs $75k-100k, 1.2% for AGIs over 100k)
Taxable dividends: $2,050 (reported on 23.6% of returns)
Here:
$2,050
State:
$5,323
(% of AGI for various income ranges: 3.4% for AGIs below $10k, 1.6% for AGIs $10k-25k, 0.9% for AGIs $25k-50k, 1.1% for AGIs $50k-75k, 0.9% for AGIs $75k-100k, 1.1% for AGIs over 100k)
Net capital gain/loss: +$7,910 (reported on 17.8% of returns)
Here:
+$7,910
State:
+$20,377
(% of AGI for various income ranges: -1.6% for AGIs below $10k, 0.1% for AGIs $10k-25k, 0.3% for AGIs $25k-50k, 0.7% for AGIs $50k-75k, 1.3% for AGIs $75k-100k, 8.8% for AGIs over 100k)
Profit/loss from business: +$13,726 (reported on 13.7% of returns)
Here:
+$13,726
State:
+$17,837
(% of AGI for various income ranges: 10.6% for AGIs below $10k, 6.4% for AGIs $10k-25k, 3.4% for AGIs $25k-50k, 2.9% for AGIs $50k-75k, 2.9% for AGIs $75k-100k, 5.2% for AGIs over 100k)
IRA payment deduction: $2,857 (reported on 2.6% of returns)
01970:
$2,857
Massachusetts:
$3,100
(% of AGI for various income ranges: 0.3% for AGIs below $10k, 0.2% for AGIs $10k-25k, 0.3% for AGIs $25k-50k, 0.1% for AGIs $50k-75k, 0.2% for AGIs $75k-100k, 0.1% for AGIs over 100k)
Self-employed pension: $11,681 (reported on 1.0% of returns)
Here:
$11,681
Massachusetts:
$14,516
(% of AGI for various income ranges: 0.1% for AGIs $10k-25k, 0.1% for AGIs $25k-50k, 0.2% for AGIs $50k-75k, 0.2% for AGIs $75k-100k, 0.5% for AGIs over 100k)
Total itemized deductions: $17,765 (23% of AGI, reported on 36.4% of returns)
Here:
$17,765
State:
$22,573
Here:
22.8% of AGI
State:
19.5% of AGI
(% of AGI for various income ranges: 16.5% for AGIs below $10k, 10.5% for AGIs $10k-25k, 11.7% for AGIs $25k-50k, 15.7% for AGIs $50k-75k, 17.0% for AGIs $75k-100k, 14.5% for AGIs over 100k)
Charity contributions deductions: $1,846 (2% of AGI, reported on 32.8% of returns)
Here:
$1,846
State:
$3,295
Here:
2.3% of AGI
State:
2.7% of AGI
(% of AGI for various income ranges: 0.8% for AGIs below $10k, 0.9% for AGIs $10k-25k, 1.1% for AGIs $25k-50k, 1.4% for AGIs $50k-75k, 1.4% for AGIs $75k-100k, 1.5% for AGIs over 100k)
Total tax: $6,694 (reported on 79.1% of returns)
01970:
$6,694
State:
$11,494
(% of AGI for various income ranges: 3.1% for AGIs below $10k, 4.5% for AGIs $10k-25k, 8.3% for AGIs $25k-50k, 10.3% for AGIs $50k-75k, 11.3% for AGIs $75k-100k, 17.6% for AGIs over 100k)
Earned income credit: $1,615 (reported on 12.4% of returns)
Here:
$1,615
State:
$1,518
Percentage of individuals using paid preparers for their 2004 taxes: 59.6%
Here:
60%
State:
58%
(% for various income ranges: 55.0% for AGIs below $10k, 62.9% for AGIs $10k-25k, 55.9% for AGIs $25k-50k, 60.5% for AGIs $50k-75k, 61.5% for AGIs $75k-100k, 68.6% for AGIs over 100k)
Likely homosexual households (counted as self-reported same-sex unmarried-partner households)
Lesbian couples: 0.0% of all households
Gay men: 0.5% of all households
Household received Food Stamps/SNAP in the past 12 months: 3,898 Household did not receive Food Stamps/SNAP in the past 12 months: 16,484
Women who had a birth in the past 12 months: 589 (362 now married, 211 unmarried) Women who did not have a birth in the past 12 months: 11,996 (3,805 now married, 8,227 unmarried)
Housing units in zip code 01970 with a mortgage: 7,340 (1,129 second mortgage, 47 home equity loan, 1,009 both second mortgage and home equity loan) Houses without a mortgage: 166
Median monthly owner costs for units with a mortgage: $2,417 Median monthly owner costs for units without a mortgage: $1,018
Residents with income below the poverty level in 2022:
This zip code:
14.1%
Whole state:
10.4%
Residents with income below 50% of the poverty level in 2022:
This zip code:
9.1%
Whole state:
5.1%
Median number of rooms in houses and condos:
Here:
5.8
State:
6.5
Median number of rooms in apartments:
Here:
3.9
State:
4.0
Notable locations in this zip code not listed on our city pages
Notable locations in zip code 01970: Hatchs Wharf (A), Hawthorne Birthplace (B), Hawthorne Cove Marina (C), Kernwood Golf Course (D), Bakers Island Light (E), Derby Wharf Light (F), Salem Station (G), Pickering Wharf (H), Highland Plaza (I), Derby Wharf (J), Essex Institute Museum Building (K), John Ward House (L), Gardner-Pingree House (M), Andrew-Safford House (N), Ropes Mansion and Garden (O), Jonathan Corwin House (P), Salem Fire Department Station 4 (Q), Salem Fire Department Station 5 (R), Salem Fire Department Station 2 (S), Salem City Hall (T). Display/hide their locations on the map
Shopping Centers: East India Mall Shopping Center (1), Hawthorne Square Mall Shopping Center (2), Highlander Plaza Shopping Center (3), Hawthorne Square Mall (4). Display/hide their locations on the map
Churches in zip code 01970 include: Prophet Elias Monastery (A), Grace Episcopal Church (B), First Church Unitarian Church (C), First Baptist Church in Salem (D), Crombie Street United Church (E), Christian Renewal Church (F). Display/hide their locations on the map
Parks in zip code 01970 include: Forest River Park (1), Highland Park (2), Salem Common (3), Kernwood Park (4), Crowninshield-Bentley House (5), Charter Street Historic District (6), Chestnut Street District (7), Salem Maritime National Historic Site (8), Winter Island Maritime Park (9). Display/hide their locations on the map
Tourist attractions (not listed on the city page) : Home Stage (Arcades & Amusements; 144 Derby Street) (1), Kidstop Indoor Play Center (Arcades & Amusements; 400 Highland Ave) (2), Markopoko Productions (Arcades & Amusements; 25 Pleasant Street) (3). Display/hide their approximate locations on the map
3,875 married couples with children.
2,584 single-parent households (238 men, 2,346 women).
77.7% of residents of 01970 zip code speak English at home.
12.6% of residents speak Spanish at home (48% very well, 20% well, 19% not well, 13% not at all).
6.2% of residents speak other Indo-European language at home (62% very well, 24% well, 13% not well, 1% not at all).
1.6% of residents speak Asian or Pacific Island language at home (53% very well, 23% well, 19% not well, 5% not at all).
1.8% of residents speak other language at home (48% very well, 42% well, 10% not well, 1% not at all).
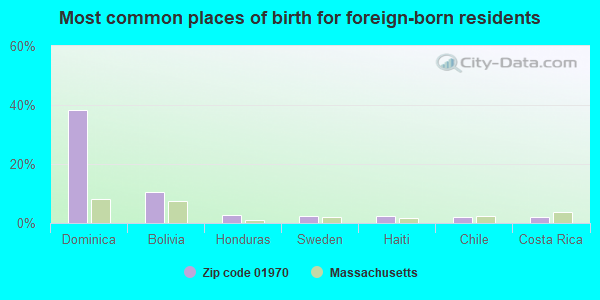
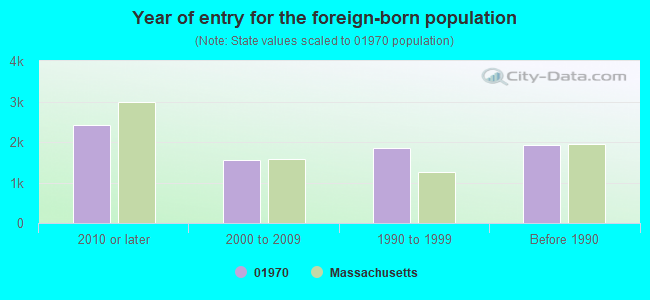
Foreign born population: 6,739 (15.2%) (64.8% of them are naturalized citizens)
Major facilities with environmental interests located in this zip code:
DOMINION ENERGY SALEM HARBOR POWER STATION (24 FORT AVENUE in SALEM, MA)
AIR MAJOR (AIRS/AFS) - ICIS-, ENFORCEMENT/COMPLIANCE ACTIVITY AIR PROGRAM (Clean Air Markets Division Business System) OIL CONTROL (Facility Response Plan for oil discharge) (Integrated Compliance Information System) - ICIS-01-2005-9085, ENFORCEMENT/COMPLIANCE ACTIVITY FORMAL ENFORCEMENT ACTION (Integrated Compliance Information System) - ICIS-01-2005-9085, ENFORCEMENT/COMPLIANCE ACTIVITY ENFORCEMENT/COMPLIANCE ACTIVITY (Integrated Compliance Information System) CRITERIA AND HAZARDOUS AIR POLLUTANT INVENTORY (Inventory of air pollution sources) National Pollutant Discharge Elimination System MAJOR (Tracking pollutant discharge elimination systems) - permit TSD (Resource Conservation and Recovery Act (tracking hazardous waste)) Small Quantity Generators, between 100 kg and 1000 kg of hazardous waste/month (Resource Conservation and Recovery Act (tracking hazardous waste)) - notification TRI REPORTER (Tracking of toxic chemicals releasing facilities) Business SIC classification: ELECTRIC SERVICES Organizations: US GEN NEW ENGLAND, INC. (CONTACT/OPERATOR)
, DOMINION ENERGY SALEM HARBOR, LLC (CONTACT/OPERATOR)
, USGEN NEW ENGLAND, INC. (OWNER/OPERATOR)
Alternative names: DOMINION ENERGY SALEM HARB STA, DOMINION ENERGY SALEM HARBOR STATION, NEW ENGLAND POWER CO, NEW ENGLAND POWER CO SALEM HARBOR, PG&E GENERATING COMPANY L.L.C. SALEM HARBOR STATION, SALEM HARBOR STATION, US GEN NE, INC. SALEM H. STA., US GEN NEW ENGLAND INC, UNITED STATES GEN NEW ENGLAND INCORPORATED SALEM HARBOR STATION, US GENERATING - SALEM HARBOR STA , USGEN NEW ENGLAND SA
NORTH SHORE MEDICAL CENTER (81 HIGHLAND AVENUE in SALEM, MA)
AIR SYNTHETIC MINOR (AIRS/AFS) COMPLIANCE ACTIVITY (Tracking inspections of insecticide, fungicide, and rodenticide, and toxic substances) CRITERIA AND HAZARDOUS AIR POLLUTANT INVENTORY (Inventory of air pollution sources) (Resource Conservation and Recovery Act (tracking hazardous waste)) Business SIC classification: GENERAL MEDICAL AND SURGICAL HOSPITALS Organizations: NORTH SHORE MEDICAL CTR (CONTACT/OPERATOR)
Alternative names: SALEM HOSPITAL
MASON TANNING COMPANY (4 WATERS ST. in SALEM, MA)
AIR MINOR (AIRS/AFS) CRITERIA AND HAZARDOUS AIR POLLUTANT INVENTORY (Inventory of air pollution sources) (Resource Conservation and Recovery Act (tracking hazardous waste)) Business SIC classification: LEATHER TANNING AND FINISHING Organizations: MASON TANNING CO INC (CONTACT/OWNER)
BENTLEY (25 MEMORIAL DRIVE in SALEM, MA)
(National Center for Education Statistics) - STATE ID-258005 Organizations: SALEM (SCHOOL DISTRICT)
BATES (53 LIBERTY HILL AVENUE in SALEM, MA)
(National Center for Education Statistics) - STATE ID-258003 Organizations: SALEM (SCHOOL DISTRICT)
COLLINS MIDDLE (29 HIGHLAND AVENUE in SALEM, MA)
(National Center for Education Statistics) - STATE ID-258305 Organizations: SALEM (SCHOOL DISTRICT)
NATHANIEL BOWDITCH (79 WILLSON STREET in SALEM, MA)
(National Center for Education Statistics) - STATE ID-258025 Organizations: SALEM (SCHOOL DISTRICT)
ATLANTIC EXTRUSION CORPORATION (96 SWAMPSCOTT ROAD in SALEM, MA)
AIR MINOR (AIRS/AFS) CRITERIA AND HAZARDOUS AIR POLLUTANT INVENTORY (Inventory of air pollution sources) Small Quantity Generators, between 100 kg and 1000 kg of hazardous waste/month (Resource Conservation and Recovery Act (tracking hazardous waste)) - notification Business SIC classification: PLASTICS PRODUCTS Business NAICS classification: CREAMERY BUTTER MANUFACTURING. Organizations: ATLANTIC EXTRUSIONS CORP (CONTACT/OPERATOR)
Alternative names: ATLANTIC EXTRUSIONS CORP
ADT 47 (53 MASON STREET in SALEM, MA)
(Integrated Compliance Information System) - ICIS-HQ-2002-6000, FORMAL ENFORCEMENT ACTION
KEYSPAN ENERGY DELIVERY NEW ENGLAND DBA (20 PIERCE STREET in SALEM, MA)
AIR SYNTHETIC MINOR (AIRS/AFS) SUPERFUND (Superfund database) CRITERIA AND HAZARDOUS AIR POLLUTANT INVENTORY (Inventory of air pollution sources) Conditionally Exempt Small Quantity Generators, less than 100 kg/month of hazardous waste (Resource Conservation and Recovery Act (tracking hazardous waste)) - notification Business SIC classification: NATURAL GAS DISTRIBUTION Organizations: BOSTON GAS COMPANY (CONTACT/OWNER)
Alternative names: BOSTON GAS CO, BOSTON GAS CO LNG PLT, BOSTON GAS SALEM LIQUEFIED NATURAL GAS, KEYSPAN ENERGY DELIVERY SALEM LNG
JIFFY LUBE 1934 (296 CANAL ST in SALEM, MA)
Conditionally Exempt Small Quantity Generators, less than 100 kg/month of hazardous waste (Resource Conservation and Recovery Act (tracking hazardous waste)) (Resource Conservation and Recovery Act (tracking hazardous waste)) Business NAICS classification: HEATING OIL DEALERS.; ALL OTHER AUTOMOTIVE REPAIR AND MAINTENANCE. Organizations: JIFFY LUBE #1934 (CONTACT/OPERATOR)
, JIFFY LUBE INTERNATIONAL INC (CONTACT/OWNER)
, SPEEDEE OIL CHANGE & TUNE UP (CONTACT/OWNER)
Alternative names: JIFFY LUBE STORE 1934, SPEEDEE OIL CHANGE & TUNE UP
BOWDITCH SCH RENOVATION SITE (35 FLINT ST in SALEM, MA)
(Integrated Compliance Information System) - ICIS-01-1985-0007, FORMAL ENFORCEMENT ACTION Business SIC classification: GENERAL CONTRACTORS-NONRESIDENTIAL BUILDINGS, OTHER THAN INDUSTRIAL BUILDINGS AND WAREHOUSES
BAY STATE ADHESIVE (9 SOUTH MASON STREET in SALEM, MA)
AIR MINOR (AIRS/AFS) CRITERIA AND HAZARDOUS AIR POLLUTANT INVENTORY (Inventory of air pollution sources) (Resource Conservation and Recovery Act (tracking hazardous waste)) Business SIC classification: PLASTICS MATERIALS, SYNTHETIC RESINS, AND NONVULCANIZABLE ELASTOMERS
Housing units lacking complete plumbing facilities: 0.3% Housing units lacking complete kitchen facilities: 0.9%
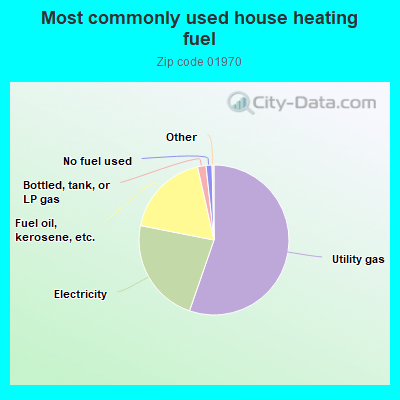
55.3%Utility gas
22.8%Electricity
18.4%Fuel oil, kerosene, etc.
1.8%Bottled, tank, or LP gas
1.3%No fuel used
Population in 1990: 37,642. Population change in the 1990s: +2,765 (+7.3%).
Place of birth for U.S.-born residents:
This state: 26,867
Northeast: 5,131
Midwest: 1,559
South: 1,950
West: 1,008
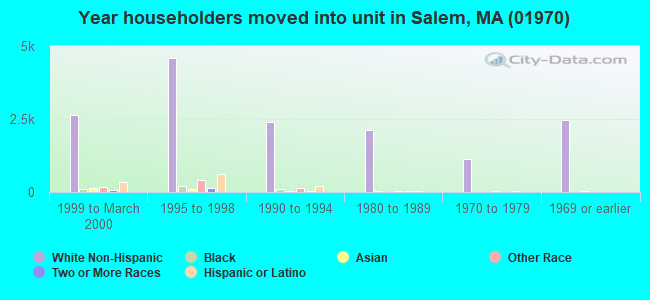
57% of the 01970 zip code residents lived in the same house 5 years ago. Out of people who lived in different houses, 66% lived in this county. Out of people who lived in different counties, 50% lived in Massachusetts.
91% of the 01970 zip code residents lived in the same house 1 year ago. Out of people who lived in different houses, 59% moved from this county. Out of people who lived in different houses, 27% moved from different county within same state. Out of people who lived in different houses, 11% moved from different state. Out of people who lived in different houses, 1% moved from abroad.
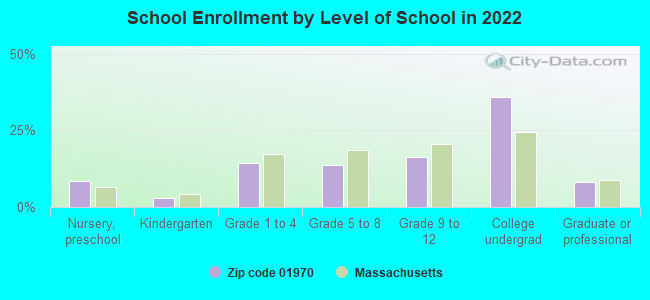
Private vs. public school enrollment:
Students in private schools in grades 1 to 8 (elementary and middle school): 270
Here:
10.8%
Massachusetts:
10.3%
Students in private schools in grades 9 to 12 (high school): 334
Here:
22.6%
Massachusetts:
12.3%
Students in private undergraduate colleges: 993
Here:
31.4%
Massachusetts:
51.2%
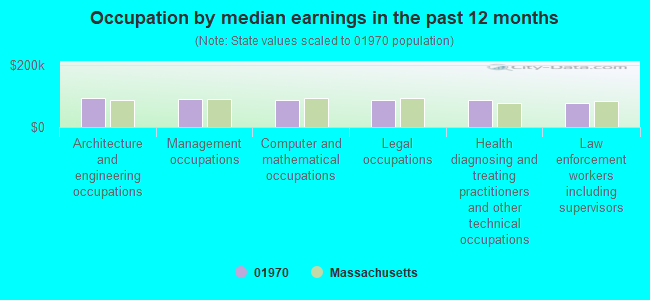
Occupation by median earnings in the past 12 months ($)
94,611Architecture and engineering occupations
90,705Management occupations
87,492Computer and mathematical occupations
86,708Legal occupations
86,239Health diagnosing and treating practitioners and other technical occupations
77,034Law enforcement workers including supervisors
Companies with biggest federal contracts located in this zip code (SALEM, MA):
THE BIOENGINEERING GROUP, INC (18 COMMERCIAL STREET) : $5,114,838 in 94 contractsfrom 2001 to 2006
Contracts for Architect - Engineer Services (including landscaping, interior layout, and designing), Construction of Structures and Facilities -- Other Conservation and Development Facilities, Other Environmental Services, Studies, and Analytical Support, Environmental Studies and Assessments, and moreby U.S. Army Corps of Engineers - civil program financing only, Army, Federal Emergency Management Agency Signed by year:2000: $0; 2001: $867,020; 2002: $926,121; 2003: $2,502,412; 2004: $592,891; 2005: $126,408; 2006: $99,986.
Biggest contracts:
$427,175 with U.S. Army Corps of Engineers - civil program financing only for Architect - Engineer Services (including landscaping, interior layout, and designing). Taking place in ME. Signed on 2003-05-08. Completion date: 2003-12-01.
$376,361, same as above.Signed on 2003-06-11. Completion date: 2004-01-10.
$347,848 with U.S. Army Corps of Engineers - civil program financing only for Construction of Structures and Facilities -- Other Conservation and Development Facilities. Taking place in MD. Signed on 2003-04-14. Completion date: 2003-03-26.
$337,994 with Army for Other Environmental Services, Studies, and Analytical Support. Taking place in CA. Signed on 2003-08-15. Completion date: 2003-09-30.
RICHARD MILBURN HIGH SCHOOL (27 CONGRESS ST STE 205; small business) : $920,765 in 48 contractsfrom 1999 to 2005
Contracts for Education Services, Operation of Government-Owned Facilities -- Schools, Other Education and Training Services, Gas Services, and moreby Army, Department of Defense Education Activity, Navy Signed by year:2000: $24,480; 2001: $121,039; 2002: $187,738; 2003: $102,574; 2004: $113,050; 2005: $62,297; 2006: $0.
Biggest contracts:
$211,932 with Army for Education Services. Taking place in KY. Signed on 1999-10-27. Completion date: 2003-10-31.
$178,354, same as above.Signed on 2002-04-24. Completion date: 2003-10-31.
$105,000 with Department of Defense Education Activity for Operation of Government-Owned Facilities -- Schools. Taking place in VA. Signed on 2004-05-06. Completion date: 2004-05-13.
$97,655 with Army for Education Services. Taking place in KY. Signed on 1999-10-29. Completion date: 2003-10-31.
WEIR VALVES AND CONTROLS USA I (285 CANAL ST) : $315,737 in 5 contractsfrom 1999 to 2005
Contracts for Coils and Transformers, Modification of Equipment -- Valves, Relays and Solenoids, Administrative and Service Buildings, and moreby Tennessee Valley Authority, Public Buildings Service, Navy Signed by year:2000: $151,000; 2001: $0; 2002: $0; 2003: $0; 2004: $28,422; 2005: $315; 2006: $0.
Biggest contracts:
$136,000 with Tennessee Valley Authority for Coils and Transformers. Signed on 1999-10-15. Completion date: 1999-12-15.
$80,000 with Tennessee Valley Authority for Modification of Equipment -- Valves. Signed on 2000-09-15. Completion date: 2000-11-15.
$71,000 with Tennessee Valley Authority for Relays and Solenoids. Signed on 2000-06-15. Completion date: 2000-09-15.
$28,422 with Public Buildings Service for Administrative and Service Buildings. Taking place in IN. Signed on 2004-03-08. Completion date: 2004-05-31.
INSTANT SIGNAL & ALARM CO , IN (303 HIGHLAND AVENUE; small business)
$82,720 with Air Force for Fire Control Maintenance and Repair Shop Specialized Equipment. Signed on 2001-03-27. Completion date: 2001-03-29.
AMERICAN UNITED MARINE CORP (35 CONGRESS ST STE 214; small business) 50 employees, $0 revenue. : $35,777 in 4 contractsfrom 2000 to 2004
$30,000 with Maritime Administration for Non-nuclear Ship Repair (East) Ship repair (including overhauls and conversions) performed on non-nuclear propelled and nonpropelled ships east of the 108th meridian. Signed on 2000-04-15. Completion date: 2000-09-15.
$3,477 with Navy for Non-nuclear Ship Repair (East) Ship repair (including overhauls and conversions) performed on non-nuclear propelled and nonpropelled ships east of the 108th meridian. Taking place in VA. Signed on 2004-09-30. Completion date: 2004-09-29.
$2,000 with Maritime Administration for Non-nuclear Ship Repair (East) Ship repair (including overhauls and conversions) performed on non-nuclear propelled and nonpropelled ships east of the 108th meridian. Signed on 2000-09-15. Completion date: 2000-09-15.
$300 with Navy for Non-nuclear Ship Repair (East) Ship repair (including overhauls and conversions) performed on non-nuclear propelled and nonpropelled ships east of the 108th meridian. Taking place in VA. Signed on 2004-11-01. Completion date: 2004-09-29.
HENDRICK MANUFACTURING CORP (32 COMMERCIAL ST; small business) : $27,500 in 3 contractsfrom 2004 to 2005
$23,000 with Army for Saws and Filing Machines. Signed on 2004-04-05. Completion date: 2004-05-28.
$3,500 with Navy for Other ADP and Telecommunications Services (includes data storage on tapes, compact disks, etc.). Signed on 2005-07-11. Completion date: 2006-06-30.
$1,000, same as above.Signed on 2005-09-20. Completion date: 2005-09-30.
NELSON & JACOB CO , INC (18 BUFFUM ST; small business)
$23,900 with Navy for Maintenance, Repair and Rebuilding of Equipment -- Metalworking Machinery. Taking place in ME. Signed on 2004-09-02. Completion date: 2004-09-24.
MCCUE CORPORATION (35 CONGRESS STREET; small business) : $15,200 in 2 contractsin 2005
$7,600 with Defense Commissary Agency for Miscellaneous Household and Commercial Furnishings and Appliances. Signed on 2005-11-15. Completion date: 2005-12-16.
$7,600, same as above.Signed on 2005-11-29. Completion date: 2006-01-09.
DAEDALON CORPORATION (35 CONGRESS STREET) : $9,617 in 2 contractsfrom 2004 to 2005
$4,997 with Navy for Physical Properties Testing and Inspection. Taking place in MD. Signed on 2005-07-06. Completion date: 2005-07-21.
$4,620 with Navy for Time Measuring Instruments. Signed on 2004-09-30. Completion date: 2004-12-31.
AAPEX INTERNATIONAL INC (27 CONGRESS ST; small business)
$7,150 with Defense Logistics Agency for Semiconductor Devices and Associated Hardware. Signed on 2005-08-09. Completion date: 2005-08-29.
Top industries in this zip code by the number of employees in 2005:
Health Care and Social Assistance: General Medical and Surgical Hospitals (over 1000 employees: 1 establishment)
Health Care and Social Assistance: Offices of Physicians (except Mental Health Specialists) (250-499: 1, 50-99: 1, 20-49: 6, 10-19: 9, 5-9: 7, 1-4: 17)
2002 - 2018 National Fire Incident Reporting System (NFIRS) incidents
According to the data from the years 2002 - 2018 the average number of fires per year is 257. The highest number of reported fires - 571 took place in 2002, and the least - 130 in 2011. The data has a decreasing trend.
When looking into fire subcategories, the most incidents belonged to: Structure Fires (55.7%), and Outside Fires (36.8%).
Fire incident types reported to NFIRS in Zip Code 01970


 Nearest zip codes: 01945, 01915, 01907, 01984, 01902, 01923.


 According to the data from the years 2002 - 2018 the average number of fires per year is 257. The highest number of reported fires - 571 took place in 2002, and the least - 130 in 2011. The data has a decreasing trend.
 When looking into fire subcategories, the most incidents belonged to: Structure Fires (55.7%), and Outside Fires (36.8%).