Estimated zip code population in 2022: 51,914
Zip code population in 2010: 45,139
Zip code population in 2000: 47,601
Houses and condos: 19,715
Renter-occupied apartments: 11,808
% of renters here:
61%State:
38%
March 2022 cost of living index in zip code 01902: 136.7
(high, U.S. average is 100)
Land area: 2.4
sq. mi.
Water area: 0.1
sq. mi.
Population density: 21,603 people per square mile (very high).
OSM Map
Google Map
MSN Map
OSM Map
General Map
Google Map
MSN Map
OSM Map
Google Map
MSN Map
OSM Map
Google Map
MSN Map
Please wait while loading the map...
Real estate property taxes paid for housing units in 2022:
This zip code:
1.0% ($4,449)Massachusetts:
1.0% ($5,536)
Median real estate property taxes paid for housing units with mortgages in 2022: $4,448 (0.9%)
Median real estate property taxes paid for housing units with no mortgage in 2022: $4,451 (1.0%)
Profiles of local businesses
Business Search - 14 Million verified businesses
Males: 25,280 Females: 26,634
For population 25 years and over in 01902:
High school or higher: 73.1%Bachelor's degree or higher: 19.6%Graduate or professional degree: 6.6%Unemployed: 5.7%Mean travel time to work (commute): 30.8 minutes
For population 15 years and over in 01902:
Never married: 42.2%Now married: 39.5%Separated: 4.3%Widowed: 4.2%Divorced: 9.9%
Zip code 01902 compared to state average:
Median household income below state average. Black race population percentage above state average. Hispanic race population percentage significantly above state average. Median age below state average. Foreign-born population percentage significantly above state average. Renting percentage above state average. Length of stay since moving in below state average. Percentage of population with a bachelor's degree or higher significantly below state average. 26,138 50.4% Hispanic or Latino 13,905 26.8% White 6,237 12.0% Black 2,620 5.0% Asian 2,526 4.9% Two or more races 471 0.9% Some other race 14 0.03% American Indian
Data:
Median household income ($)
Median household income (% change since 2000)
Household income diversity
Ratio of average income to average house value (%)
Ratio of average income to average rent
Median household income ($) - White
Median household income ($) - Black or African American
Median household income ($) - Asian
Median household income ($) - Hispanic or Latino
Median household income ($) - American Indian and Alaska Native
Median household income ($) - Multirace
Median household income ($) - Other Race
Median household income for houses/condos with a mortgage ($)
Median household income for apartments without a mortgage ($)
Races - White alone (%)
Races - White alone (% change since 2000)
Races - Black alone (%)
Races - Black alone (% change since 2000)
Races - American Indian alone (%)
Races - American Indian alone (% change since 2000)
Races - Asian alone (%)
Races - Asian alone (% change since 2000)
Races - Hispanic (%)
Races - Hispanic (% change since 2000)
Races - Native Hawaiian and Other Pacific Islander alone (%)
Races - Native Hawaiian and Other Pacific Islander alone (% change since 2000)
Races - Two or more races (%)
Races - Two or more races (% change since 2000)
Races - Other race alone (%)
Races - Other race alone (% change since 2000)
Racial diversity
Unemployment (%)
Unemployment (% change since 2000)
Unemployment (%) - White
Unemployment (%) - Black or African American
Unemployment (%) - Asian
Unemployment (%) - Hispanic or Latino
Unemployment (%) - American Indian and Alaska Native
Unemployment (%) - Multirace
Unemployment (%) - Other Race
Population density (people per square mile)
Population - Males (%)
Population - Females (%)
Population - Males (%) - White
Population - Males (%) - Black or African American
Population - Males (%) - Asian
Population - Males (%) - Hispanic or Latino
Population - Males (%) - American Indian and Alaska Native
Population - Males (%) - Multirace
Population - Males (%) - Other Race
Population - Females (%) - White
Population - Females (%) - Black or African American
Population - Females (%) - Asian
Population - Females (%) - Hispanic or Latino
Population - Females (%) - American Indian and Alaska Native
Population - Females (%) - Multirace
Population - Females (%) - Other Race
Coronavirus confirmed cases (Apr 27, 2024)
Deaths caused by coronavirus (Apr 27, 2024)
Coronavirus confirmed cases (per 100k population) (Apr 27, 2024)
Deaths caused by coronavirus (per 100k population) (Apr 27, 2024)
Daily increase in number of cases (Apr 27, 2024)
Weekly increase in number of cases (Apr 27, 2024)
Cases doubled (in days) (Apr 27, 2024)
Hospitalized patients (Apr 18, 2022)
Negative test results (Apr 18, 2022)
Total test results (Apr 18, 2022)
COVID Vaccine doses distributed (per 100k population) (Sep 19, 2023)
COVID Vaccine doses administered (per 100k population) (Sep 19, 2023)
COVID Vaccine doses distributed (Sep 19, 2023)
COVID Vaccine doses administered (Sep 19, 2023)
Likely homosexual households (%)
Likely homosexual households (% change since 2000)
Likely homosexual households - Lesbian couples (%)
Likely homosexual households - Lesbian couples (% change since 2000)
Likely homosexual households - Gay men (%)
Likely homosexual households - Gay men (% change since 2000)
Cost of living index
Median gross rent ($)
Median contract rent ($)
Median monthly housing costs ($)
Median house or condo value ($)
Median house or condo value ($ change since 2000)
Mean house or condo value by units in structure - 1, detached ($)
Mean house or condo value by units in structure - 1, attached ($)
Mean house or condo value by units in structure - 2 ($)
Mean house or condo value by units in structure by units in structure - 3 or 4 ($)
Mean house or condo value by units in structure - 5 or more ($)
Mean house or condo value by units in structure - Boat, RV, van, etc. ($)
Mean house or condo value by units in structure - Mobile home ($)
Median house or condo value ($) - White
Median house or condo value ($) - Black or African American
Median house or condo value ($) - Asian
Median house or condo value ($) - Hispanic or Latino
Median house or condo value ($) - American Indian and Alaska Native
Median house or condo value ($) - Multirace
Median house or condo value ($) - Other Race
Median resident age
Resident age diversity
Median resident age - Males
Median resident age - Females
Median resident age - White
Median resident age - Black or African American
Median resident age - Asian
Median resident age - Hispanic or Latino
Median resident age - American Indian and Alaska Native
Median resident age - Multirace
Median resident age - Other Race
Median resident age - Males - White
Median resident age - Males - Black or African American
Median resident age - Males - Asian
Median resident age - Males - Hispanic or Latino
Median resident age - Males - American Indian and Alaska Native
Median resident age - Males - Multirace
Median resident age - Males - Other Race
Median resident age - Females - White
Median resident age - Females - Black or African American
Median resident age - Females - Asian
Median resident age - Females - Hispanic or Latino
Median resident age - Females - American Indian and Alaska Native
Median resident age - Females - Multirace
Median resident age - Females - Other Race
Commute - mean travel time to work (minutes)
Travel time to work - Less than 5 minutes (%)
Travel time to work - Less than 5 minutes (% change since 2000)
Travel time to work - 5 to 9 minutes (%)
Travel time to work - 5 to 9 minutes (% change since 2000)
Travel time to work - 10 to 19 minutes (%)
Travel time to work - 10 to 19 minutes (% change since 2000)
Travel time to work - 20 to 29 minutes (%)
Travel time to work - 20 to 29 minutes (% change since 2000)
Travel time to work - 30 to 39 minutes (%)
Travel time to work - 30 to 39 minutes (% change since 2000)
Travel time to work - 40 to 59 minutes (%)
Travel time to work - 40 to 59 minutes (% change since 2000)
Travel time to work - 60 to 89 minutes (%)
Travel time to work - 60 to 89 minutes (% change since 2000)
Travel time to work - 90 or more minutes (%)
Travel time to work - 90 or more minutes (% change since 2000)
Marital status - Never married (%)
Marital status - Now married (%)
Marital status - Separated (%)
Marital status - Widowed (%)
Marital status - Divorced (%)
Median family income ($)
Median family income (% change since 2000)
Median non-family income ($)
Median non-family income (% change since 2000)
Median per capita income ($)
Median per capita income (% change since 2000)
Median family income ($) - White
Median family income ($) - Black or African American
Median family income ($) - Asian
Median family income ($) - Hispanic or Latino
Median family income ($) - American Indian and Alaska Native
Median family income ($) - Multirace
Median family income ($) - Other Race
Median year house/condo built
Median year apartment built
Year house built - Built 2005 or later (%)
Year house built - Built 2000 to 2004 (%)
Year house built - Built 1990 to 1999 (%)
Year house built - Built 1980 to 1989 (%)
Year house built - Built 1970 to 1979 (%)
Year house built - Built 1960 to 1969 (%)
Year house built - Built 1950 to 1959 (%)
Year house built - Built 1940 to 1949 (%)
Year house built - Built 1939 or earlier (%)
Average household size
Household density (households per square mile)
Average household size - White
Average household size - Black or African American
Average household size - Asian
Average household size - Hispanic or Latino
Average household size - American Indian and Alaska Native
Average household size - Multirace
Average household size - Other Race
Occupied housing units (%)
Vacant housing units (%)
Owner occupied housing units (%)
Renter occupied housing units (%)
Vacancy status - For rent (%)
Vacancy status - For sale only (%)
Vacancy status - Rented or sold, not occupied (%)
Vacancy status - For seasonal, recreational, or occasional use (%)
Vacancy status - For migrant workers (%)
Vacancy status - Other vacant (%)
Residents with income below the poverty level (%)
Residents with income below 50% of the poverty level (%)
Children below poverty level (%)
Poor families by family type - Married-couple family (%)
Poor families by family type - Male, no wife present (%)
Poor families by family type - Female, no husband present (%)
Poverty status for native-born residents (%)
Poverty status for foreign-born residents (%)
Poverty among high school graduates not in families (%)
Poverty among people who did not graduate high school not in families (%)
Residents with income below the poverty level (%) - White
Residents with income below the poverty level (%) - Black or African American
Residents with income below the poverty level (%) - Asian
Residents with income below the poverty level (%) - Hispanic or Latino
Residents with income below the poverty level (%) - American Indian and Alaska Native
Residents with income below the poverty level (%) - Multirace
Residents with income below the poverty level (%) - Other Race
Air pollution - Air Quality Index (AQI)
Air pollution - CO
Air pollution - NO2
Air pollution - SO2
Air pollution - Ozone
Air pollution - PM10
Air pollution - PM25
Air pollution - Pb
Crime - Murders per 100,000 population
Crime - Rapes per 100,000 population
Crime - Robberies per 100,000 population
Crime - Assaults per 100,000 population
Crime - Burglaries per 100,000 population
Crime - Thefts per 100,000 population
Crime - Auto thefts per 100,000 population
Crime - Arson per 100,000 population
Crime - City-data.com crime index
Crime - Violent crime index
Crime - Property crime index
Crime - Murders per 100,000 population (5 year average)
Crime - Rapes per 100,000 population (5 year average)
Crime - Robberies per 100,000 population (5 year average)
Crime - Assaults per 100,000 population (5 year average)
Crime - Burglaries per 100,000 population (5 year average)
Crime - Thefts per 100,000 population (5 year average)
Crime - Auto thefts per 100,000 population (5 year average)
Crime - Arson per 100,000 population (5 year average)
Crime - City-data.com crime index (5 year average)
Crime - Violent crime index (5 year average)
Crime - Property crime index (5 year average)
1996 Presidential Elections Results (%) - Democratic Party (Clinton)
1996 Presidential Elections Results (%) - Republican Party (Dole)
1996 Presidential Elections Results (%) - Other
2000 Presidential Elections Results (%) - Democratic Party (Gore)
2000 Presidential Elections Results (%) - Republican Party (Bush)
2000 Presidential Elections Results (%) - Other
2004 Presidential Elections Results (%) - Democratic Party (Kerry)
2004 Presidential Elections Results (%) - Republican Party (Bush)
2004 Presidential Elections Results (%) - Other
2008 Presidential Elections Results (%) - Democratic Party (Obama)
2008 Presidential Elections Results (%) - Republican Party (McCain)
2008 Presidential Elections Results (%) - Other
2012 Presidential Elections Results (%) - Democratic Party (Obama)
2012 Presidential Elections Results (%) - Republican Party (Romney)
2012 Presidential Elections Results (%) - Other
2016 Presidential Elections Results (%) - Democratic Party (Clinton)
2016 Presidential Elections Results (%) - Republican Party (Trump)
2016 Presidential Elections Results (%) - Other
2020 Presidential Elections Results (%) - Democratic Party (Biden)
2020 Presidential Elections Results (%) - Republican Party (Trump)
2020 Presidential Elections Results (%) - Other
Ancestries Reported - Arab (%)
Ancestries Reported - Czech (%)
Ancestries Reported - Danish (%)
Ancestries Reported - Dutch (%)
Ancestries Reported - English (%)
Ancestries Reported - French (%)
Ancestries Reported - French Canadian (%)
Ancestries Reported - German (%)
Ancestries Reported - Greek (%)
Ancestries Reported - Hungarian (%)
Ancestries Reported - Irish (%)
Ancestries Reported - Italian (%)
Ancestries Reported - Lithuanian (%)
Ancestries Reported - Norwegian (%)
Ancestries Reported - Polish (%)
Ancestries Reported - Portuguese (%)
Ancestries Reported - Russian (%)
Ancestries Reported - Scotch-Irish (%)
Ancestries Reported - Scottish (%)
Ancestries Reported - Slovak (%)
Ancestries Reported - Subsaharan African (%)
Ancestries Reported - Swedish (%)
Ancestries Reported - Swiss (%)
Ancestries Reported - Ukrainian (%)
Ancestries Reported - United States (%)
Ancestries Reported - Welsh (%)
Ancestries Reported - West Indian (%)
Ancestries Reported - Other (%)
Educational Attainment - No schooling completed (%)
Educational Attainment - Less than high school (%)
Educational Attainment - High school or equivalent (%)
Educational Attainment - Less than 1 year of college (%)
Educational Attainment - 1 or more years of college (%)
Educational Attainment - Associate degree (%)
Educational Attainment - Bachelor's degree (%)
Educational Attainment - Master's degree (%)
Educational Attainment - Professional school degree (%)
Educational Attainment - Doctorate degree (%)
School Enrollment - Nursery, preschool (%)
School Enrollment - Kindergarten (%)
School Enrollment - Grade 1 to 4 (%)
School Enrollment - Grade 5 to 8 (%)
School Enrollment - Grade 9 to 12 (%)
School Enrollment - College undergrad (%)
School Enrollment - Graduate or professional (%)
School Enrollment - Not enrolled in school (%)
School enrollment - Public schools (%)
School enrollment - Private schools (%)
School enrollment - Not enrolled (%)
Median number of rooms in houses and condos
Median number of rooms in apartments
Housing units lacking complete plumbing facilities (%)
Housing units lacking complete kitchen facilities (%)
Density of houses
Urban houses (%)
Rural houses (%)
Households with people 60 years and over (%)
Households with people 65 years and over (%)
Households with people 75 years and over (%)
Households with one or more nonrelatives (%)
Households with no nonrelatives (%)
Population in households (%)
Family households (%)
Nonfamily households (%)
Population in families (%)
Family households with own children (%)
Median number of bedrooms in owner occupied houses
Mean number of bedrooms in owner occupied houses
Median number of bedrooms in renter occupied houses
Mean number of bedrooms in renter occupied houses
Median number of vehichles in owner occupied houses
Mean number of vehichles in owner occupied houses
Median number of vehichles in renter occupied houses
Mean number of vehichles in renter occupied houses
Mortgage status - with mortgage (%)
Mortgage status - with second mortgage (%)
Mortgage status - with home equity loan (%)
Mortgage status - with both second mortgage and home equity loan (%)
Mortgage status - without a mortgage (%)
Average family size
Average family size - White
Average family size - Black or African American
Average family size - Asian
Average family size - Hispanic or Latino
Average family size - American Indian and Alaska Native
Average family size - Multirace
Average family size - Other Race
Geographical mobility - Same house 1 year ago (%)
Geographical mobility - Moved within same county (%)
Geographical mobility - Moved from different county within same state (%)
Geographical mobility - Moved from different state (%)
Geographical mobility - Moved from abroad (%)
Place of birth - Born in state of residence (%)
Place of birth - Born in other state (%)
Place of birth - Native, outside of US (%)
Place of birth - Foreign born (%)
Housing units in structures - 1, detached (%)
Housing units in structures - 1, attached (%)
Housing units in structures - 2 (%)
Housing units in structures - 3 or 4 (%)
Housing units in structures - 5 to 9 (%)
Housing units in structures - 10 to 19 (%)
Housing units in structures - 20 to 49 (%)
Housing units in structures - 50 or more (%)
Housing units in structures - Mobile home (%)
Housing units in structures - Boat, RV, van, etc. (%)
House/condo owner moved in on average (years ago)
Renter moved in on average (years ago)
Year householder moved into unit - Moved in 1999 to March 2000 (%)
Year householder moved into unit - Moved in 1995 to 1998 (%)
Year householder moved into unit - Moved in 1990 to 1994 (%)
Year householder moved into unit - Moved in 1980 to 1989 (%)
Year householder moved into unit - Moved in 1970 to 1979 (%)
Year householder moved into unit - Moved in 1969 or earlier (%)
Means of transportation to work - Drove car alone (%)
Means of transportation to work - Carpooled (%)
Means of transportation to work - Public transportation (%)
Means of transportation to work - Bus or trolley bus (%)
Means of transportation to work - Streetcar or trolley car (%)
Means of transportation to work - Subway or elevated (%)
Means of transportation to work - Railroad (%)
Means of transportation to work - Ferryboat (%)
Means of transportation to work - Taxicab (%)
Means of transportation to work - Motorcycle (%)
Means of transportation to work - Bicycle (%)
Means of transportation to work - Walked (%)
Means of transportation to work - Other means (%)
Working at home (%)
Industry diversity
Most Common Industries - Agriculture, forestry, fishing and hunting, and mining (%)
Most Common Industries - Agriculture, forestry, fishing and hunting (%)
Most Common Industries - Mining, quarrying, and oil and gas extraction (%)
Most Common Industries - Construction (%)
Most Common Industries - Manufacturing (%)
Most Common Industries - Wholesale trade (%)
Most Common Industries - Retail trade (%)
Most Common Industries - Transportation and warehousing, and utilities (%)
Most Common Industries - Transportation and warehousing (%)
Most Common Industries - Utilities (%)
Most Common Industries - Information (%)
Most Common Industries - Finance and insurance, and real estate and rental and leasing (%)
Most Common Industries - Finance and insurance (%)
Most Common Industries - Real estate and rental and leasing (%)
Most Common Industries - Professional, scientific, and management, and administrative and waste management services (%)
Most Common Industries - Professional, scientific, and technical services (%)
Most Common Industries - Management of companies and enterprises (%)
Most Common Industries - Administrative and support and waste management services (%)
Most Common Industries - Educational services, and health care and social assistance (%)
Most Common Industries - Educational services (%)
Most Common Industries - Health care and social assistance (%)
Most Common Industries - Arts, entertainment, and recreation, and accommodation and food services (%)
Most Common Industries - Arts, entertainment, and recreation (%)
Most Common Industries - Accommodation and food services (%)
Most Common Industries - Other services, except public administration (%)
Most Common Industries - Public administration (%)
Occupation diversity
Most Common Occupations - Management, business, science, and arts occupations (%)
Most Common Occupations - Management, business, and financial occupations (%)
Most Common Occupations - Management occupations (%)
Most Common Occupations - Business and financial operations occupations (%)
Most Common Occupations - Computer, engineering, and science occupations (%)
Most Common Occupations - Computer and mathematical occupations (%)
Most Common Occupations - Architecture and engineering occupations (%)
Most Common Occupations - Life, physical, and social science occupations (%)
Most Common Occupations - Education, legal, community service, arts, and media occupations (%)
Most Common Occupations - Community and social service occupations (%)
Most Common Occupations - Legal occupations (%)
Most Common Occupations - Education, training, and library occupations (%)
Most Common Occupations - Arts, design, entertainment, sports, and media occupations (%)
Most Common Occupations - Healthcare practitioners and technical occupations (%)
Most Common Occupations - Health diagnosing and treating practitioners and other technical occupations (%)
Most Common Occupations - Health technologists and technicians (%)
Most Common Occupations - Service occupations (%)
Most Common Occupations - Healthcare support occupations (%)
Most Common Occupations - Protective service occupations (%)
Most Common Occupations - Fire fighting and prevention, and other protective service workers including supervisors (%)
Most Common Occupations - Law enforcement workers including supervisors (%)
Most Common Occupations - Food preparation and serving related occupations (%)
Most Common Occupations - Building and grounds cleaning and maintenance occupations (%)
Most Common Occupations - Personal care and service occupations (%)
Most Common Occupations - Sales and office occupations (%)
Most Common Occupations - Sales and related occupations (%)
Most Common Occupations - Office and administrative support occupations (%)
Most Common Occupations - Natural resources, construction, and maintenance occupations (%)
Most Common Occupations - Farming, fishing, and forestry occupations (%)
Most Common Occupations - Construction and extraction occupations (%)
Most Common Occupations - Installation, maintenance, and repair occupations (%)
Most Common Occupations - Production, transportation, and material moving occupations (%)
Most Common Occupations - Production occupations (%)
Most Common Occupations - Transportation occupations (%)
Most Common Occupations - Material moving occupations (%)
People in Group quarters - Institutionalized population (%)
People in Group quarters - Correctional institutions (%)
People in Group quarters - Federal prisons and detention centers (%)
People in Group quarters - Halfway houses (%)
People in Group quarters - Local jails and other confinement facilities (including police lockups) (%)
People in Group quarters - Military disciplinary barracks (%)
People in Group quarters - State prisons (%)
People in Group quarters - Other types of correctional institutions (%)
People in Group quarters - Nursing homes (%)
People in Group quarters - Hospitals/wards, hospices, and schools for the handicapped (%)
People in Group quarters - Hospitals/wards and hospices for chronically ill (%)
People in Group quarters - Hospices or homes for chronically ill (%)
People in Group quarters - Military hospitals or wards for chronically ill (%)
People in Group quarters - Other hospitals or wards for chronically ill (%)
People in Group quarters - Hospitals or wards for drug/alcohol abuse (%)
People in Group quarters - Mental (Psychiatric) hospitals or wards (%)
People in Group quarters - Schools, hospitals, or wards for the mentally retarded (%)
People in Group quarters - Schools, hospitals, or wards for the physically handicapped (%)
People in Group quarters - Institutions for the deaf (%)
People in Group quarters - Institutions for the blind (%)
People in Group quarters - Orthopedic wards and institutions for the physically handicapped (%)
People in Group quarters - Wards in general hospitals for patients who have no usual home elsewhere (%)
People in Group quarters - Wards in military hospitals for patients who have no usual home elsewhere (%)
People in Group quarters - Juvenile institutions (%)
People in Group quarters - Long-term care (%)
People in Group quarters - Homes for abused, dependent, and neglected children (%)
People in Group quarters - Residential treatment centers for emotionally disturbed children (%)
People in Group quarters - Training schools for juvenile delinquents (%)
People in Group quarters - Short-term care, detention or diagnostic centers for delinquent children (%)
People in Group quarters - Type of juvenile institution unknown (%)
People in Group quarters - Noninstitutionalized population (%)
People in Group quarters - College dormitories (includes college quarters off campus) (%)
People in Group quarters - Military quarters (%)
People in Group quarters - On base (%)
People in Group quarters - Barracks, unaccompanied personnel housing (UPH), (Enlisted/Officer), ;and similar group living quarters for military personnel (%)
People in Group quarters - Transient quarters for temporary residents (%)
People in Group quarters - Military ships (%)
People in Group quarters - Group homes (%)
People in Group quarters - Homes or halfway houses for drug/alcohol abuse (%)
People in Group quarters - Homes for the mentally ill (%)
People in Group quarters - Homes for the mentally retarded (%)
People in Group quarters - Homes for the physically handicapped (%)
People in Group quarters - Other group homes (%)
People in Group quarters - Religious group quarters (%)
People in Group quarters - Dormitories (%)
People in Group quarters - Agriculture workers' dormitories on farms (%)
People in Group quarters - Job Corps and vocational training facilities (%)
People in Group quarters - Other workers' dormitories (%)
People in Group quarters - Crews of maritime vessels (%)
People in Group quarters - Other nonhousehold living situations (%)
People in Group quarters - Other noninstitutional group quarters (%)
Residents speaking English at home (%)
Residents speaking English at home - Born in the United States (%)
Residents speaking English at home - Native, born elsewhere (%)
Residents speaking English at home - Foreign born (%)
Residents speaking Spanish at home (%)
Residents speaking Spanish at home - Born in the United States (%)
Residents speaking Spanish at home - Native, born elsewhere (%)
Residents speaking Spanish at home - Foreign born (%)
Residents speaking other language at home (%)
Residents speaking other language at home - Born in the United States (%)
Residents speaking other language at home - Native, born elsewhere (%)
Residents speaking other language at home - Foreign born (%)
Class of Workers - Employee of private company (%)
Class of Workers - Self-employed in own incorporated business (%)
Class of Workers - Private not-for-profit wage and salary workers (%)
Class of Workers - Local government workers (%)
Class of Workers - State government workers (%)
Class of Workers - Federal government workers (%)
Class of Workers - Self-employed workers in own not incorporated business and Unpaid family workers (%)
House heating fuel used in houses and condos - Utility gas (%)
House heating fuel used in houses and condos - Bottled, tank, or LP gas (%)
House heating fuel used in houses and condos - Electricity (%)
House heating fuel used in houses and condos - Fuel oil, kerosene, etc. (%)
House heating fuel used in houses and condos - Coal or coke (%)
House heating fuel used in houses and condos - Wood (%)
House heating fuel used in houses and condos - Solar energy (%)
House heating fuel used in houses and condos - Other fuel (%)
House heating fuel used in houses and condos - No fuel used (%)
House heating fuel used in apartments - Utility gas (%)
House heating fuel used in apartments - Bottled, tank, or LP gas (%)
House heating fuel used in apartments - Electricity (%)
House heating fuel used in apartments - Fuel oil, kerosene, etc. (%)
House heating fuel used in apartments - Coal or coke (%)
House heating fuel used in apartments - Wood (%)
House heating fuel used in apartments - Solar energy (%)
House heating fuel used in apartments - Other fuel (%)
House heating fuel used in apartments - No fuel used (%)
Armed forces status - In Armed Forces (%)
Armed forces status - Civilian (%)
Armed forces status - Civilian - Veteran (%)
Armed forces status - Civilian - Nonveteran (%)
Fatal accidents locations in years 2005-2021
Fatal accidents locations in 2005
Fatal accidents locations in 2006
Fatal accidents locations in 2007
Fatal accidents locations in 2008
Fatal accidents locations in 2009
Fatal accidents locations in 2010
Fatal accidents locations in 2011
Fatal accidents locations in 2012
Fatal accidents locations in 2013
Fatal accidents locations in 2014
Fatal accidents locations in 2015
Fatal accidents locations in 2016
Fatal accidents locations in 2017
Fatal accidents locations in 2018
Fatal accidents locations in 2019
Fatal accidents locations in 2020
Fatal accidents locations in 2021
Alcohol use - People drinking some alcohol every month (%)
Alcohol use - People not drinking at all (%)
Alcohol use - Average days/month drinking alcohol
Alcohol use - Average drinks/week
Alcohol use - Average days/year people drink much
Audiometry - Average condition of hearing (%)
Audiometry - People that can hear a whisper from across a quiet room (%)
Audiometry - People that can hear normal voice from across a quiet room (%)
Audiometry - Ears ringing, roaring, buzzing (%)
Audiometry - Had a job exposure to loud noise (%)
Audiometry - Had off-work exposure to loud noise (%)
Blood Pressure & Cholesterol - Has high blood pressure (%)
Blood Pressure & Cholesterol - Checking blood pressure at home (%)
Blood Pressure & Cholesterol - Frequently checking blood cholesterol (%)
Blood Pressure & Cholesterol - Has high cholesterol level (%)
Consumer Behavior - Money monthly spent on food at supermarket/grocery store
Consumer Behavior - Money monthly spent on food at other stores
Consumer Behavior - Money monthly spent on eating out
Consumer Behavior - Money monthly spent on carryout/delivered foods
Consumer Behavior - Income spent on food at supermarket/grocery store (%)
Consumer Behavior - Income spent on food at other stores (%)
Consumer Behavior - Income spent on eating out (%)
Consumer Behavior - Income spent on carryout/delivered foods (%)
Current Health Status - General health condition (%)
Current Health Status - Blood donors (%)
Current Health Status - Has blood ever tested for HIV virus (%)
Current Health Status - Left-handed people (%)
Dermatology - People using sunscreen (%)
Diabetes - Diabetics (%)
Diabetes - Had a blood test for high blood sugar (%)
Diabetes - People taking insulin (%)
Diet Behavior & Nutrition - Diet health (%)
Diet Behavior & Nutrition - Milk product consumption (# of products/month)
Diet Behavior & Nutrition - Meals not home prepared (#/week)
Diet Behavior & Nutrition - Meals from fast food or pizza place (#/week)
Diet Behavior & Nutrition - Ready-to-eat foods (#/month)
Diet Behavior & Nutrition - Frozen meals/pizza (#/month)
Drug Use - People that ever used marijuana or hashish (%)
Drug Use - Ever used hard drugs (%)
Drug Use - Ever used any form of cocaine (%)
Drug Use - Ever used heroin (%)
Drug Use - Ever used methamphetamine (%)
Health Insurance - People covered by health insurance (%)
Kidney Conditions-Urology - Avg. # of times urinating at night
Medical Conditions - People with asthma (%)
Medical Conditions - People with anemia (%)
Medical Conditions - People with psoriasis (%)
Medical Conditions - People with overweight (%)
Medical Conditions - Elderly people having difficulties in thinking or remembering (%)
Medical Conditions - People who ever received blood transfusion (%)
Medical Conditions - People having trouble seeing even with glass/contacts (%)
Medical Conditions - People with arthritis (%)
Medical Conditions - People with gout (%)
Medical Conditions - People with congestive heart failure (%)
Medical Conditions - People with coronary heart disease (%)
Medical Conditions - People with angina pectoris (%)
Medical Conditions - People who ever had heart attack (%)
Medical Conditions - People who ever had stroke (%)
Medical Conditions - People with emphysema (%)
Medical Conditions - People with thyroid problem (%)
Medical Conditions - People with chronic bronchitis (%)
Medical Conditions - People with any liver condition (%)
Medical Conditions - People who ever had cancer or malignancy (%)
Mental Health - People who have little interest in doing things (%)
Mental Health - People feeling down, depressed, or hopeless (%)
Mental Health - People who have trouble sleeping or sleeping too much (%)
Mental Health - People feeling tired or having little energy (%)
Mental Health - People with poor appetite or overeating (%)
Mental Health - People feeling bad about themself (%)
Mental Health - People who have trouble concentrating on things (%)
Mental Health - People moving or speaking slowly or too fast (%)
Mental Health - People having thoughts they would be better off dead (%)
Oral Health - Average years since last visit a dentist
Oral Health - People embarrassed because of mouth (%)
Oral Health - People with gum disease (%)
Oral Health - General health of teeth and gums (%)
Oral Health - Average days a week using dental floss/device
Oral Health - Average days a week using mouthwash for dental problem
Oral Health - Average number of teeth
Pesticide Use - Households using pesticides to control insects (%)
Pesticide Use - Households using pesticides to kill weeds (%)
Physical Activity - People doing vigorous-intensity work activities (%)
Physical Activity - People doing moderate-intensity work activities (%)
Physical Activity - People walking or bicycling (%)
Physical Activity - People doing vigorous-intensity recreational activities (%)
Physical Activity - People doing moderate-intensity recreational activities (%)
Physical Activity - Average hours a day doing sedentary activities
Physical Activity - Average hours a day watching TV or videos
Physical Activity - Average hours a day using computer
Physical Functioning - People having limitations keeping them from working (%)
Physical Functioning - People limited in amount of work they can do (%)
Physical Functioning - People that need special equipment to walk (%)
Physical Functioning - People experiencing confusion/memory problems (%)
Physical Functioning - People requiring special healthcare equipment (%)
Prescription Medications - Average number of prescription medicines taking
Preventive Aspirin Use - Adults 40+ taking low-dose aspirin (%)
Reproductive Health - Vaginal deliveries (%)
Reproductive Health - Cesarean deliveries (%)
Reproductive Health - Deliveries resulted in a live birth (%)
Reproductive Health - Pregnancies resulted in a delivery (%)
Reproductive Health - Women breastfeeding newborns (%)
Reproductive Health - Women that had a hysterectomy (%)
Reproductive Health - Women that had both ovaries removed (%)
Reproductive Health - Women that have ever taken birth control pills (%)
Reproductive Health - Women taking birth control pills (%)
Reproductive Health - Women that have ever used Depo-Provera or injectables (%)
Reproductive Health - Women that have ever used female hormones (%)
Sexual Behavior - People 18+ that ever had sex (vaginal, anal, or oral) (%)
Sexual Behavior - Males 18+ that ever had vaginal sex with a woman (%)
Sexual Behavior - Males 18+ that ever performed oral sex on a woman (%)
Sexual Behavior - Males 18+ that ever had anal sex with a woman (%)
Sexual Behavior - Males 18+ that ever had any sex with a man (%)
Sexual Behavior - Females 18+ that ever had vaginal sex with a man (%)
Sexual Behavior - Females 18+ that ever performed oral sex on a man (%)
Sexual Behavior - Females 18+ that ever had anal sex with a man (%)
Sexual Behavior - Females 18+ that ever had any kind of sex with a woman (%)
Sexual Behavior - Average age people first had sex
Sexual Behavior - Average number of female sex partners in lifetime (males 18+)
Sexual Behavior - Average number of female vaginal sex partners in lifetime (males 18+)
Sexual Behavior - Average age people first performed oral sex on a woman (18+)
Sexual Behavior - Average number of woman performed oral sex on in lifetime (18+)
Sexual Behavior - Average number of male sex partners in lifetime (males 18+)
Sexual Behavior - Average number of male anal sex partners in lifetime (males 18+)
Sexual Behavior - Average age people first performed oral sex on a man (18+)
Sexual Behavior - Average number of male oral sex partners in lifetime (18+)
Sexual Behavior - People using protection when performing oral sex (%)
Sexual Behavior - Average number of times people have vaginal or anal sex a year
Sexual Behavior - People having sex without condom (%)
Sexual Behavior - Average number of male sex partners in lifetime (females 18+)
Sexual Behavior - Average number of male vaginal sex partners in lifetime (females 18+)
Sexual Behavior - Average number of female sex partners in lifetime (females 18+)
Sexual Behavior - Circumcised males 18+ (%)
Sleep Disorders - Average hours sleeping at night
Sleep Disorders - People that has trouble sleeping (%)
Smoking-Cigarette Use - People smoking cigarettes (%)
Taste & Smell - People 40+ having problems with smell (%)
Taste & Smell - People 40+ having problems with taste (%)
Taste & Smell - People 40+ that ever had wisdom teeth removed (%)
Taste & Smell - People 40+ that ever had tonsils teeth removed (%)
Taste & Smell - People 40+ that ever had a loss of consciousness because of a head injury (%)
Taste & Smell - People 40+ that ever had a broken nose or other serious injury to face or skull (%)
Taste & Smell - People 40+ that ever had two or more sinus infections (%)
Weight - Average height (inches)
Weight - Average weight (pounds)
Weight - Average BMI
Weight - People that are obese (%)
Weight - People that ever were obese (%)
Weight - People trying to lose weight (%)
100%
urban population.
Estimated median house/condo value in 2022: $463,871
01902:
$463,871Massachusetts:
$534,700
Median resident age: This zip code:
35.3 yearsMassachusetts median age:
40.3 years
Average household size: This zip code:
2.7 peopleMassachusetts:
2.4 people
Averages for the 2020 tax year for zip code 01902, filed in 2021:
Average Adjusted Gross Income (AGI) in 2020: $44,009 (Individual Income Tax Returns) Here:
$44,009State:
$105,130
Salary/wage: $39,644 (reported on 85.7% of returns )Here:
$39,644State:
$82,951
(% of AGI for various income ranges: 1212.0% for AGIs below $25k , 3486.9% for AGIs $25k-50k , 6572.0% for AGIs $50k-75k , 10313.0% for AGIs $75k-100k , 17110.8% for AGIs $100k-200k , 78448.0% for AGIs over 200k ) Taxable interest for individuals: $589 (reported on 16.4% of returns )This zip code:
$589Massachusetts:
$2,361
(% of AGI for various income ranges: 4.1% for AGIs below $25k , 6.3% for AGIs $25k-50k , 12.6% for AGIs $50k-75k , 25.8% for AGIs $75k-100k , 53.2% for AGIs $100k-200k , 946.0% for AGIs over 200k ) Ordinary dividends: $2,223 (reported on 5.7% of returns )(% of AGI for various income ranges: 4.0% for AGIs below $25k , 5.5% for AGIs $25k-50k , 21.0% for AGIs $50k-75k , 39.7% for AGIs $75k-100k , 56.0% for AGIs $100k-200k , 1624.0% for AGIs over 200k ) Net capital gain/loss in AGI: +$11,112 (reported on 5.7% of returns )Here:
+$11,112State:
+$48,178
(% of AGI for various income ranges: 1.4% for AGIs below $25k , 4.9% for AGIs $25k-50k , 24.1% for AGIs $50k-75k , 94.6% for AGIs $75k-100k , 294.3% for AGIs $100k-200k , 20228.0% for AGIs over 200k ) Profit/loss from business: +$7,749 (reported on 17.6% of returns )Here:
+$7,749State:
+$20,792
(% of AGI for various income ranges: 138.2% for AGIs below $25k , 137.8% for AGIs $25k-50k , 222.6% for AGIs $50k-75k , 249.3% for AGIs $75k-100k , 469.4% for AGIs $100k-200k , 2950.0% for AGIs over 200k ) Taxable individual retirement arrangement distribution: $14,360 (reported on 2.8% of returns )01902:
$14,360Massachusetts:
$22,790
(% of AGI for various income ranges: 16.9% for AGIs below $25k , 21.2% for AGIs $25k-50k , 61.8% for AGIs $50k-75k , 124.6% for AGIs $75k-100k , 247.4% for AGIs $100k-200k , 3320.0% for AGIs over 200k ) Self-employed (Keogh) retirement plans: $16,150 (reported on 0.1% of returns )01902:
$16,150Massachusetts:
$26,868
(% of AGI for various income ranges: 11.3% for AGIs $50k-75k ) Total itemized deductions: $24,313 (reported on 5.8% of returns )Here:
$24,313State:
$36,722
(% of AGI for various income ranges: 31.5% for AGIs below $25k , 82.3% for AGIs $25k-50k , 296.6% for AGIs $50k-75k , 586.6% for AGIs $75k-100k , 930.2% for AGIs $100k-200k , 4670.0% for AGIs over 200k ) Charity contributions: $4,338 (reported on 3.9% of returns )(% of AGI for various income ranges: 1.9% for AGIs below $25k , 7.3% for AGIs $25k-50k , 25.0% for AGIs $50k-75k , 52.5% for AGIs $75k-100k , 155.4% for AGIs $100k-200k , 1160.0% for AGIs over 200k ) Taxes paid: $7,579 (reported on 5.8% of returns )(% of AGI for various income ranges: 7.0% for AGIs below $25k , 22.3% for AGIs $25k-50k , 91.8% for AGIs $50k-75k , 203.7% for AGIs $75k-100k , 317.8% for AGIs $100k-200k , 1226.0% for AGIs over 200k ) Earned income credit: $2,175 (reported on 21.6% of returns )(% of AGI for various income ranges: 100.1% for AGIs below $25k , 79.8% for AGIs $25k-50k , 1.1% for AGIs $50k-75k ) Percentage of individuals using paid preparers for their 2020 taxes: 92.5%(% for various income ranges: 89.5% for AGIs below $25k , 94.5% for AGIs $25k-50k , 93.6% for AGIs $50k-75k , 95.0% for AGIs $75k-100k , 93.8% for AGIs $100k-200k , 95.0% for AGIs over 200k )
Averages for the 2012 tax year for zip code 01902, filed in 2013:
Average Adjusted Gross Income (AGI) in 2012: $35,030 (Individual Income Tax Returns) Here:
$35,030State:
$81,425
Salary/wage: $33,527 (reported on 88.5% of returns )Here:
$33,527State:
$64,752
(% of AGI for various income ranges: 80.5% for AGIs below $25k , 89.4% for AGIs $25k-50k , 86.4% for AGIs $50k-75k , 85.9% for AGIs $75k-100k , 82.0% for AGIs $100k-200k , 66.4% for AGIs over 200k ) Taxable interest for individuals: $574 (reported on 18.0% of returns )This zip code:
$574Massachusetts:
$2,136
(% of AGI for various income ranges: 0.3% for AGIs below $25k , 0.2% for AGIs $25k-50k , 0.3% for AGIs $50k-75k , 0.3% for AGIs $75k-100k , 0.4% for AGIs $100k-200k , 0.4% for AGIs over 200k ) Ordinary dividends: $2,022 (reported on 7.2% of returns )(% of AGI for various income ranges: 0.5% for AGIs below $25k , 0.2% for AGIs $25k-50k , 0.4% for AGIs $50k-75k , 0.5% for AGIs $75k-100k , 0.7% for AGIs $100k-200k , 0.7% for AGIs over 200k ) Net capital gain/loss in AGI: +$2,380 (reported on 4.6% of returns )Here:
+$2,380State:
+$31,437
(% of AGI for various income ranges: 0.3% for AGIs $75k-100k , 1.2% for AGIs $100k-200k , 2.0% for AGIs over 200k ) Profit/loss from business: +$10,902 (reported on 10.9% of returns )Here:
+$10,902State:
+$20,662
(% of AGI for various income ranges: 8.7% for AGIs below $25k , 2.3% for AGIs $25k-50k , 2.1% for AGIs $50k-75k , 2.0% for AGIs $75k-100k , 3.2% for AGIs $100k-200k ) Taxable individual retirement arrangement distribution: $10,966 (reported on 3.9% of returns )01902:
$10,966Massachusetts:
$18,892
(% of AGI for various income ranges: 1.0% for AGIs below $25k , 0.7% for AGIs $25k-50k , 1.2% for AGIs $50k-75k , 1.2% for AGIs $75k-100k , 2.7% for AGIs $100k-200k ) Self-employment retirement plans: $12,467 (reported on 0.2% of returns )01902:
$12,467Massachusetts:
$20,669
Total itemized deductions: $16,779 (25% of AGI, reported on 22.3% of returns )Here:
$16,779State:
$28,907
Here:
24.7% of AGIState:
18.2% of AGI
(% of AGI for various income ranges: 5.8% for AGIs below $25k , 8.5% for AGIs $25k-50k , 12.5% for AGIs $50k-75k , 14.3% for AGIs $75k-100k , 14.5% for AGIs $100k-200k , 12.5% for AGIs over 200k ) Charity contributions: $1,709 (reported on 16.5% of returns )(% of AGI for various income ranges: 0.3% for AGIs below $25k , 0.6% for AGIs $25k-50k , 0.9% for AGIs $50k-75k , 1.2% for AGIs $75k-100k , 1.2% for AGIs $100k-200k , 1.2% for AGIs over 200k ) Taxes paid: $6,052 (reported on 22.2% of returns )01902:
$6,052State:
$13,303
(% of AGI for various income ranges: 1.3% for AGIs below $25k , 2.4% for AGIs $25k-50k , 4.5% for AGIs $50k-75k , 5.5% for AGIs $75k-100k , 6.6% for AGIs $100k-200k , 6.3% for AGIs over 200k ) Earned income credit: $2,317 (reported on 28.2% of returns )(% of AGI for various income ranges: 8.3% for AGIs below $25k , 1.4% for AGIs $25k-50k ) Percentage of individuals using paid preparers for their 2012 taxes: 64.2%(% for various income ranges: 64.2% for AGIs below $25k , 65.0% for AGIs $25k-50k , 62.0% for AGIs $50k-75k , 64.2% for AGIs $75k-100k , 63.5% for AGIs $100k-200k , 75.0% for AGIs over 200k )
Averages for the 2004 tax year for zip code 01902, filed in 2005:
Average Adjusted Gross Income (AGI) in 2004: $31,656 (Individual Income Tax Returns) Here:
$31,656State:
$62,877
Salary/wage: $31,037 (reported on 89.0% of returns )Here:
$31,037State:
$52,969
(% of AGI for various income ranges: 98.4% for AGIs below $10k , 85.8% for AGIs $10k-25k , 91.9% for AGIs $25k-50k , 89.9% for AGIs $50k-75k , 87.2% for AGIs $75k-100k , 70.3% for AGIs over 100k ) Taxable interest for individuals: $731 (reported on 33.3% of returns )This zip code:
$731Massachusetts:
$1,945
(% of AGI for various income ranges: 2.5% for AGIs below $10k , 0.9% for AGIs $10k-25k , 0.6% for AGIs $25k-50k , 0.6% for AGIs $50k-75k , 1.0% for AGIs $75k-100k , 0.8% for AGIs over 100k ) Taxable dividends: $1,701 (reported on 10.4% of returns )(% of AGI for various income ranges: 1.1% for AGIs below $10k , 0.5% for AGIs $10k-25k , 0.4% for AGIs $25k-50k , 0.5% for AGIs $50k-75k , 0.9% for AGIs $75k-100k , 0.8% for AGIs over 100k ) Net capital gain/loss: +$5,575 (reported on 7.7% of returns )Here:
+$5,575State:
+$20,377
(% of AGI for various income ranges: -0.7% for AGIs below $10k , 0.4% for AGIs $10k-25k , 0.5% for AGIs $25k-50k , 0.4% for AGIs $50k-75k , 1.2% for AGIs $75k-100k , 7.0% for AGIs over 100k ) Profit/loss from business: +$8,844 (reported on 11.7% of returns )Here:
+$8,844State:
+$17,837
(% of AGI for various income ranges: 14.8% for AGIs below $10k , 5.8% for AGIs $10k-25k , 2.1% for AGIs $25k-50k , 1.6% for AGIs $50k-75k , 1.6% for AGIs $75k-100k , 4.5% for AGIs over 100k ) IRA payment deduction: $2,548 (reported on 1.3% of returns )01902:
$2,548Massachusetts:
$3,100
(% of AGI for various income ranges: 0.1% for AGIs $10k-25k , 0.1% for AGIs $25k-50k , 0.1% for AGIs $50k-75k , 0.1% for AGIs $75k-100k , 0.0% for AGIs over 100k ) Self-employed pension: $8,692 (reported on 0.3% of returns )Here:
$8,692Massachusetts:
$14,516
(% of AGI for various income ranges: 0.0% for AGIs $10k-25k , 0.1% for AGIs $50k-75k , 0.4% for AGIs over 100k ) Total itemized deductions: $16,735 (30% of AGI, reported on 26.8% of returns )Here:
$16,735State:
$22,573
Here:
29.8% of AGIState:
19.5% of AGI
(% of AGI for various income ranges: 12.7% for AGIs below $10k , 8.2% for AGIs $10k-25k , 15.3% for AGIs $25k-50k , 16.0% for AGIs $50k-75k , 16.5% for AGIs $75k-100k , 14.0% for AGIs over 100k ) Charity contributions deductions: $1,762 (3% of AGI, reported on 22.5% of returns )Here:
3.0% of AGIState:
2.7% of AGI
(% of AGI for various income ranges: 0.5% for AGIs below $10k , 0.7% for AGIs $10k-25k , 1.2% for AGIs $25k-50k , 1.5% for AGIs $50k-75k , 1.6% for AGIs $75k-100k , 1.6% for AGIs over 100k ) Total tax: $3,910 (reported on 68.1% of returns )01902:
$3,910State:
$11,494
(% of AGI for various income ranges: 3.2% for AGIs below $10k , 3.7% for AGIs $10k-25k , 6.7% for AGIs $25k-50k , 9.3% for AGIs $50k-75k , 10.9% for AGIs $75k-100k , 16.2% for AGIs over 100k ) Earned income credit: $1,853 (reported on 24.8% of returns )Percentage of individuals using paid preparers for their 2004 taxes: 66.4%(% for various income ranges: 63.5% for AGIs below $10k , 69.4% for AGIs $10k-25k , 65.5% for AGIs $25k-50k , 65.1% for AGIs $50k-75k , 66.8% for AGIs $75k-100k , 69.1% for AGIs over 100k )
Estimated median household income in 2022: This zip code:
$58,203Massachusetts:
$94,488
Nearest zip codes: 01901 ,
01905 ,
01907 ,
01904 ,
01908 ,
01960 .
Lynn Zip Code Map
Percentage of family households: This zip code:
48.3%Massachusetts:
43.1%
Percentage of households with unmarried partners: This zip code:
6.4%Massachusetts:
45.2%
Likely homosexual households (counted as self-reported same-sex unmarried-partner households)
Lesbian couples: 0.1% of all households Gay men: 0.3% of all households
Household received Food Stamps/SNAP in the past 12 months: 7,496Household did not receive Food Stamps/SNAP in the past 12 months: 12,535
Women who had a birth in the past 12 months: 754 (515 now married , 228 unmarried) Women who did not have a birth in the past 12 months: 12,440 (4,194 now married , 8,268 unmarried)
Housing units in zip code 01902 with a mortgage: 5,593 (612
second mortgage , 71
home equity loan , 467
both second mortgage and home equity loan )
Houses without a mortgage: 213
Median monthly owner costs for units with a mortgage: $2,540
Median monthly owner costs for units without a mortgage: $902
Residents with income below the poverty level in 2022:
This zip code:
16.5%Whole state:
10.4%
Residents with income below 50% of the poverty level in 2022:
This zip code:
7.9%Whole state:
5.1%
Median number of rooms in houses and condos: Median number of rooms in apartments: Notable locations in this zip code not listed on our city pages
Click to draw/clear zip code borders Notable locations in zip code 01902: (A) , Hyde-Mills House (B) , Lynn Fire Department Fayette Street Station (C) , Lynn Fire Department Eastern Avenue Station (D) , Lynn Fire Department Highlands Station (E) , Lynn City Hall (F) , Robert Ford Elementary School Library (G) . Display/hide their locations on the map
Churches in zip code 01902 include: (A) , First Church of Christ Scientist (B) , First Christian Church (C) , First Assembly of God Church (D) , East Baptist Church (E) , Church of the Holy Name (F) , Church of the Angels (G) , The Church of Jesus Christ of Latter Day Saints (H) , Christ United Methodist Church (I) . Display/hide their locations on the map
Cemetery: (1) . Display/hide its location on the map
Lakes: (A) , Goldfish Pond (B) . Display/hide their locations on the map
Parks in zip code 01902 include: (1) , Memorial Park (2) , Clark Street Playground (3) , Kiley Playground (4) . Display/hide their locations on the map
Beach: (A) . Display/hide its location on the map
Year house built (houses)
51 2020 or later374 2010 to 2019576 2000 to 2009810 1990 to 19991,735 1980 to 19892,078 1970 to 19791,882 1960 to 19691,308 1950 to 19591,123 1940 to 19499,479 1939 or earlier
Zip code 01902 household income distribution in 2022 1,902 Less than $10,0001,299 $10,000 to $14,999942 $15,000 to $19,999573 $20,000 to $24,9991,100 $25,000 to $29,999652 $30,000 to $34,999692 $35,000 to $39,999748 $40,000 to $44,999754 $45,000 to $49,9991,234 $50,000 to $59,9991,662 $60,000 to $74,9992,749 $75,000 to $99,9991,673 $100,000 to $124,999964 $125,000 to $149,9991,323 $150,000 to $199,9991,102 $200,000 or moreEstimate of home value of owner-occupied houses/condos in 2022 in zip code 01902 186 Less than $10,00018 $10,000 to $14,99910 $15,000 to $19,99921 $30,000 to $34,99928 $40,000 to $49,99953 $50,000 to $59,99917 $70,000 to $79,99914 $80,000 to $89,99911 $90,000 to $99,99948 $100,000 to $124,99926 $125,000 to $149,99925 $150,000 to $174,99961 $175,000 to $199,999359 $200,000 to $249,999387 $250,000 to $299,9991,695 $300,000 to $399,9991,672 $400,000 to $499,9992,009 $500,000 to $749,999400 $750,000 to $999,99953 $1,000,000 to $1,499,99924 $2,000,000 or moreRent paid by renters in 2022 in zip code 01902 30 Less than $100144 $100 to $149132 $150 to $199522 $200 to $249435 $250 to $299263 $300 to $349154 $350 to $399410 $400 to $449146 $450 to $49920 $550 to $599302 $600 to $64984 $650 to $69954 $700 to $749311 $750 to $799135 $800 to $899299 $900 to $9991,985 $1,000 to $1,2491,385 $1,250 to $1,4993,861 $1,500 to $1,999800 $2,000 to $2,49944 $2,500 to $2,99979 $3,000 to $3,499371 No cash rent
Median gross rent in 2022: $1,567.
Median price asked for vacant for-sale houses and condos in 2022: $331,878.
Estimated median house (or condo) value in 2022 for: White Non-Hispanic householders: $450,675Black or African American householders: $448,645Asian householders: $490,599Some other race householders: $548,456Two or more races householders: $573,832Hispanic or Latino householders: $467,592Estimated median house or condo value in 2022: $463,871
01902:
$463,871Massachusetts:
$534,700
Lower value quartile - upper value quartile: $346,303 - $587,154
Mean price in 2022: Detached houses: $472,944Here:
$472,944State:
$651,570
Townhouses or other attached units: $418,383Here:
$418,383State:
$617,749
In 2-unit structures: $544,117Here:
$544,117State:
$594,808
In 3-to-4-unit structures: $463,028Here:
$463,028State:
$601,912
In 5-or-more-unit structures: $275,488Here:
$275,488State:
$555,768
Housing units in structures:
One, detached: 4,954One, attached: 794Two: 3,0673 or 4: 4,2855 to 9: 1,38310 to 19: 1,33920 to 49: 1,46150 or more: 2,584Mobile homes: 23Unemployment : 5.7%
Means of transportation to work in zip code 01902 60.1% 14,656 Drove a car alone14.4% 3,517 Carpooled5.1% 1,232 Bus or trolley bus1.6% 391 Streetcar or trolley car0.4% 91 Subway or elevated1.8% 447 Taxi0.3% 73 Motorcycle3.9% 943 Walked4.9% 1,197 Other means6.3% 1,533 Worked at homeTravel time to work (commute) in zip code 01902 559 Less than 5 minutes1,265 5 to 9 minutes2,540 10 to 14 minutes1,737 15 to 19 minutes3,376 20 to 24 minutes1,200 25 to 29 minutes4,039 30 to 34 minutes564 35 to 39 minutes1,493 40 to 44 minutes2,157 45 to 59 minutes2,172 60 to 89 minutes1,020 90 or more minutes
Neighborhoods in zip code 01902: Percentage of zip code residents living and working in this county: 58.9%
Household type by relationship:
Households: 51,914
Male householders: 8,471 (2,398 living alone ), Female householders: 10,733 (3,873 living alone )6,155 spouses (6,044 opposite-sex spouses ), 1,187 unmarried partners , (1,042 opposite-sex unmarried partners ), 16,131 children (15,080 natural , 244 adopted , 764 stepchildren ), 1,108 grandchildren , 1,466 brothers or sisters , 1,511 parents , 35 foster children , 2,801 other relatives , 1,613 non-relatives In group quarters: 624 (-1 institutionalized population )
Size of family households: 3,408 2-persons , 2,931 3-persons , 2,702 4-persons , 1,663 5-persons , 563 6-persons , 687 7-or-more-persons
Size of nonfamily households: 6,271 1-person , 736 2-persons , 38 3-persons , 117 4-persons , 8 6-persons
5,245 married couples with children. single-parent households (652 men , 4,286 women ).
38.9% of residents of 01902 zip code speak English at home. of residents speak Spanish at home (42% very well, 17% well, 25% not well, 16% not at all ).of residents speak other Indo-European language at home (52% very well, 26% well, 14% not well, 8% not at all ).of residents speak Asian or Pacific Island language at home (47% very well, 24% well, 27% not well, 2% not at all ).of residents speak other language at home (67% very well, 19% well, 13% not well, 1% not at all ).
Foreign born population: 21,945 (42.3%)
(47.9%
of them are naturalized citizens )
This zip code:
42.3%Whole state:
18.0%
31% Dominica 20% El Salvador 7% Costa Rica 5% Bolivia 4% Honduras 4% Grenada 3% Guatemala 3% Irish 3% Italian 3% Haitian 2% Brazilian 2% English 1% Russian 1% Afghan
Year of entry for the foreign-born population
9,919 2010 or later 5,321 2000 to 2009 4,471 1990 to 1999 4,495 Before 1990
There are
171 Medical Specialists in Zip Code 01902 .
Major facilities with environmental interests located in this zip code:
ABORN SCHOOL (409 EASTERN AVE in LYNN, MA)
AIR MINOR (AIRS/AFS) (National Center for Education Statistics) - STATE ID-163011 CRITERIA AND HAZARDOUS AIR POLLUTANT INVENTORY (Inventory of air pollution sources) Business SIC classification: ELEMENTARY AND SECONDARY SCHOOLSOrganizations: LYNN (SCHOOL DISTRICT)
JCR ELECTRONICS (17 JOYCE STREET in LYNN, MA)
AIR MINOR (AIRS/AFS) CRITERIA AND HAZARDOUS AIR POLLUTANT INVENTORY (Inventory of air pollution sources) (Resource Conservation and Recovery Act (tracking hazardous waste)) Business SIC classification: ELECTRONIC COMPONENTS; NONCLASSIFIABLE ESTABLISHMENTSAlternative names: A C R ELECTRONICS INC, A C R ELECTONICS, ACR ELECTRONICS
NORTH SHORE MEDICAL CENTER (500 LYNNFIELD STREET in LYNN, MA)
AIR SYNTHETIC MINOR (AIRS/AFS) AIR MINOR (AIRS/AFS) CRITERIA AND HAZARDOUS AIR POLLUTANT INVENTORY (Inventory of air pollution sources) Conditionally Exempt Small Quantity Generators, less than 100 kg/month of hazardous waste (Resource Conservation and Recovery Act (tracking hazardous waste)) - notification Business SIC classification: GENERAL MEDICAL AND SURGICAL HOSPITALSOrganizations: NORTH SHORE MEDICAL CTR (CONTACT/OPERATOR)
, ATLANTICARE MEDICAL CTR (CONTACT/OWNER)
Alternative names: NORTH SHORE MEDICAL CENTER UNION HOSPITAL, UNION HOSPITAL
BRICKETT ELEMENTARY (123 LEWIS STREET in LYNN, MA)
(National Center for Education Statistics) - STATE ID-163020 Organizations: LYNN (SCHOOL DISTRICT)
CAREER DEVELOPMENT CENTER (33 NORTH COMMON STREET in LYNN, MA)
(National Center for Education Statistics) - STATE ID-163503 Organizations: LYNN (SCHOOL DISTRICT)
COBBET ELEMENTARY (40 FRANKLIN STREET in LYNN, MA)
(National Center for Education Statistics) - STATE ID-163035 Organizations: LYNN (SCHOOL DISTRICT)
E J HARRINGTON (21 DEXTER STREET in LYNN, MA)
(National Center for Education Statistics) - STATE ID-163045 Organizations: LYNN (SCHOOL DISTRICT)
ENVIRONMENTAL SCHOOL (14 CENTRAL AVENUE in LYNN, MA)
(National Center for Education Statistics) - STATE ID-163530 Organizations: LYNN (SCHOOL DISTRICT)
LYNN ALTERNATIVE HS (20 WHEELER STREET in LYNN, MA)
(National Center for Education Statistics) - STATE ID-163520
LYNN COMMUNITY CHARTER SCHOOL (106 BROAD STREET in LYNN, MA)
(National Center for Education Statistics) - STATE ID-460105
LYNN ENGLISH HIGH (50 GOODRIDGE STREET in LYNN, MA)
(National Center for Education Statistics) - STATE ID-163510
LYNN WTP (GAS WHARF RD in LYNN, MA)
(Integrated Compliance Information System) - ICIS-01-1976-0002, FORMAL ENFORCEMENT ACTION, ICIS-01-1994-0028, Business SIC classification: SEWERAGE SYSTEMS
LYNN PLASTICS COMPANY LLC (92 BROOKLINE ST. in LYNN, MA)
AIR SYNTHETIC MINOR (AIRS/AFS) CRITERIA AND HAZARDOUS AIR POLLUTANT INVENTORY (Inventory of air pollution sources) (Resource Conservation and Recovery Act (tracking hazardous waste)) TRI REPORTER (Tracking of toxic chemicals releasing facilities) Business SIC classification: CUSTOM COMPOUNDING OF PURCHASED PLASTICS RESINSAlternative names: LYNN PLASTICS CORP
Housing units lacking complete plumbing facilities: 0.8%
Housing units lacking complete kitchen facilities: 1.1%
55.7% Utility gas 22.5% Electricity 17.3% Fuel oil, kerosene, etc. 2.9% Bottled, tank, or LP gas 1.0% No fuel used 0.5% Other fuel
Population in 1990: 41,625. Population change in the 1990s: +5,976 (+14.4%).
Place of birth for U.S.-born residents:
This state: 24,050Northeast: 2,023Midwest: 308South: 1,069West: 508
52% of the 01902 zip code residents lived in the same house 5 years ago.
Out of people who lived in different houses, 66% lived in this county.
Out of people who lived in different counties, 50% lived in Massachusetts.
90% of the 01902 zip code residents lived in the same house 1 year ago.
Out of people who lived in different houses, 52% moved from this county.
Out of people who lived in different houses, 31% moved from different county within same state.
Out of people who lived in different houses, 5% moved from different state.
Out of people who lived in different houses, 11% moved from abroad.
Private vs. public school enrollment:
Students in private schools in grades 1 to 8 (elementary and middle school): 241
Here:
4.3%Massachusetts:
10.3%
Students in private schools in grades 9 to 12 (high school): 237
Here:
7.2%Massachusetts:
12.3%
Students in private undergraduate colleges: 685
Here:
33.0%Massachusetts:
51.2%
Occupation by median earnings in the past 12 months ($)
100,876 Architecture and engineering occupations 91,105 Law enforcement workers including supervisors 82,474 Arts, design, entertainment, sports, and media occupations 74,979 Health diagnosing and treating practitioners and other technical occupations 68,982 Computer and mathematical occupations 61,900 Business and financial operations occupations
Companies with federal contracts located in this zip code:
HENRY WEISBERG & SONS INC (183 SHEPARD ST in LYNN, MA; small business) in 6 contracts from 2003 to 2006
Contracts for Insect and Rodent Control Services by ArmySigned by year: 2000: $0; 2001: $0; 2002: $0; 2003: $0; 2004: $8,580; 2005: $1,140; 2006: $3,720.
Biggest contracts: with Army for Insect and Rodent Control Services. Signed on 2004-10-01. Completion date: 2005-09-30.
, same as above. Signed on 2006-01-29. Completion date: 2006-09-30.
, same as above. Signed on 2004-01-07. Completion date: 2004-09-30.
, same as above. Signed on 2005-12-07. Completion date: 2006-09-30.
T C OPHTHALMIC LLC (61 BREED STREET in LYNN, MA; small business)
$4,770 with Navy for Medical and Surgical Instruments, Equipment, and Supplies. Signed on 2005-08-29. Completion date: 2005-09-10.
Top industries in this zip code by the number of employees in 2005:
Health Care and Social Assistance: Nursing Care Facilities (100-249 employees: 1 establishment, 50-99 employees: 1 establishment, 20-49 employees: 1 establishment)Accommodation and Food Services: Full-Service Restaurants (100-249: 1, 20-49: 1, 5-9: 3, 1-4: 2)Administrative and Support and Waste Management and Remediation Services: Employment Placement Agencies (100-249: 1, 20-49: 1, 5-9: 1)Health Care and Social Assistance: Residential Mental Retardation Facilities (20-49: 2, 10-19: 8, 5-9: 1, 1-4: 2)Health Care and Social Assistance: Offices of Dentists (20-49: 1, 10-19: 4, 5-9: 3, 1-4: 10)Construction: Electrical Contractors (50-99: 1, 10-19: 2, 5-9: 1, 1-4: 5)Other Services (except Public Administration): Religious Organizations (50-99: 1, 10-19: 1, 5-9: 1, 1-4: 7)Health Care and Social Assistance: Outpatient Mental Health and Substance Abuse Centers (50-99: 1, 20-49: 1)Health Care and Social Assistance: Other Individual and Family Services (50-99: 1, 10-19: 1, 5-9: 2)
People in group quarters in 2010:
235 people in nursing facilities/skilled-nursing facilities
202 people in group homes intended for adults
49 people in emergency and transitional shelters (with sleeping facilities) for people experiencing homelessness
26 people in residential treatment centers for adults
16 people in group homes for juveniles (non-correctional)
16 people in other noninstitutional facilities
People in group quarters in 2000:
355 people in nursing homes
210 people in other noninstitutional group quarters
105 people in other group homes
87 people in homes for the mentally retarded
51 people in other nonhousehold living situations
17 people in homes for the mentally ill
16 people in homes or halfway houses for drug/alcohol abuse
12 people in religious group quarters
Fatal accident statistics in 2014:
Fatal accident count: 2Vehicles involved in fatal accidents: 3Fatal accidents caused by drunken drivers: 0Fatalities: 2Persons involved in fatal accidents: 3Pedestrians involved in fatal accidents: 0
Fatal accident statistics in 2013:
Fatal accident count: 2Vehicles involved in fatal accidents: 3Fatal accidents caused by drunken drivers: 1Fatalities: 2Persons involved in fatal accidents: 7Pedestrians involved in fatal accidents: 1
Home Mortgage Disclosure Act Aggregated Statistics For Year 2009(Based on 13 full and 10 partial tracts) A) FHA, FSA/RHS & VA B) Conventional C) Refinancings D) Home Improvement Loans E) Loans on Dwellings For 5+ Families F) Non-occupant Loans on Number Average Value Number Average Value Number Average Value Number Average Value Number Average Value Number Average Value
LOANS ORIGINATED 253 $177,546 270 $123,340 647 $187,904 35 $66,410 10 $493,086 130 $146,535 APPLICATIONS APPROVED, NOT ACCEPTED 23 $161,560 16 $102,748 73 $193,772 12 $51,943 2 $880,570 8 $101,038 APPLICATIONS DENIED 89 $173,999 98 $107,425 327 $204,543 29 $62,523 4 $412,500 63 $144,409 APPLICATIONS WITHDRAWN 66 $170,291 57 $127,514 144 $204,198 6 $189,230 0 $0 18 $145,523 FILES CLOSED FOR INCOMPLETENESS 17 $180,145 10 $195,708 51 $221,802 2 $124,000 0 $0 6 $109,493
Aggregated Statistics For Year 2008(Based on 13 full and 10 partial tracts) A) FHA, FSA/RHS & VA B) Conventional C) Refinancings D) Home Improvement Loans E) Loans on Dwellings For 5+ Families F) Non-occupant Loans on Number Average Value Number Average Value Number Average Value Number Average Value Number Average Value Number Average Value
LOANS ORIGINATED 211 $200,669 322 $145,811 439 $207,177 53 $88,652 18 $538,449 135 $161,409 APPLICATIONS APPROVED, NOT ACCEPTED 21 $216,517 30 $173,069 87 $196,893 22 $62,465 3 $655,323 23 $176,392 APPLICATIONS DENIED 78 $208,945 129 $174,963 508 $240,771 84 $43,830 7 $471,236 72 $179,137 APPLICATIONS WITHDRAWN 24 $185,125 68 $178,977 173 $222,118 10 $176,795 1 $1,090,000 28 $174,430 FILES CLOSED FOR INCOMPLETENESS 8 $189,672 12 $182,050 44 $241,671 6 $124,948 0 $0 7 $165,997
Aggregated Statistics For Year 2007(Based on 13 full and 10 partial tracts) A) FHA, FSA/RHS & VA B) Conventional C) Refinancings D) Home Improvement Loans E) Loans on Dwellings For 5+ Families F) Non-occupant Loans on G) Loans On Manufactured Number Average Value Number Average Value Number Average Value Number Average Value Number Average Value Number Average Value Number Average Value
LOANS ORIGINATED 29 $239,270 551 $179,363 915 $213,511 110 $123,234 30 $602,177 140 $213,891 0 $0 APPLICATIONS APPROVED, NOT ACCEPTED 5 $296,422 76 $189,828 211 $242,460 30 $88,338 6 $1,272,800 36 $269,651 1 $369,330 APPLICATIONS DENIED 13 $231,905 280 $216,140 1,148 $259,529 182 $88,445 8 $533,296 108 $228,101 1 $10,000 APPLICATIONS WITHDRAWN 2 $330,000 61 $185,710 444 $248,537 23 $129,234 3 $495,880 40 $252,823 0 $0 FILES CLOSED FOR INCOMPLETENESS 0 $0 27 $249,447 168 $275,416 6 $81,593 2 $1,204,850 9 $254,701 0 $0
Aggregated Statistics For Year 2006(Based on 13 full and 10 partial tracts) A) FHA, FSA/RHS & VA B) Conventional C) Refinancings D) Home Improvement Loans E) Loans on Dwellings For 5+ Families F) Non-occupant Loans on G) Loans On Manufactured Number Average Value Number Average Value Number Average Value Number Average Value Number Average Value Number Average Value Number Average Value
LOANS ORIGINATED 10 $339,484 1,096 $175,363 1,622 $222,664 236 $99,880 35 $575,232 171 $248,290 3 $278,317 APPLICATIONS APPROVED, NOT ACCEPTED 0 $0 156 $179,525 343 $236,116 37 $122,430 2 $371,000 38 $224,870 1 $100,000 APPLICATIONS DENIED 8 $358,405 427 $184,592 1,397 $247,260 222 $82,243 8 $751,299 140 $217,689 8 $269,472 APPLICATIONS WITHDRAWN 0 $0 192 $198,909 842 $251,956 32 $114,250 3 $321,320 54 $291,175 0 $0 FILES CLOSED FOR INCOMPLETENESS 0 $0 44 $183,419 148 $262,149 4 $53,695 0 $0 9 $291,857 2 $337,525
Aggregated Statistics For Year 2005(Based on 13 full and 10 partial tracts) A) FHA, FSA/RHS & VA B) Conventional C) Refinancings D) Home Improvement Loans E) Loans on Dwellings For 5+ Families F) Non-occupant Loans on G) Loans On Manufactured Number Average Value Number Average Value Number Average Value Number Average Value Number Average Value Number Average Value Number Average Value
LOANS ORIGINATED 19 $311,685 1,807 $181,252 1,711 $224,977 195 $133,622 43 $601,153 271 $232,744 1 $24,180 APPLICATIONS APPROVED, NOT ACCEPTED 2 $306,220 145 $191,644 229 $234,587 26 $82,132 1 $143,840 31 $257,328 0 $0 APPLICATIONS DENIED 3 $346,177 487 $185,968 1,197 $242,227 226 $99,399 4 $510,250 124 $243,134 10 $49,854 APPLICATIONS WITHDRAWN 2 $380,710 383 $187,268 782 $235,317 80 $212,985 13 $270,945 92 $266,144 9 $186,390 FILES CLOSED FOR INCOMPLETENESS 0 $0 81 $192,484 338 $261,862 2 $242,995 3 $352,980 25 $246,432 0 $0
Aggregated Statistics For Year 2004(Based on 13 full and 10 partial tracts) A) FHA, FSA/RHS & VA B) Conventional C) Refinancings D) Home Improvement Loans E) Loans on Dwellings For 5+ Families F) Non-occupant Loans on G) Loans On Manufactured Number Average Value Number Average Value Number Average Value Number Average Value Number Average Value Number Average Value Number Average Value
LOANS ORIGINATED 84 $280,362 1,451 $187,439 1,981 $213,445 230 $135,554 46 $650,955 270 $216,874 14 $625,271 APPLICATIONS APPROVED, NOT ACCEPTED 7 $267,677 138 $208,405 321 $222,560 75 $97,944 2 $325,220 36 $219,512 2 $47,525 APPLICATIONS DENIED 16 $294,921 378 $200,343 948 $228,598 264 $93,522 6 $579,513 112 $222,904 8 $175,526 APPLICATIONS WITHDRAWN 17 $352,322 160 $171,090 787 $219,862 96 $115,896 4 $1,681,998 49 $238,912 2 $131,220 FILES CLOSED FOR INCOMPLETENESS 4 $222,642 40 $169,070 246 $232,389 12 $121,436 0 $0 20 $226,144 2 $71,500
Aggregated Statistics For Year 2003(Based on 13 full and 10 partial tracts) A) FHA, FSA/RHS & VA B) Conventional C) Refinancings D) Home Improvement Loans E) Loans on Dwellings For 5+ Families F) Non-occupant Loans on Number Average Value Number Average Value Number Average Value Number Average Value Number Average Value Number Average Value
LOANS ORIGINATED 115 $294,995 1,038 $198,425 3,452 $175,061 85 $36,879 39 $596,671 406 $202,699 APPLICATIONS APPROVED, NOT ACCEPTED 9 $277,054 117 $211,701 512 $184,895 38 $35,746 0 $0 55 $203,687 APPLICATIONS DENIED 33 $255,205 279 $216,795 1,132 $201,527 174 $42,108 6 $399,470 109 $229,074 APPLICATIONS WITHDRAWN 9 $288,318 114 $193,184 994 $187,562 48 $62,209 12 $565,005 40 $211,430 FILES CLOSED FOR INCOMPLETENESS 3 $289,080 21 $230,792 95 $210,732 2 $30,485 0 $0 11 $226,291
Aggregated Statistics For Year 2002(Based on 13 full and 10 partial tracts) A) FHA, FSA/RHS & VA B) Conventional C) Refinancings D) Home Improvement Loans E) Loans on Dwellings For 5+ Families F) Non-occupant Loans on Number Average Value Number Average Value Number Average Value Number Average Value Number Average Value Number Average Value
LOANS ORIGINATED 216 $248,384 954 $178,351 2,397 $162,084 115 $41,529 46 $796,295 307 $184,805 APPLICATIONS APPROVED, NOT ACCEPTED 13 $271,520 74 $200,065 283 $161,593 51 $29,160 2 $682,500 33 $186,742 APPLICATIONS DENIED 39 $301,563 164 $201,686 664 $153,428 159 $30,221 7 $383,626 35 $161,034 APPLICATIONS WITHDRAWN 20 $245,342 113 $169,657 564 $158,959 39 $48,541 3 $252,423 55 $159,938 FILES CLOSED FOR INCOMPLETENESS 4 $196,250 47 $187,207 128 $167,620 0 $0 0 $0 6 $97,733
Aggregated Statistics For Year 2001(Based on 13 full and 10 partial tracts) A) FHA, FSA/RHS & VA B) Conventional C) Refinancings D) Home Improvement Loans E) Loans on Dwellings For 5+ Families F) Non-occupant Loans on Number Average Value Number Average Value Number Average Value Number Average Value Number Average Value Number Average Value
LOANS ORIGINATED 297 $204,777 823 $152,030 1,987 $138,653 131 $32,825 40 $522,938 260 $150,133 APPLICATIONS APPROVED, NOT ACCEPTED 21 $183,344 82 $149,328 277 $120,346 55 $30,909 5 $279,560 33 $123,045 APPLICATIONS DENIED 63 $219,982 165 $171,142 725 $120,747 277 $26,341 7 $781,049 67 $147,651 APPLICATIONS WITHDRAWN 19 $191,650 68 $144,197 517 $130,093 77 $58,341 4 $1,410,175 32 $138,367 FILES CLOSED FOR INCOMPLETENESS 1 $232,000 14 $135,239 82 $136,348 3 $19,333 3 $408,573 4 $96,500
Aggregated Statistics For Year 2000(Based on 13 full and 10 partial tracts) A) FHA, FSA/RHS & VA B) Conventional C) Refinancings D) Home Improvement Loans E) Loans on Dwellings For 5+ Families F) Non-occupant Loans on Number Average Value Number Average Value Number Average Value Number Average Value Number Average Value Number Average Value
LOANS ORIGINATED 239 $156,594 792 $131,771 557 $106,339 131 $21,029 33 $567,632 155 $116,918 APPLICATIONS APPROVED, NOT ACCEPTED 14 $155,001 79 $136,317 109 $110,024 83 $29,833 0 $0 17 $110,748 APPLICATIONS DENIED 54 $165,437 203 $125,360 445 $86,044 198 $25,290 5 $163,540 54 $103,613 APPLICATIONS WITHDRAWN 13 $154,185 118 $124,621 348 $85,417 24 $47,070 3 $725,067 25 $120,533 FILES CLOSED FOR INCOMPLETENESS 10 $125,123 22 $101,501 109 $125,236 1 $42,570 0 $0 12 $115,520
Aggregated Statistics For Year 1999(Based on 8 full and 6 partial tracts) A) FHA, FSA/RHS & VA B) Conventional C) Refinancings D) Home Improvement Loans E) Loans on Dwellings For 5+ Families F) Non-occupant Loans on Number Average Value Number Average Value Number Average Value Number Average Value Number Average Value Number Average Value
LOANS ORIGINATED 146 $127,596 450 $109,742 578 $93,736 77 $26,430 16 $492,215 137 $99,635 APPLICATIONS APPROVED, NOT ACCEPTED 10 $114,339 51 $106,350 119 $99,858 33 $30,487 2 $364,720 22 $106,140 APPLICATIONS DENIED 36 $131,058 89 $107,597 286 $89,409 97 $19,633 1 $428,940 53 $111,267 APPLICATIONS WITHDRAWN 12 $140,847 62 $113,968 229 $90,997 23 $56,973 1 $208,000 25 $109,491 FILES CLOSED FOR INCOMPLETENESS 2 $129,830 7 $94,027 58 $99,430 2 $65,000 0 $0 10 $111,186
Private Mortgage Insurance Companies Aggregated Statistics For Year 2009(Based on 12 full and 10 partial tracts) A) Conventional B) Refinancings C) Non-occupant Loans on Number Average Value Number Average Value Number Average Value
LOANS ORIGINATED 21 $176,598 8 $223,408 0 $0 APPLICATIONS APPROVED, NOT ACCEPTED 17 $194,428 10 $240,801 0 $0 APPLICATIONS DENIED 20 $188,293 9 $162,546 4 $147,520 APPLICATIONS WITHDRAWN 5 $193,116 4 $196,880 0 $0 FILES CLOSED FOR INCOMPLETENESS 0 $0 3 $163,400 0 $0
Aggregated Statistics For Year 2008(Based on 13 full and 10 partial tracts) A) Conventional B) Refinancings C) Non-occupant Loans on D) Loans On Manufactured Number Average Value Number Average Value Number Average Value Number Average Value
LOANS ORIGINATED 81 $199,528 34 $233,387 7 $186,071 0 $0 APPLICATIONS APPROVED, NOT ACCEPTED 54 $230,301 37 $274,066 4 $218,492 0 $0 APPLICATIONS DENIED 10 $187,156 1 $193,730 2 $293,890 0 $0 APPLICATIONS WITHDRAWN 3 $251,197 0 $0 0 $0 0 $0 FILES CLOSED FOR INCOMPLETENESS 7 $175,656 2 $299,410 0 $0 2 $94,990
Aggregated Statistics For Year 2007(Based on 13 full and 10 partial tracts) A) Conventional B) Refinancings C) Non-occupant Loans on Number Average Value Number Average Value Number Average Value
LOANS ORIGINATED 195 $224,831 102 $285,677 15 $224,110 APPLICATIONS APPROVED, NOT ACCEPTED 18 $247,518 34 $281,937 3 $245,940 APPLICATIONS DENIED 4 $216,250 7 $285,111 0 $0 APPLICATIONS WITHDRAWN 8 $286,899 14 $377,017 0 $0 FILES CLOSED FOR INCOMPLETENESS 0 $0 1 $163,000 0 $0
Aggregated Statistics For Year 2006(Based on 13 full and 10 partial tracts) A) Conventional B) Refinancings C) Non-occupant Loans on Number Average Value Number Average Value Number Average Value
LOANS ORIGINATED 75 $239,112 71 $298,968 2 $263,775 APPLICATIONS APPROVED, NOT ACCEPTED 9 $221,969 21 $336,367 1 $327,000 APPLICATIONS DENIED 0 $0 6 $315,178 1 $205,000 APPLICATIONS WITHDRAWN 5 $215,426 8 $306,762 1 $223,000 FILES CLOSED FOR INCOMPLETENESS 0 $0 0 $0 0 $0
Aggregated Statistics For Year 2005(Based on 13 full and 10 partial tracts) A) Conventional B) Refinancings C) Non-occupant Loans on Number Average Value Number Average Value Number Average Value
LOANS ORIGINATED 155 $216,669 51 $285,303 13 $161,220 APPLICATIONS APPROVED, NOT ACCEPTED 21 $190,164 14 $320,147 3 $176,507 APPLICATIONS DENIED 0 $0 0 $0 1 $187,650 APPLICATIONS WITHDRAWN 6 $194,617 2 $342,500 0 $0 FILES CLOSED FOR INCOMPLETENESS 0 $0 0 $0 0 $0
Aggregated Statistics For Year 2004(Based on 13 full and 10 partial tracts) A) Conventional B) Refinancings C) Non-occupant Loans on Number Average Value Number Average Value Number Average Value
LOANS ORIGINATED 261 $223,025 64 $273,100 22 $218,794 APPLICATIONS APPROVED, NOT ACCEPTED 39 $227,564 13 $233,038 1 $217,000 APPLICATIONS DENIED 6 $303,912 3 $261,667 1 $217,000 APPLICATIONS WITHDRAWN 13 $219,302 7 $305,017 0 $0 FILES CLOSED FOR INCOMPLETENESS 1 $360,000 0 $0 0 $0
Aggregated Statistics For Year 2003(Based on 13 full and 10 partial tracts) A) Conventional B) Refinancings C) Non-occupant Loans on Number Average Value Number Average Value Number Average Value
LOANS ORIGINATED 270 $221,899 129 $219,813 21 $230,485 APPLICATIONS APPROVED, NOT ACCEPTED 45 $229,741 28 $204,068 1 $326,740 APPLICATIONS DENIED 10 $272,935 4 $283,540 1 $252,280 APPLICATIONS WITHDRAWN 10 $214,911 11 $204,231 2 $173,620 FILES CLOSED FOR INCOMPLETENESS 0 $0 0 $0 0 $0
Aggregated Statistics For Year 2002(Based on 13 full and 10 partial tracts) A) Conventional B) Refinancings C) Non-occupant Loans on Number Average Value Number Average Value Number Average Value
LOANS ORIGINATED 290 $207,116 83 $202,977 24 $180,552 APPLICATIONS APPROVED, NOT ACCEPTED 25 $181,801 17 $187,667 2 $162,045 APPLICATIONS DENIED 15 $252,105 0 $0 3 $234,333 APPLICATIONS WITHDRAWN 12 $201,280 10 $149,947 0 $0 FILES CLOSED FOR INCOMPLETENESS 0 $0 0 $0 0 $0
Aggregated Statistics For Year 2001(Based on 13 full and 10 partial tracts) A) Conventional B) Refinancings C) Non-occupant Loans on Number Average Value Number Average Value Number Average Value
LOANS ORIGINATED 302 $176,799 87 $163,774 42 $156,823 APPLICATIONS APPROVED, NOT ACCEPTED 19 $130,813 20 $157,540 4 $122,185 APPLICATIONS DENIED 7 $172,337 5 $193,904 3 $221,023 APPLICATIONS WITHDRAWN 5 $134,118 3 $175,503 1 $167,790 FILES CLOSED FOR INCOMPLETENESS 2 $135,000 0 $0 1 $189,000
Aggregated Statistics For Year 2000(Based on 13 full and 10 partial tracts) A) Conventional B) Refinancings C) Non-occupant Loans on Number Average Value Number Average Value Number Average Value
LOANS ORIGINATED 299 $140,003 59 $114,447 43 $119,345 APPLICATIONS APPROVED, NOT ACCEPTED 38 $142,598 4 $67,750 7 $72,426 APPLICATIONS DENIED 20 $135,700 3 $133,667 2 $135,790 APPLICATIONS WITHDRAWN 9 $170,892 0 $0 2 $209,610 FILES CLOSED FOR INCOMPLETENESS 0 $0 1 $107,000 0 $0
Aggregated Statistics For Year 1999(Based on 8 full and 6 partial tracts) A) Conventional B) Refinancings C) Non-occupant Loans on Number Average Value Number Average Value Number Average Value
LOANS ORIGINATED 167 $119,229 43 $111,953 29 $97,636 APPLICATIONS APPROVED, NOT ACCEPTED 12 $108,879 8 $138,848 5 $125,194 APPLICATIONS DENIED 15 $96,987 2 $124,860 6 $95,840 APPLICATIONS WITHDRAWN 9 $107,939 0 $0 4 $88,842 FILES CLOSED FOR INCOMPLETENESS 5 $108,368 2 $136,980 4 $119,442
2002 - 2018 National Fire Incident Reporting System (NFIRS) incidents See full 2006 National Fire Incident Reporting System statistics for zip code 01902, Massachusetts
Most common first names in zip code 01902 among deceased individuals Name Count Lived (average)
Mary 561 80.6 years John 489 72.5 years Joseph 314 74.2 years William 310 73.9 years James 264 73.2 years George 239 74.2 years Helen 215 78.0 years Charles 213 74.0 years Margaret 204 80.4 years Robert 192 68.1 years
Most common last names in zip code 01902 among deceased individuals Last name Count Lived (average)
Smith 116 75.8 years Brown 82 76.2 years Murphy 66 76.6 years Johnson 46 75.7 years Burke 43 78.2 years Leblanc 43 74.8 years Obrien 39 71.3 years Sullivan 37 76.3 years Williams 37 77.6 years Hill 35 76.8 years
Businesses in zip code 01902
Name Count Name Count
CVS 1 Little Caesars Pizza 1 Circle K 1 Rite Aid 1 DHL 1 UPS 1 Dunkin Donuts 1 YMCA 2 FedEx 1
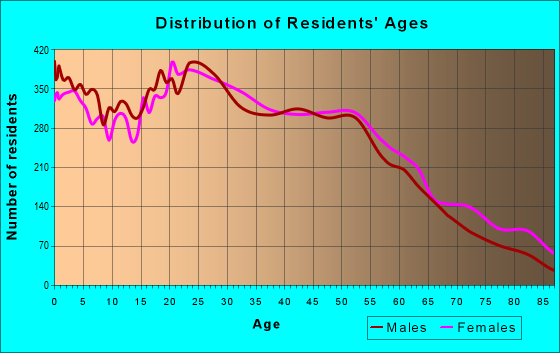


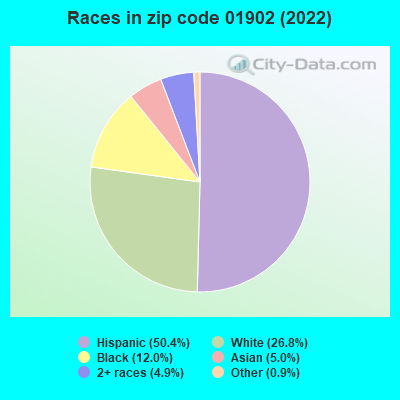


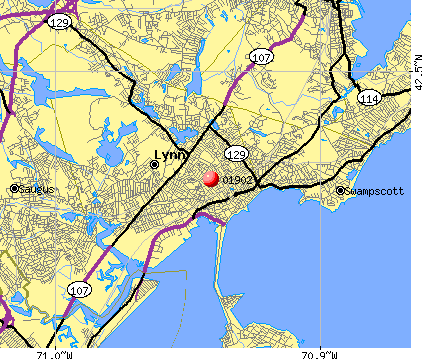 Nearest zip codes: 01901, 01905, 01907, 01904, 01908, 01960.
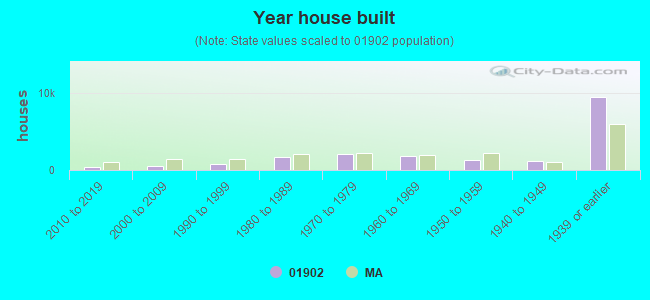
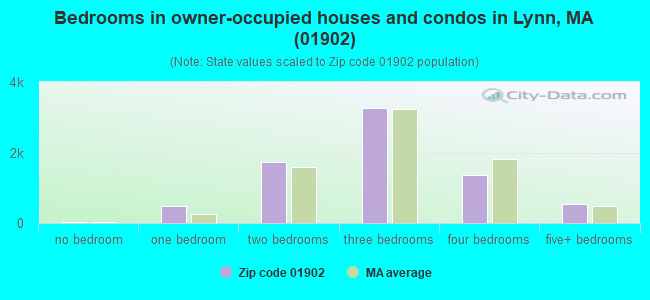
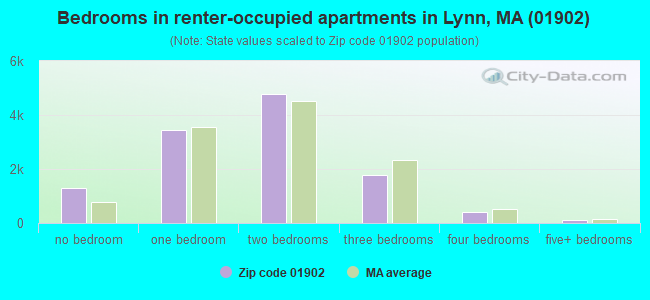
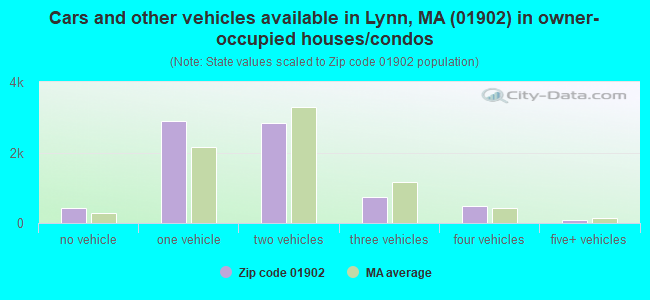
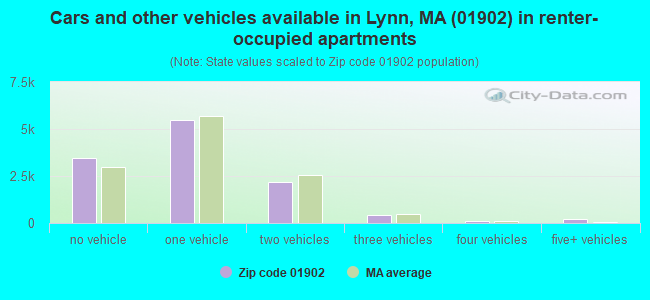


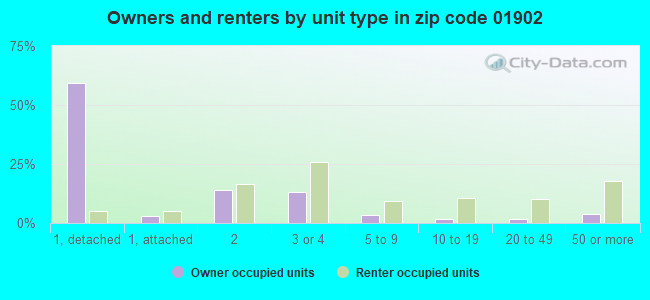
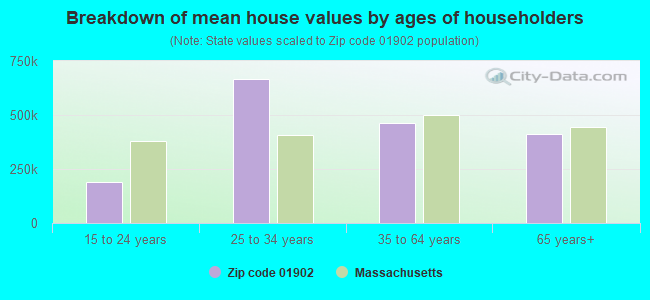


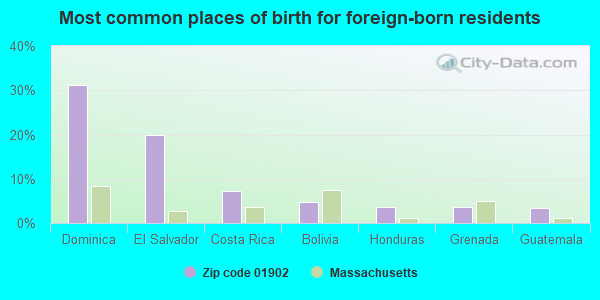
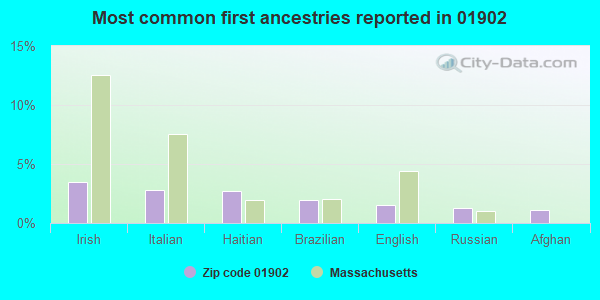
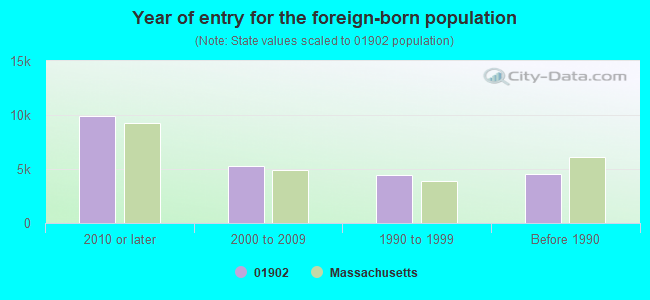
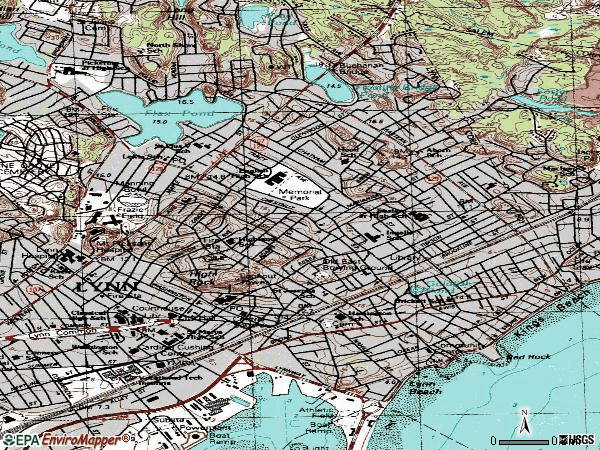

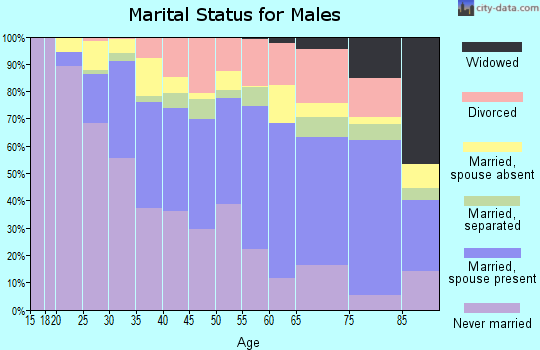
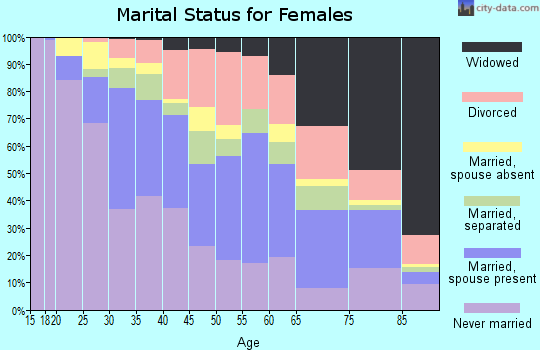
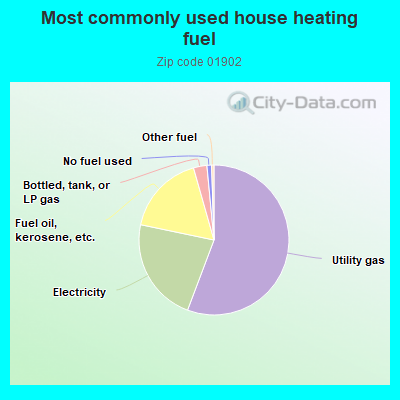
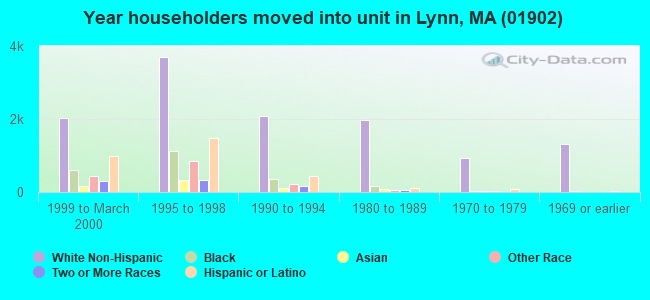
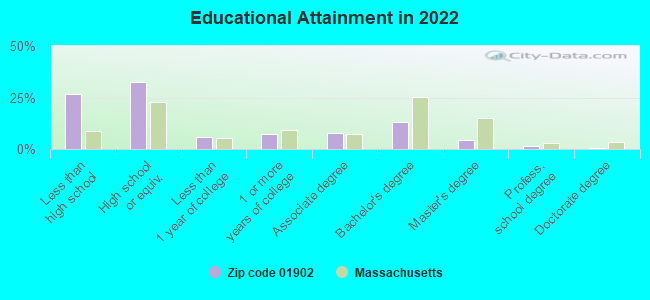
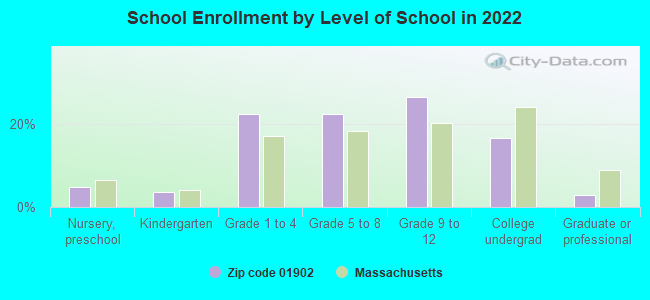
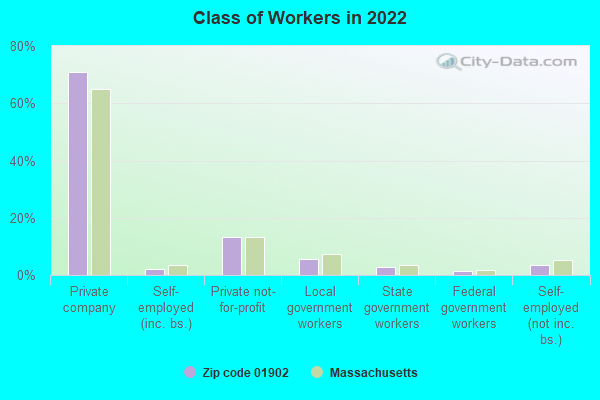
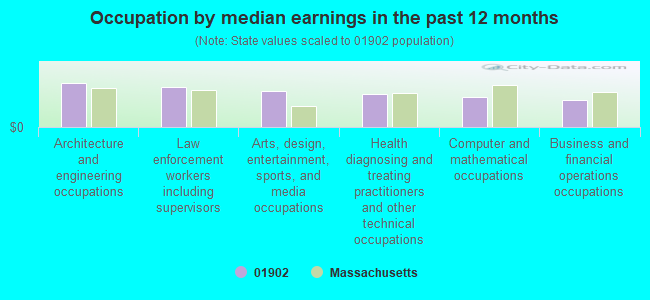
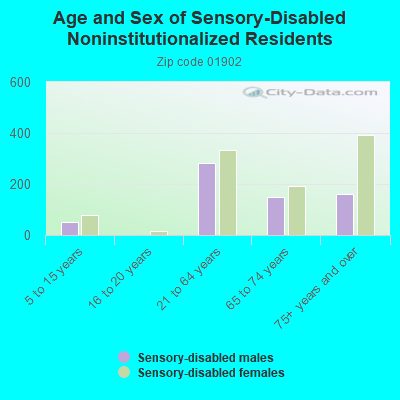
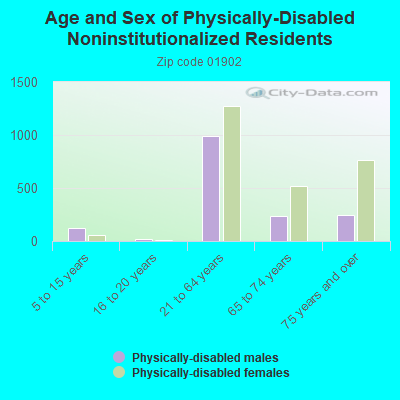
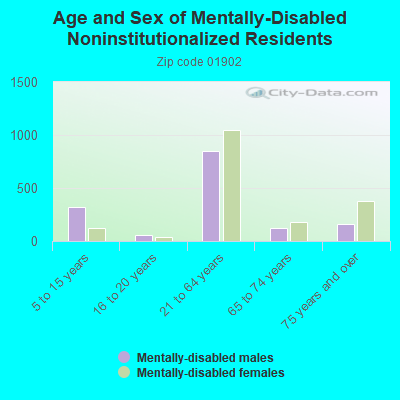
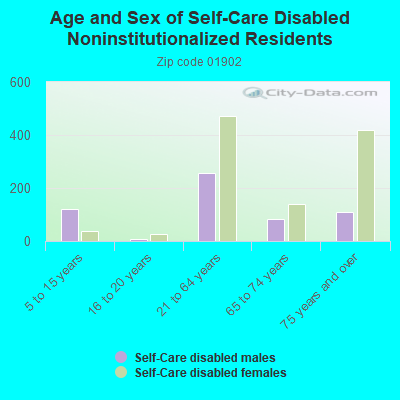
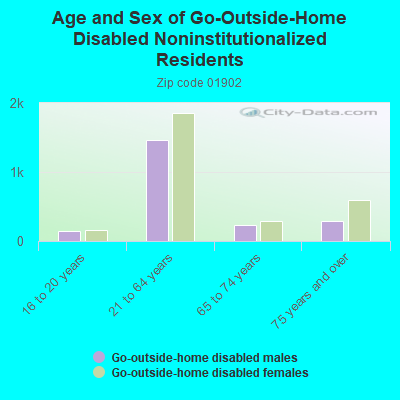
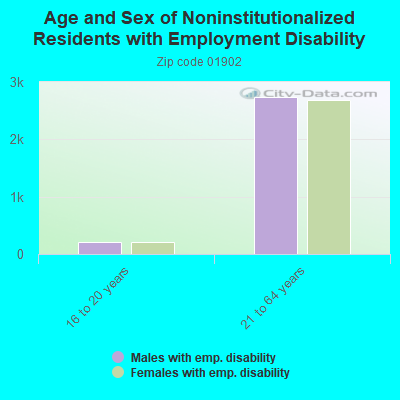
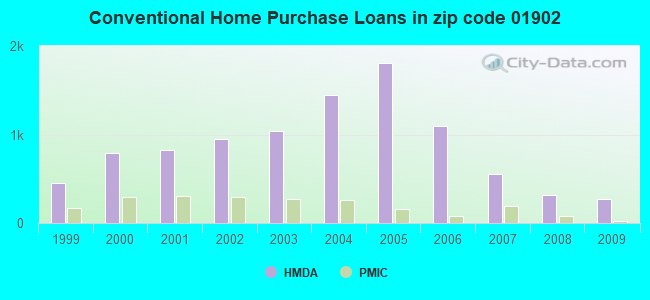
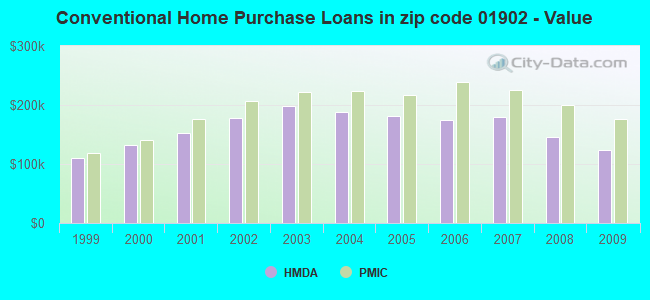
 Based on the data from the years 2002 - 2018 the average number of fire incidents per year is 155. The highest number of reported fires - 300 took place in 2011, and the least - 32 in 2005. The data has a rising trend.
 When looking into fire subcategories, the most reports belonged to: Structure Fires (79.7%), and Outside Fires (11.6%).