Estimated zip code population in 2022: 54,039 Zip code population in 2010: 50,944 Zip code population in 2000: 48,129
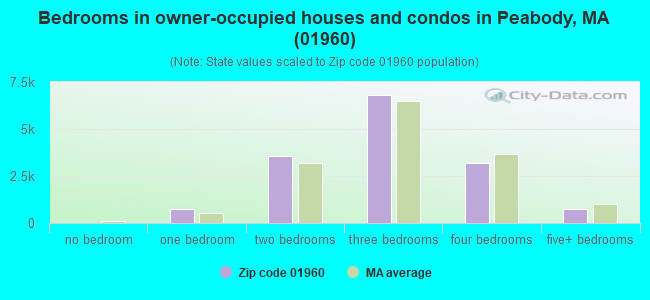
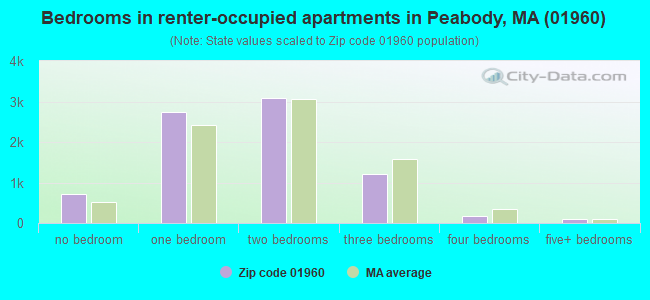
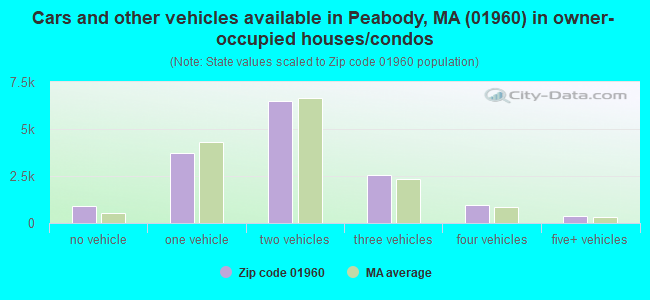
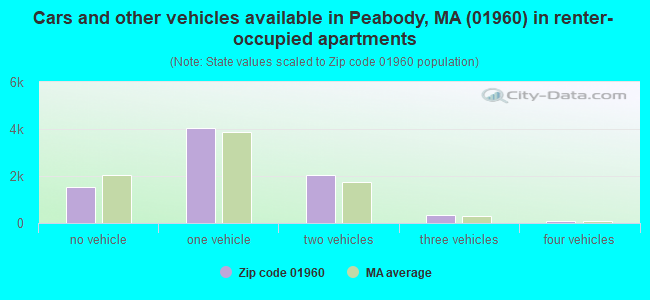
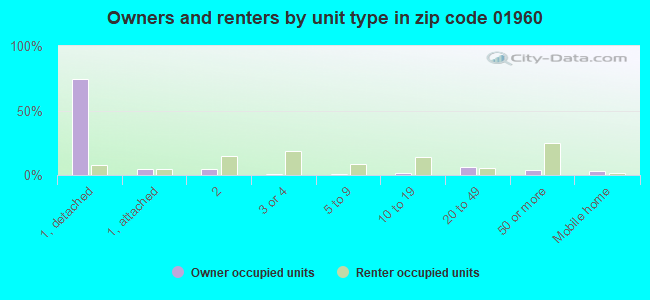
Houses and condos: 23,448 Renter-occupied apartments: 8,028
% of renters here:
35%
State:
38%
March 2022 cost of living index in zip code 01960: 135.3 (high, U.S. average is 100)
Land area: 16.0 sq. mi. Water area: 0.6 sq. mi.
Population density: 3,378 people per square mile
(average).
OSM Map
Google Map
MSN Map
OSM Map
General Map
Google Map
MSN Map
OSM Map
Google Map
MSN Map
OSM Map
Google Map
MSN Map
Please wait while loading the map...
Real estate property taxes paid for housing units in 2022:
This zip code:
0.8% ($4,691)
Massachusetts:
1.0% ($5,536)
Median real estate property taxes paid for housing units with mortgages in 2022: $4,802 (0.8%) Median real estate property taxes paid for housing units with no mortgage in 2022: $4,478 (0.9%)
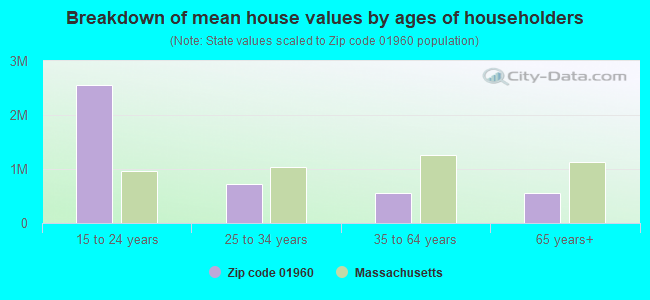
Estimated median house/condo value in 2022: $561,993
01960:
$561,993
Massachusetts:
$534,700
According to our research of Massachusetts and other state lists, there were 19 registered sex offenders living in 01960 zip code as of April 27, 2024. The ratio of all residents to sex offenders in zip code 01960 is 2,773 to 1. The ratio of registered sex offenders to all residents in this zip code is lower than the state average.
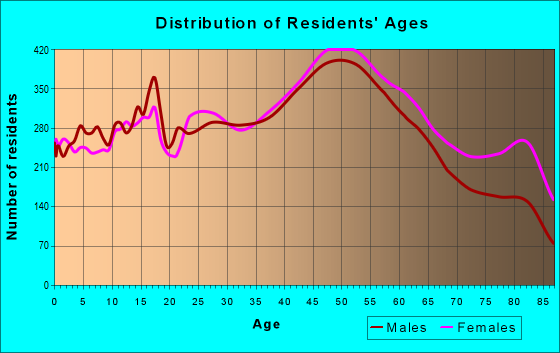
Median resident age:
This zip code:
47.4 years
Massachusetts median age:
40.3 years
Average household size:
This zip code:
2.3 people
Massachusetts:
2.4 people
Averages for the 2020 tax year for zip code 01960, filed in 2021:
Average Adjusted Gross Income (AGI) in 2020: $76,167 (Individual Income Tax Returns)
Here:
$76,167
State:
$105,130
Salary/wage: $64,961 (reported on 77.3% of returns)
Here:
$64,961
State:
$82,951
(% of AGI for various income ranges: 1102.7% for AGIs below $25k, 3477.5% for AGIs $25k-50k, 6453.0% for AGIs $50k-75k, 9320.3% for AGIs $75k-100k, 18342.1% for AGIs $100k-200k, 74314.1% for AGIs over 200k)
Taxable interest for individuals: $1,635 (reported on 39.0% of returns)
This zip code:
$1,635
Massachusetts:
$2,361
(% of AGI for various income ranges: 30.8% for AGIs below $25k, 36.7% for AGIs $25k-50k, 67.7% for AGIs $50k-75k, 112.3% for AGIs $75k-100k, 166.0% for AGIs $100k-200k, 1490.7% for AGIs over 200k)
Ordinary dividends: $5,181 (reported on 23.0% of returns)
Here:
$5,181
State:
$10,365
(% of AGI for various income ranges: 40.7% for AGIs below $25k, 50.3% for AGIs $25k-50k, 116.3% for AGIs $50k-75k, 170.7% for AGIs $75k-100k, 367.9% for AGIs $100k-200k, 2984.9% for AGIs over 200k)
Net capital gain/loss in AGI: +$25,992 (reported on 19.3% of returns)
Here:
+$25,992
State:
+$48,178
(% of AGI for various income ranges: 8.5% for AGIs below $25k, 30.0% for AGIs $25k-50k, 79.1% for AGIs $50k-75k, 206.1% for AGIs $75k-100k, 509.5% for AGIs $100k-200k, 29986.1% for AGIs over 200k)
Profit/loss from business: +$14,089 (reported on 14.7% of returns)
Here:
+$14,089
State:
+$20,792
(% of AGI for various income ranges: 146.6% for AGIs below $25k, 174.8% for AGIs $25k-50k, 238.5% for AGIs $50k-75k, 335.4% for AGIs $75k-100k, 431.9% for AGIs $100k-200k, 4539.3% for AGIs over 200k)
Taxable individual retirement arrangement distribution: $19,101 (reported on 12.3% of returns)
01960:
$19,101
Massachusetts:
$22,790
(% of AGI for various income ranges: 101.7% for AGIs below $25k, 154.1% for AGIs $25k-50k, 297.4% for AGIs $50k-75k, 470.3% for AGIs $75k-100k, 830.5% for AGIs $100k-200k, 3118.0% for AGIs over 200k)
Self-employed (Keogh) retirement plans: $17,893 (reported on 0.5% of returns)
01960:
$17,893
Massachusetts:
$26,868
(% of AGI for various income ranges: 11.5% for AGIs $50k-75k, 19.2% for AGIs $100k-200k, 378.0% for AGIs over 200k)
Total itemized deductions: $29,133 (reported on 12.3% of returns)
Here:
$29,133
State:
$36,722
(% of AGI for various income ranges: 127.9% for AGIs below $25k, 179.1% for AGIs $25k-50k, 466.4% for AGIs $50k-75k, 769.7% for AGIs $75k-100k, 1228.3% for AGIs $100k-200k, 5555.4% for AGIs over 200k)
Charity contributions: $4,221 (reported on 9.3% of returns)
Here:
$4,221
State:
$12,529
(% of AGI for various income ranges: 4.6% for AGIs below $25k, 9.9% for AGIs $25k-50k, 33.2% for AGIs $50k-75k, 59.1% for AGIs $75k-100k, 135.2% for AGIs $100k-200k, 1095.1% for AGIs over 200k)
Taxes paid: $8,066 (reported on 12.3% of returns)
01960:
$8,066
State:
$8,782
(% of AGI for various income ranges: 20.3% for AGIs below $25k, 37.5% for AGIs $25k-50k, 134.4% for AGIs $50k-75k, 250.4% for AGIs $75k-100k, 397.3% for AGIs $100k-200k, 1186.1% for AGIs over 200k)
Earned income credit: $1,753 (reported on 8.0% of returns)
Here:
$1,753
State:
$1,909
(% of AGI for various income ranges: 48.7% for AGIs below $25k, 40.7% for AGIs $25k-50k, 0.4% for AGIs $50k-75k)
Percentage of individuals using paid preparers for their 2020 taxes: 91.6%
Here:
92%
State:
92%
(% for various income ranges: 89.3% for AGIs below $25k, 91.8% for AGIs $25k-50k, 92.6% for AGIs $50k-75k, 92.4% for AGIs $75k-100k, 92.7% for AGIs $100k-200k, 93.8% for AGIs over 200k)
Averages for the 2012 tax year for zip code 01960, filed in 2013:
Average Adjusted Gross Income (AGI) in 2012: $59,513 (Individual Income Tax Returns)
Here:
$59,513
State:
$81,425
Salary/wage: $53,654 (reported on 80.0% of returns)
Here:
$53,654
State:
$64,752
(% of AGI for various income ranges: 65.5% for AGIs below $25k, 73.3% for AGIs $25k-50k, 71.6% for AGIs $50k-75k, 74.1% for AGIs $75k-100k, 79.6% for AGIs $100k-200k, 55.3% for AGIs over 200k)
Taxable interest for individuals: $1,297 (reported on 44.2% of returns)
This zip code:
$1,297
Massachusetts:
$2,136
(% of AGI for various income ranges: 1.9% for AGIs below $25k, 1.1% for AGIs $25k-50k, 1.0% for AGIs $50k-75k, 0.8% for AGIs $75k-100k, 0.6% for AGIs $100k-200k, 1.3% for AGIs over 200k)
Ordinary dividends: $4,232 (reported on 25.0% of returns)
Here:
$4,232
State:
$9,473
(% of AGI for various income ranges: 2.3% for AGIs below $25k, 1.5% for AGIs $25k-50k, 1.6% for AGIs $50k-75k, 1.4% for AGIs $75k-100k, 1.3% for AGIs $100k-200k, 3.4% for AGIs over 200k)
Net capital gain/loss in AGI: +$9,636 (reported on 17.9% of returns)
Here:
+$9,636
State:
+$31,437
(% of AGI for various income ranges: 0.1% for AGIs $25k-50k, 0.4% for AGIs $50k-75k, 0.5% for AGIs $75k-100k, 1.1% for AGIs $100k-200k, 16.4% for AGIs over 200k)
Profit/loss from business: +$14,632 (reported on 12.5% of returns)
Here:
+$14,632
State:
+$20,662
(% of AGI for various income ranges: 7.8% for AGIs below $25k, 3.1% for AGIs $25k-50k, 2.5% for AGIs $50k-75k, 2.5% for AGIs $75k-100k, 2.6% for AGIs $100k-200k, 3.3% for AGIs over 200k)
Taxable individual retirement arrangement distribution: $14,387 (reported on 13.9% of returns)
01960:
$14,387
Massachusetts:
$18,892
(% of AGI for various income ranges: 5.1% for AGIs below $25k, 3.4% for AGIs $25k-50k, 3.5% for AGIs $50k-75k, 3.5% for AGIs $75k-100k, 3.0% for AGIs $100k-200k, 3.0% for AGIs over 200k)
Self-employment retirement plans: $16,093 (reported on 0.6% of returns)
01960:
$16,093
Massachusetts:
$20,669
(% of AGI for various income ranges: 0.1% for AGIs below $25k, 0.1% for AGIs $50k-75k, 0.2% for AGIs $100k-200k, 0.5% for AGIs over 200k)
Total itemized deductions: $21,622 (21% of AGI, reported on 38.1% of returns)
Here:
$21,622
State:
$28,907
Here:
21.2% of AGI
State:
18.2% of AGI
(% of AGI for various income ranges: 13.4% for AGIs below $25k, 10.8% for AGIs $25k-50k, 13.6% for AGIs $50k-75k, 14.9% for AGIs $75k-100k, 15.7% for AGIs $100k-200k, 11.8% for AGIs over 200k)
Charity contributions: $2,089 (reported on 32.1% of returns)
Here:
$2,089
State:
$4,208
(% of AGI for various income ranges: 0.8% for AGIs below $25k, 0.7% for AGIs $25k-50k, 1.0% for AGIs $50k-75k, 1.0% for AGIs $75k-100k, 1.2% for AGIs $100k-200k, 1.9% for AGIs over 200k)
Taxes paid: $8,512 (reported on 38.0% of returns)
01960:
$8,512
State:
$13,303
(% of AGI for various income ranges: 2.8% for AGIs below $25k, 3.0% for AGIs $25k-50k, 4.9% for AGIs $50k-75k, 5.5% for AGIs $75k-100k, 6.9% for AGIs $100k-200k, 6.1% for AGIs over 200k)
Earned income credit: $1,843 (reported on 10.3% of returns)
Here:
$1,843
State:
$1,971
(% of AGI for various income ranges: 3.6% for AGIs below $25k, 0.6% for AGIs $25k-50k)
Percentage of individuals using paid preparers for their 2012 taxes: 60.8%
Here:
61%
State:
56%
(% for various income ranges: 56.2% for AGIs below $25k, 59.3% for AGIs $25k-50k, 62.0% for AGIs $50k-75k, 65.1% for AGIs $75k-100k, 67.2% for AGIs $100k-200k, 72.7% for AGIs over 200k)
Averages for the 2004 tax year for zip code 01960, filed in 2005:
Average Adjusted Gross Income (AGI) in 2004: $50,061 (Individual Income Tax Returns)
Here:
$50,061
State:
$62,877
Salary/wage: $46,410 (reported on 81.1% of returns)
Here:
$46,410
State:
$52,969
(% of AGI for various income ranges: 100.9% for AGIs below $10k, 64.4% for AGIs $10k-25k, 75.6% for AGIs $25k-50k, 76.3% for AGIs $50k-75k, 82.5% for AGIs $75k-100k, 71.7% for AGIs over 100k)
Taxable interest for individuals: $1,541 (reported on 61.2% of returns)
This zip code:
$1,541
Massachusetts:
$1,945
(% of AGI for various income ranges: 7.2% for AGIs below $10k, 4.1% for AGIs $10k-25k, 2.1% for AGIs $25k-50k, 1.7% for AGIs $50k-75k, 1.3% for AGIs $75k-100k, 1.5% for AGIs over 100k)
Taxable dividends: $2,444 (reported on 31.4% of returns)
Here:
$2,444
State:
$5,323
(% of AGI for various income ranges: 4.8% for AGIs below $10k, 2.5% for AGIs $10k-25k, 1.6% for AGIs $25k-50k, 1.4% for AGIs $50k-75k, 0.9% for AGIs $75k-100k, 1.6% for AGIs over 100k)
Net capital gain/loss: +$7,522 (reported on 23.8% of returns)
Here:
+$7,522
State:
+$20,377
(% of AGI for various income ranges: -3.0% for AGIs below $10k, -0.3% for AGIs $10k-25k, 0.3% for AGIs $25k-50k, 0.8% for AGIs $50k-75k, 0.9% for AGIs $75k-100k, 9.1% for AGIs over 100k)
Profit/loss from business: +$12,933 (reported on 12.8% of returns)
Here:
+$12,933
State:
+$17,837
(% of AGI for various income ranges: 7.3% for AGIs below $10k, 5.3% for AGIs $10k-25k, 3.2% for AGIs $25k-50k, 3.0% for AGIs $50k-75k, 2.4% for AGIs $75k-100k, 3.4% for AGIs over 100k)
IRA payment deduction: $3,282 (reported on 2.7% of returns)
01960:
$3,282
Massachusetts:
$3,100
(% of AGI for various income ranges: 0.4% for AGIs below $10k, 0.3% for AGIs $10k-25k, 0.3% for AGIs $25k-50k, 0.2% for AGIs $50k-75k, 0.2% for AGIs $75k-100k, 0.1% for AGIs over 100k)
Self-employed pension: $12,017 (reported on 0.9% of returns)
Here:
$12,017
Massachusetts:
$14,516
(% of AGI for various income ranges: 0.0% for AGIs $10k-25k, 0.1% for AGIs $25k-50k, 0.1% for AGIs $50k-75k, 0.1% for AGIs $75k-100k, 0.5% for AGIs over 100k)
Total itemized deductions: $18,533 (23% of AGI, reported on 41.4% of returns)
Here:
$18,533
State:
$22,573
Here:
22.7% of AGI
State:
19.5% of AGI
(% of AGI for various income ranges: 16.3% for AGIs below $10k, 13.3% for AGIs $10k-25k, 12.6% for AGIs $25k-50k, 16.8% for AGIs $50k-75k, 18.3% for AGIs $75k-100k, 14.7% for AGIs over 100k)
Charity contributions deductions: $1,953 (2% of AGI, reported on 38.5% of returns)
Here:
$1,953
State:
$3,295
Here:
2.3% of AGI
State:
2.7% of AGI
(% of AGI for various income ranges: 0.8% for AGIs below $10k, 1.1% for AGIs $10k-25k, 1.2% for AGIs $25k-50k, 1.5% for AGIs $50k-75k, 1.6% for AGIs $75k-100k, 1.7% for AGIs over 100k)
Total tax: $6,877 (reported on 81.8% of returns)
01960:
$6,877
State:
$11,494
(% of AGI for various income ranges: 3.3% for AGIs below $10k, 4.5% for AGIs $10k-25k, 8.1% for AGIs $25k-50k, 9.3% for AGIs $50k-75k, 10.1% for AGIs $75k-100k, 16.0% for AGIs over 100k)
Earned income credit: $1,451 (reported on 7.6% of returns)
Here:
$1,451
State:
$1,518
Percentage of individuals using paid preparers for their 2004 taxes: 62.5%
Here:
62%
State:
58%
(% for various income ranges: 52.3% for AGIs below $10k, 62.4% for AGIs $10k-25k, 62.4% for AGIs $25k-50k, 67.2% for AGIs $50k-75k, 67.5% for AGIs $75k-100k, 66.5% for AGIs over 100k)
Likely homosexual households (counted as self-reported same-sex unmarried-partner households)
Lesbian couples: 0.1% of all households
Gay men: 0.1% of all households
Household received Food Stamps/SNAP in the past 12 months: 2,755 Household did not receive Food Stamps/SNAP in the past 12 months: 20,131
Women who had a birth in the past 12 months: 828 (703 now married, 137 unmarried) Women who did not have a birth in the past 12 months: 9,721 (4,108 now married, 5,578 unmarried)
Housing units in zip code 01960 with a mortgage: 9,322 (1,445 second mortgage, 50 home equity loan, 1,331 both second mortgage and home equity loan) Houses without a mortgage: 536
Median monthly owner costs for units with a mortgage: $2,361 Median monthly owner costs for units without a mortgage: $785
Residents with income below the poverty level in 2022:
This zip code:
7.3%
Whole state:
10.4%
Residents with income below 50% of the poverty level in 2022:
This zip code:
3.3%
Whole state:
5.1%
Median number of rooms in houses and condos:
Here:
6.5
State:
6.5
Median number of rooms in apartments:
Here:
3.8
State:
4.0
Notable locations in this zip code not listed on our city pages
Notable locations in zip code 01960: Brooksby Farm (A), Salem Country Club (B), Proctors Station (C), Newhall Station (D), Kings Plaza (E), Atlantic Cataldo Ambulance Service (F), Peabody Fire Department Station 3 (G), Peabody Fire Department Station 7 (H), Peabody Fire Department Station 5 (I), Peabody Fire Department Station 4 (J), Peabody Fire Department Station 1 Headquarters (K), Higgins Middle School Library (L), Bishop Fenwick High School Library (M), Peabody Veterans Memorial High School Library (N). Display/hide their locations on the map
Churches in zip code 01960 include: Jubilee Christian Center (A), First United Methodist Church (B), First Unitarian Church (C), Calvary Baptist Church (D). Display/hide their locations on the map
Cemeteries: Oak Grove Cemetery (1), Ross Memorial Park (2), Temple Bethel Cemetery (3), Monumental Cemetery (4), Cedar Grove Cemetery (5), Maple Hill Cemetery (6), Chelsea Cemetery (7). Display/hide their locations on the map
Lakes and reservoirs: Bartholowmew Pond (A), Cedar Pond (B), Little Elder Pond (C), Meadow Pond (D), Pierces Pond (E), Sidneys Pond (F), Craig Pond (G), Crystal Pond (H). Display/hide their locations on the map
Streams, rivers, and creeks: Proctor Brook (A), Tapley Brook (B), Strongwater Brook (C), Flint Brook (D), Goldthwait Brook (E). Display/hide their locations on the map
6,853 married couples with children.
1,961 single-parent households (546 men, 1,415 women).
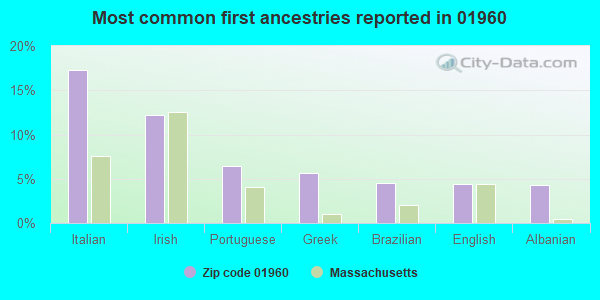
77.4% of residents of 01960 zip code speak English at home.
7.4% of residents speak Spanish at home (45% very well, 25% well, 11% not well, 19% not at all).
13.7% of residents speak other Indo-European language at home (59% very well, 20% well, 14% not well, 7% not at all).
1.3% of residents speak Asian or Pacific Island language at home (71% very well, 13% well, 14% not well, 3% not at all).
0.6% of residents speak other language at home (63% very well, 25% well, 12% not at all).
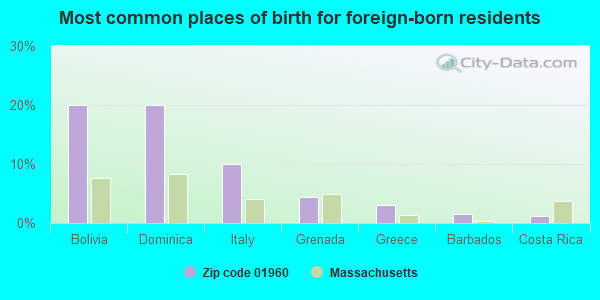
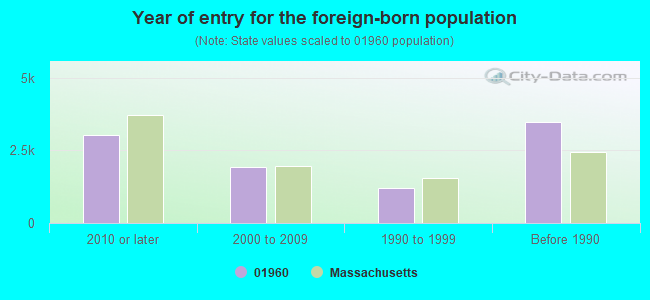
Foreign born population: 9,086 (16.8%) (62.3% of them are naturalized citizens)
Major facilities with environmental interests located in this zip code:
ALLIANCE LEATHER INC (58 PULASKI STREET in PEABODY, MA)
AIR MAJOR (AIRS/AFS) (Integrated Compliance Information System) - ICIS-01-2000-0241, FORMAL ENFORCEMENT ACTION, ENFORCEMENT/COMPLIANCE ACTIVITY CRITERIA AND HAZARDOUS AIR POLLUTANT INVENTORY (Inventory of air pollution sources) Small Quantity Generators, between 100 kg and 1000 kg of hazardous waste/month (Resource Conservation and Recovery Act (tracking hazardous waste)) - notification (Resource Conservation and Recovery Act (tracking hazardous waste)) TRI REPORTER (Tracking of toxic chemicals releasing facilities) Business SIC classification: LEATHER TANNING AND FINISHING Business NAICS classification: LEATHER AND HIDE TANNING AND FINISHING. Alternative names: S F E F CORP
EASTMAN GELATINE CORPORATION (227 WASHINGTON ST. in PEABODY, MA)
AIR MAJOR (AIRS/AFS) OIL CONTROL (Facility Response Plan for oil discharge) CRITERIA AND HAZARDOUS AIR POLLUTANT INVENTORY (Inventory of air pollution sources) National Pollutant Discharge Elimination System NON-MAJOR (Tracking pollutant discharge elimination systems) - permit - ICIS-, ENFORCEMENT/COMPLIANCE ACTIVITY Small Quantity Generators, between 100 kg and 1000 kg of hazardous waste/month (Resource Conservation and Recovery Act (tracking hazardous waste)) - notification TRI REPORTER (Tracking of toxic chemicals releasing facilities) Business SIC classification: CHEMICALS AND CHEMICAL PREPARATIONS Business NAICS classification: ALL OTHER MISCELLANEOUS CHEMICAL PRODUCT AND PREPARATION MANUFACTURING. Organizations: EASTMAN KODAK COMPANY (CONTACT/GENERAL)
, EASTMAN KODAK COMPANY (CONTACT/OWNER)
Alternative names: EASTMAN GELATIN CORP, EASTMAN GELATINE CORP.
NORTHEAST NURSERY INC (234 NEWBURY ST in PEABODY, MA)
AIR MINOR (AIRS/AFS) (Resource Conservation and Recovery Act (tracking hazardous waste)) Business NAICS classification: PLASTICS MATERIAL AND RESIN MANUFACTURING. Organizations: ALFRED TEO (CONTACT/OWNER)
, CHELSEA INDUSTRIES INC (CONTACT/OWNER)
Alternative names: MAYNARD PLASTICS CO
LIFOAM INDUSTRIES LLC (2 FIFTH STREET in PEABODY, MA)
AIR SYNTHETIC MINOR (AIRS/AFS) STATE MASTER (MA-EPICS) - NEI-1190294, AIR PROGRAM, RCRAINFO-MAV000020211, HAZARDOUS WASTE PROGRAM CRITERIA AND HAZARDOUS AIR POLLUTANT INVENTORY (Inventory of air pollution sources) Business SIC classification: PLASTICS FOAM PRODUCTS Alternative names: LIFE LIKE PACKING SO, LIFE LIKE PACKING SOLUTIONS INC, LIFE LIKE PACKING SOLUTIONS INC, LIFE LIKE PRODUCTS, TECH PAK INCORPORATED, TECHPAK SOLUTIONS INC
BARNET CORPORATION (58 PULASKI ROAD in PEABODY, MA)
AIR MINOR (AIRS/AFS) (Resource Conservation and Recovery Act (tracking hazardous waste)) Business SIC classification: LEATHER TANNING AND FINISHING
MONNIER SITE/PYBURN PROPERTY (60 PULASKI STREET in PEABODY, MA)
KING KALIPERS INC (58 PULASKI STREET in PEABODY, MA)
AIR MINOR (AIRS/AFS) CRITERIA AND HAZARDOUS AIR POLLUTANT INVENTORY (Inventory of air pollution sources) Conditionally Exempt Small Quantity Generators, less than 100 kg/month of hazardous waste (Resource Conservation and Recovery Act (tracking hazardous waste)) - notification Business SIC classification: MOTOR VEHICLE PARTS AND ACCESSORIES Organizations: JERRY LINDSEY (CONTACT/OWNER)
AGGREGATE INDUSTRIES NORTHEAST REGION (55 RUSSELL ST in PEABODY, MA)
AIR SYNTHETIC MINOR (AIRS/AFS) CRITERIA AND HAZARDOUS AIR POLLUTANT INVENTORY (Inventory of air pollution sources) (Resource Conservation and Recovery Act (tracking hazardous waste)) TRI REPORTER (Tracking of toxic chemicals releasing facilities) Business SIC classification: CRUSHED AND BROKEN STONE; CONSTRUCTION SAND AND GRAVEL; ASPHALT PAVING MIXTURES AND BLOCKS Business NAICS classification: ASPHALT PAVING MIXTURE AND BLOCK MANUFACTURING. Organizations: ESSEX BITUMINOUS CORP (CONTACT/OWNER)
Alternative names: AGGREGATE INDS. NORTHEAST REGION INC., BARDON TRIMOUNT INCORPORATED
KILEY BROS MEMORIAL (21 JOHNSON STREET in PEABODY, MA)
(National Center for Education Statistics) - STATE ID-229030 Organizations: PEABODY (SCHOOL DISTRICT)
ALPHA GRAPHICS FINISHING INCORPORATED (65 WALNUT ST in PEABODY, MA)
AIR MINOR (AIRS/AFS) CRITERIA AND HAZARDOUS AIR POLLUTANT INVENTORY (Inventory of air pollution sources) (Resource Conservation and Recovery Act (tracking hazardous waste)) Business SIC classification: SHEET METALWORK Organizations: ALPHA CRAPHICS FINISHING INC (CONTACT/OWNER)
Alternative names: BACKER LORING CORP
Housing units lacking complete plumbing facilities: 1.0% Housing units lacking complete kitchen facilities: 2.4%
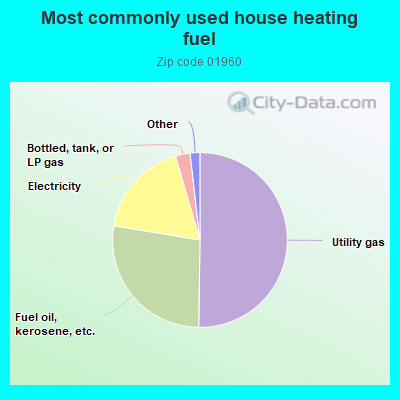
50.3%Utility gas
27.4%Fuel oil, kerosene, etc.
17.9%Electricity
2.7%Bottled, tank, or LP gas
0.9%No fuel used
0.6%Other fuel
Population in 1990: 47,685. Population change in the 1990s: +444 (+0.9%).
Place of birth for U.S.-born residents:
This state: 38,401
Northeast: 3,797
Midwest: 389
South: 869
West: 535
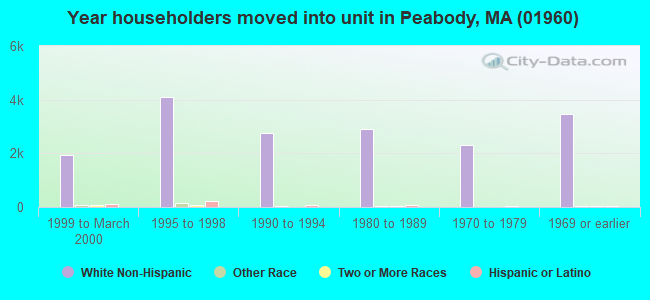
68% of the 01960 zip code residents lived in the same house 5 years ago. Out of people who lived in different houses, 76% lived in this county. Out of people who lived in different counties, 50% lived in Massachusetts.
89% of the 01960 zip code residents lived in the same house 1 year ago. Out of people who lived in different houses, 59% moved from this county. Out of people who lived in different houses, 22% moved from different county within same state. Out of people who lived in different houses, 11% moved from different state. Out of people who lived in different houses, 5% moved from abroad.
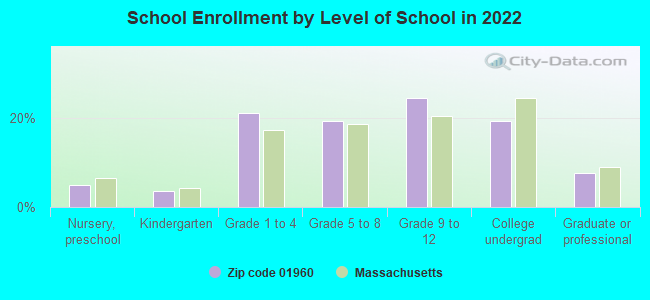
Private vs. public school enrollment:
Students in private schools in grades 1 to 8 (elementary and middle school): 305
Here:
7.9%
Massachusetts:
10.3%
Students in private schools in grades 9 to 12 (high school): 599
Here:
25.4%
Massachusetts:
12.3%
Students in private undergraduate colleges: 799
Here:
43.1%
Massachusetts:
51.2%
Occupation by median earnings in the past 12 months ($)
102,878Architecture and engineering occupations
91,561Management occupations
90,182Computer and mathematical occupations
86,837Law enforcement workers including supervisors
84,394Life, physical, and social science occupations
82,087Installation, maintenance, and repair occupations
Companies with biggest federal contracts located in this zip code (PEABODY, MA):
LIGHTHOUSE MANUFACTURING CO IN (2 CENTENNIAL DR; small business) : $2,633,433 in 21 contractsfrom 2001 to 2006
Contracts for Gas Turbines and Jet Engines, Aircraft; Prime Moving, and Components, Hardware, Commercial, Well Drilling/Exploratory Services, Hardware, Weapon System by Air Force, Defense Logistics Agency, Navy, Army, and others Signed by year:2000: $0; 2001: $265,439; 2002: $1,489,868; 2003: $0; 2004: $386,598; 2005: $392,526; 2006: $99,002.
Biggest contracts:
$1,223,163 with Air Force for Gas Turbines and Jet Engines, Aircraft; Prime Moving, and Components. Signed on 2002-07-23. Completion date: 2005-09-14.
$184,758 with Defense Logistics Agency for Gas Turbines and Jet Engines, Aircraft; Prime Moving, and Components. Signed on 2002-08-09. Completion date: 2002-10-08.
$184,758, same as above.Signed on 2001-06-13. Completion date: 2002-01-24.
$170,730, same as above.Signed on 2004-08-24. Completion date: 2004-10-23.
FEI COMPANY (1 CORPORATION WAY; small business) : $1,427,685 in 3 contractsfrom 2000 to 2006
$773,728 with Army for Other Defense -- Advanced Development (R&D). Signed on 2000-06-16. Completion date: 2003-06-01.
$681,215, same as above.Signed on 2000-07-21. Completion date: 2000-06-16.
-$27,258, same as above.Signed on 2006-06-07. Effective on 2006-06-01. Completion date: 2006-06-01.
TECHNICAL MANUFACTURING CORP (15 CENTENNIAL DR) : $1,048,986 in 52 contractsfrom 2000 to 2006
Contracts for Laboratory Equipment and Supplies, Electrical and Electronic Properties Measuring and Testing Instruments, Aircraft Maintenance and Repair Shop Specialized Equipment, Optical Instruments, Test Equipment, Components and Accessories, and moreby NASA, National Institute of Standards and Technology, Air Force, Navy, and others Signed by year:2000: $43,000; 2001: $56,000; 2002: $0; 2003: $13,740; 2004: $184,883; 2005: $594,954; 2006: $156,409.
Biggest contracts:
$218,700 with NASA for Laboratory Equipment and Supplies. Signed on 2005-09-16. Completion date: 2006-03-13.
$161,080 with NASA for Electrical and Electronic Properties Measuring and Testing Instruments. Taking place in MD. Signed on 2005-12-19. Completion date: 2006-01-06.
$124,580 with National Institute of Standards and Technology for Laboratory Equipment and Supplies. Signed on 2004-09-24. Completion date: 2006-01-15.
$84,965 with Air Force for Aircraft Maintenance and Repair Shop Specialized Equipment. Signed on 2005-08-24. Completion date: 2005-10-12.
SKY COMPUTERS, INC (8 CENTENNIAL DR) : $833,173 in 10 contractsfrom 1999 to 2005
Contracts for ADPE System Configuration, ADP Components, ADP Input/Output and Storage Devices, Miscellaneous Communication Equipment, and moreby Navy, Air Force, National Oceanic and Atmospheric Administration/Under Secretary for Oceans and Atmosphere, Federal Technology Service, and others Signed by year:2000: $483,744; 2001: $128,000; 2002: $0; 2003: $45,800; 2004: $59,540; 2005: $88,800; 2006: $0.
Biggest contracts:
$220,684 with Navy for ADPE System Configuration. Signed on 2000-01-07. Completion date: 2000-04-13.
$165,010 with Navy for ADP Components. Signed on 2000-09-29. Completion date: 2000-11-20.
$128,000, same as above.Signed on 2001-06-13. Completion date: 2001-08-14.
$98,050 with Navy for ADP Input/Output and Storage Devices. Signed on 2000-01-20. Completion date: 2000-05-31.
TRU CORPORATION (245 LYNNFIELD ST; small business) : $805,943 in 109 contractsfrom 2001 to 2006
Contracts for Connectors, Electrical, Rockets, Rocket Ammunition and Rocket Components, Wire and Cable, Electrical, Antennas, Waveguides, and Related Equipment, and moreby Defense Logistics Agency, Navy, Army Signed by year:2000: $0; 2001: $72,891; 2002: $171,970; 2003: $900; 2004: $139,655; 2005: $248,282; 2006: $172,245.
Biggest contracts:
$99,990 with Defense Logistics Agency for Connectors, Electrical. Signed on 2002-05-28. Completion date: 2002-08-26.
$71,980 with Navy for Rockets, Rocket Ammunition and Rocket Components. Signed on 2002-07-23. Completion date: 2002-09-06.
$67,850 with Navy for Wire and Cable, Electrical. Signed on 2006-05-23. Completion date: 2006-07-21.
$41,475 with Defense Logistics Agency for Connectors, Electrical. Signed on 2001-03-08. Completion date: 2004-03-08.
TRINICOMP SYSTEMS INC (2 CENTENNIAL DR STE 6D; small business) : $184,505 in 4 contractsin 2002
$60,705 with Navy for ADP Input/Output and Storage Devices. Signed on 2002-01-23. Completion date: 2002-02-15.
$51,175, same as above.Signed on 2002-05-02. Completion date: 2002-05-17.
$38,110, same as above.Signed on 2002-03-22. Completion date: 2002-04-05.
$34,515, same as above.Signed on 2002-07-18. Completion date: 2002-07-26.
HARMONID DRIVE TECHNOLOGIES NA (247)
$73,227 with Defense Logistics Agency for Miscellaneous Aircraft Accessories and Components. Signed on 2005-06-15. Completion date: 2005-11-02.
WALBAR, INC. (5 TH ST PEABODY INDUS PAR) : $54,852 in 2 contractsfrom 1999 to 2000
$27,434 with Navy for Gas Turbines and Jet Engines, Aircraft; Prime Moving, and Components. Signed on 1999-10-22. Completion date: 1999-12-17.
$27,418, same as above.Signed on 2000-04-07. Completion date: 2000-05-14.
ADHESIVE PACKAGING SPECIALTIES (103 FOSTER ST; small business) : $48,853 in 8 contractsfrom 2003 to 2006
Contracts for Adhesives, Miscellaneous Service and Trade Equipment, Miscellaneous Maintenance and Repair Shop Specialized Equipment by Defense Logistics Agency, Army Signed by year:2000: $0; 2001: $0; 2002: $0; 2003: $5,294; 2004: $8,088; 2005: $21,352; 2006: $14,119.
Biggest contracts:
$12,691 with Defense Logistics Agency for Adhesives. Signed on 2005-07-05. Completion date: 2005-07-24.
$10,602 with Army for Miscellaneous Service and Trade Equipment. Signed on 2006-03-22. Completion date: 2006-05-31.
$5,294, same as above.Signed on 2005-09-02. Completion date: 2005-11-07.
$5,294 with Army for Miscellaneous Maintenance and Repair Shop Specialized Equipment. Signed on 2003-10-14. Completion date: 2003-11-24.
PCG TRADING, LLC (4 TECHNOLOGY DR; small business) : $42,675 in 2 contractsin 2005
$38,675 with Navy for Relays and Solenoids. Signed on 2005-12-20. Completion date: 2005-12-30.
$4,000 with Navy for Electrical and Electronic Properties Measuring and Testing Instruments. Signed on 2005-11-18. Completion date: 2005-12-09.
Top industries in this zip code by the number of employees in 2005:
Administrative and Support and Waste Management and Remediation Services: Temporary Help Services (over 1000 employees: 1 establishment, 20-49 employees: 2 establishments)
Health Care and Social Assistance: Offices of Physicians (except Mental Health Specialists) (250-499: 1, 100-249: 1, 50-99: 2, 20-49: 1, 10-19: 5, 5-9: 6, 1-4: 14)
Health Care and Social Assistance: Other Residential Care Facilities (500-999: 1, 10-19: 1)
Professional, Scientific, and Technical Services: Offices of Lawyers (250-499: 1, 50-99: 1, 10-19: 3, 5-9: 6, 1-4: 18)
Health Care and Social Assistance: General Medical and Surgical Hospitals (250-499: 1, 100-249: 1)
People in group quarters in 2010:
389 people in nursing facilities/skilled-nursing facilities
67 people in emergency and transitional shelters (with sleeping facilities) for people experiencing homelessness
20 people in group homes intended for adults
20 people in other noninstitutional facilities
16 people in residential treatment centers for adults
8 people in group homes for juveniles (non-correctional)
People in group quarters in 2000:
524 people in nursing homes
58 people in other noninstitutional group quarters
34 people in homes for the mentally retarded
29 people in other group homes
28 people in homes for the mentally ill
20 people in homes for the physically handicapped
16 people in religious group quarters
11 people in residential treatment centers for emotionally disturbed children
Fatal accident statistics in 2014:
Fatal accident count: 1
Vehicles involved in fatal accidents: 1
Fatal accidents caused by drunken drivers: 0
Fatalities: 1
Persons involved in fatal accidents: 1
Pedestrians involved in fatal accidents: 1
Fatal accident statistics in 2013:
Fatal accident count: 2
Vehicles involved in fatal accidents: 3
Fatal accidents caused by drunken drivers: 1
Fatalities: 2
Persons involved in fatal accidents: 4
Pedestrians involved in fatal accidents: 1
Home Mortgage Disclosure Act Aggregated Statistics For Year 2009 (Based on 18 full tracts)
A) FHA, FSA/RHS & VA Home Purchase Loans
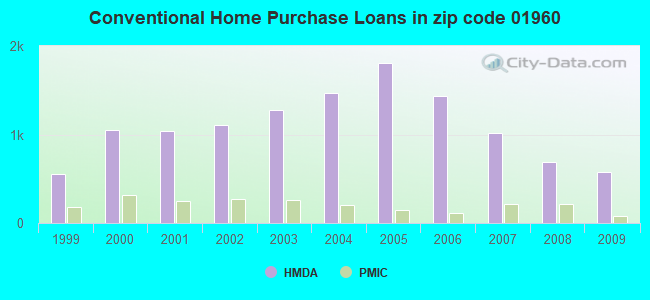
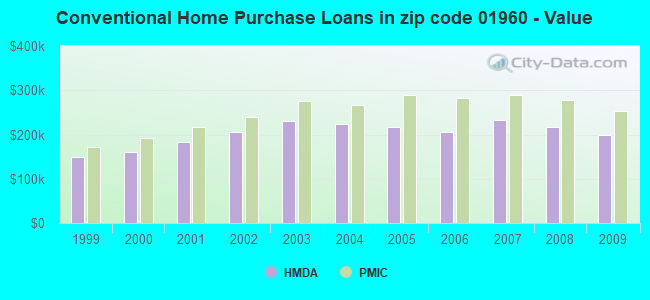
B) Conventional Home Purchase Loans
C) Refinancings
D) Home Improvement Loans
E) Loans on Dwellings For 5+ Families
F) Non-occupant Loans on < 5 Family Dwellings (A B C & D)
G) Loans On Manufactured Home Dwelling (A B C & D)
Number
Average Value
Number
Average Value
Number
Average Value
Number
Average Value
Number
Average Value
Number
Average Value
Number
Average Value
LOANS ORIGINATED
344
$279,397
573
$199,858
2,871
$236,188
141
$142,770
8
$527,232
113
$198,930
16
$45,062
APPLICATIONS APPROVED, NOT ACCEPTED
14
$311,496
46
$161,033
175
$263,930
24
$21,803
0
$0
6
$108,007
6
$55,417
APPLICATIONS DENIED
44
$255,331
84
$167,766
605
$265,830
62
$78,174
0
$0
28
$171,910
20
$66,346
APPLICATIONS WITHDRAWN
42
$263,901
62
$214,096
452
$246,262
12
$196,726
0
$0
14
$234,355
0
$0
FILES CLOSED FOR INCOMPLETENESS
12
$250,690
16
$192,756
101
$243,277
6
$190,518
0
$0
8
$201,664
0
$0
Aggregated Statistics For Year 2008 (Based on 18 full tracts)
A) FHA, FSA/RHS & VA Home Purchase Loans
B) Conventional Home Purchase Loans
C) Refinancings
D) Home Improvement Loans
E) Loans on Dwellings For 5+ Families
F) Non-occupant Loans on < 5 Family Dwellings (A B C & D)
G) Loans On Manufactured Home Dwelling (A B C & D)
Number
Average Value
Number
Average Value
Number
Average Value
Number
Average Value
Number
Average Value
Number
Average Value
Number
Average Value
LOANS ORIGINATED
169
$279,290
692
$217,392
1,349
$247,392
171
$96,886
10
$1,601,254
171
$236,462
44
$61,619
APPLICATIONS APPROVED, NOT ACCEPTED
10
$272,155
113
$211,617
175
$251,726
38
$78,505
0
$0
34
$175,397
6
$99,603
APPLICATIONS DENIED
38
$287,112
113
$199,516
603
$267,134
108
$63,434
2
$532,925
34
$191,815
26
$38,612
APPLICATIONS WITHDRAWN
22
$301,200
123
$196,633
263
$268,856
20
$210,776
2
$620,380
8
$174,190
4
$116,655
FILES CLOSED FOR INCOMPLETENESS
0
$0
22
$191,271
42
$234,013
4
$161,575
0
$0
4
$175,902
2
$125,635
Aggregated Statistics For Year 2007 (Based on 18 full tracts)
A) FHA, FSA/RHS & VA Home Purchase Loans
B) Conventional Home Purchase Loans
C) Refinancings
D) Home Improvement Loans
E) Loans on Dwellings For 5+ Families
F) Non-occupant Loans on < 5 Family Dwellings (A B C & D)
G) Loans On Manufactured Home Dwelling (A B C & D)
Number
Average Value
Number
Average Value
Number
Average Value
Number
Average Value
Number
Average Value
Number
Average Value
Number
Average Value
LOANS ORIGINATED
30
$307,329
1,017
$232,177
1,690
$231,466
328
$104,711
22
$1,051,839
109
$224,877
32
$57,896
APPLICATIONS APPROVED, NOT ACCEPTED
4
$257,175
111
$236,726
306
$237,193
54
$70,271
0
$0
20
$181,022
10
$39,854
APPLICATIONS DENIED
8
$262,304
159
$209,579
991
$243,593
159
$91,456
4
$604,395
36
$246,191
10
$57,765
APPLICATIONS WITHDRAWN
12
$293,088
78
$226,734
412
$235,838
44
$105,684
2
$574,425
24
$184,974
4
$74,660
FILES CLOSED FOR INCOMPLETENESS
0
$0
44
$264,610
169
$281,767
2
$29,815
0
$0
10
$308,917
4
$89,595
Aggregated Statistics For Year 2006 (Based on 18 full tracts)
A) FHA, FSA/RHS & VA Home Purchase Loans
B) Conventional Home Purchase Loans
C) Refinancings
D) Home Improvement Loans
E) Loans on Dwellings For 5+ Families
F) Non-occupant Loans on < 5 Family Dwellings (A B C & D)
G) Loans On Manufactured Home Dwelling (A B C & D)
Number
Average Value
Number
Average Value
Number
Average Value
Number
Average Value
Number
Average Value
Number
Average Value
Number
Average Value
LOANS ORIGINATED
12
$326,117
1,432
$206,688
2,320
$215,068
468
$81,048
18
$882,332
161
$223,669
38
$50,499
APPLICATIONS APPROVED, NOT ACCEPTED
0
$0
147
$198,960
306
$217,790
62
$78,173
2
$895,950
36
$227,193
12
$34,869
APPLICATIONS DENIED
0
$0
257
$212,050
1,158
$239,769
223
$90,227
0
$0
48
$250,820
22
$88,687
APPLICATIONS WITHDRAWN
2
$173,825
185
$239,376
754
$254,409
54
$122,105
0
$0
20
$230,314
4
$47,420
FILES CLOSED FOR INCOMPLETENESS
0
$0
38
$177,219
169
$291,950
16
$72,542
0
$0
8
$232,039
2
$34,900
Aggregated Statistics For Year 2005 (Based on 18 full tracts)
A) FHA, FSA/RHS & VA Home Purchase Loans
B) Conventional Home Purchase Loans
C) Refinancings
D) Home Improvement Loans
E) Loans on Dwellings For 5+ Families
F) Non-occupant Loans on < 5 Family Dwellings (A B C & D)
G) Loans On Manufactured Home Dwelling (A B C & D)
Number
Average Value
Number
Average Value
Number
Average Value
Number
Average Value
Number
Average Value
Number
Average Value
Number
Average Value
LOANS ORIGINATED
12
$272,982
1,809
$217,804
2,730
$232,291
442
$112,639
24
$650,442
201
$225,410
46
$54,389
APPLICATIONS APPROVED, NOT ACCEPTED
2
$262,515
155
$190,662
261
$240,295
62
$78,698
0
$0
6
$135,088
12
$54,572
APPLICATIONS DENIED
2
$364,760
328
$189,304
949
$257,657
159
$75,612
6
$1,632,698
46
$218,517
32
$82,610
APPLICATIONS WITHDRAWN
0
$0
229
$216,420
834
$234,826
78
$177,078
2
$571,380
50
$208,573
10
$83,007
FILES CLOSED FOR INCOMPLETENESS
0
$0
70
$186,020
358
$283,524
6
$51,583
0
$0
8
$194,768
0
$0
Aggregated Statistics For Year 2004 (Based on 18 full tracts)
A) FHA, FSA/RHS & VA Home Purchase Loans
B) Conventional Home Purchase Loans
C) Refinancings
D) Home Improvement Loans
E) Loans on Dwellings For 5+ Families
F) Non-occupant Loans on < 5 Family Dwellings (A B C & D)
G) Loans On Manufactured Home Dwelling (A B C & D)
Number
Average Value
Number
Average Value
Number
Average Value
Number
Average Value
Number
Average Value
Number
Average Value
Number
Average Value
LOANS ORIGINATED
28
$288,113
1,468
$222,843
3,248
$218,391
376
$123,176
18
$782,356
169
$210,692
62
$62,976
APPLICATIONS APPROVED, NOT ACCEPTED
0
$0
103
$210,153
370
$218,295
74
$72,590
0
$0
16
$166,502
8
$33,904
APPLICATIONS DENIED
8
$280,456
229
$205,155
712
$229,311
191
$74,914
2
$356,525
36
$185,906
48
$62,989
APPLICATIONS WITHDRAWN
4
$350,530
121
$232,414
796
$229,087
78
$142,146
2
$50,950
16
$221,798
4
$62,718
FILES CLOSED FOR INCOMPLETENESS
4
$381,885
40
$239,110
470
$240,342
28
$125,779
2
$359,640
10
$300,296
8
$85,456
Aggregated Statistics For Year 2003 (Based on 18 full tracts)
A) FHA, FSA/RHS & VA Home Purchase Loans
B) Conventional Home Purchase Loans
C) Refinancings
D) Home Improvement Loans
E) Loans on Dwellings For 5+ Families
F) Non-occupant Loans on < 5 Family Dwellings (A B C & D)
Number
Average Value
Number
Average Value
Number
Average Value
Number
Average Value
Number
Average Value
Number
Average Value
LOANS ORIGINATED
34
$255,461
1,272
$229,861
8,171
$185,179
149
$59,910
16
$517,247
304
$195,395
APPLICATIONS APPROVED, NOT ACCEPTED
0
$0
115
$221,481
760
$186,945
50
$65,755
0
$0
24
$215,065
APPLICATIONS DENIED
14
$237,326
169
$182,099
1,148
$205,035
123
$67,768
0
$0
50
$217,122
APPLICATIONS WITHDRAWN
6
$294,863
123
$214,250
887
$206,785
48
$52,647
2
$835,905
40
$203,444
FILES CLOSED FOR INCOMPLETENESS
2
$219,475
10
$247,375
139
$210,027
6
$46,502
0
$0
2
$148,035
Aggregated Statistics For Year 2002 (Based on 18 full tracts)
A) FHA, FSA/RHS & VA Home Purchase Loans
B) Conventional Home Purchase Loans
C) Refinancings
D) Home Improvement Loans
E) Loans on Dwellings For 5+ Families
F) Non-occupant Loans on < 5 Family Dwellings (A B C & D)
Number
Average Value
Number
Average Value
Number
Average Value
Number
Average Value
Number
Average Value
Number
Average Value
LOANS ORIGINATED
58
$215,015
1,107
$205,725
5,524
$174,949
295
$57,405
16
$330,556
183
$179,741
APPLICATIONS APPROVED, NOT ACCEPTED
4
$229,948
110
$177,878
482
$166,631
88
$50,632
2
$261,530
10
$132,828
APPLICATIONS DENIED
10
$188,976
145
$170,229
571
$175,071
103
$41,346
0
$0
26
$199,304
APPLICATIONS WITHDRAWN
8
$253,186
111
$198,233
597
$175,037
50
$55,609
0
$0
24
$166,159
FILES CLOSED FOR INCOMPLETENESS
0
$0
2
$150,560
151
$193,448
4
$92,162
0
$0
4
$223,362
Aggregated Statistics For Year 2001 (Based on 18 full tracts)
A) FHA, FSA/RHS & VA Home Purchase Loans
B) Conventional Home Purchase Loans
C) Refinancings
D) Home Improvement Loans
E) Loans on Dwellings For 5+ Families
F) Non-occupant Loans on < 5 Family Dwellings (A B C & D)
Number
Average Value
Number
Average Value
Number
Average Value
Number
Average Value
Number
Average Value
Number
Average Value
LOANS ORIGINATED
107
$215,376
1,035
$182,754
4,435
$168,606
279
$39,899
20
$431,798
139
$156,934
APPLICATIONS APPROVED, NOT ACCEPTED
8
$218,405
76
$160,652
448
$142,049
88
$46,791
0
$0
28
$141,182
APPLICATIONS DENIED
16
$264,755
133
$110,156
579
$156,959
137
$30,884
0
$0
18
$177,011
APPLICATIONS WITHDRAWN
10
$204,193
92
$167,850
553
$156,006
66
$43,731
4
$637,395
18
$190,869
FILES CLOSED FOR INCOMPLETENESS
0
$0
8
$118,258
88
$160,289
28
$35,429
0
$0
2
$161,850
Aggregated Statistics For Year 2000 (Based on 18 full tracts)
A) FHA, FSA/RHS & VA Home Purchase Loans
B) Conventional Home Purchase Loans
C) Refinancings
D) Home Improvement Loans
E) Loans on Dwellings For 5+ Families
F) Non-occupant Loans on < 5 Family Dwellings (A B C & D)
Number
Average Value
Number
Average Value
Number
Average Value
Number
Average Value
Number
Average Value
Number
Average Value
LOANS ORIGINATED
70
$173,588
1,049
$160,514
1,073
$127,034
239
$36,063
6
$336,547
99
$137,317
APPLICATIONS APPROVED, NOT ACCEPTED
2
$163,835
114
$122,122
167
$112,739
90
$28,432
0
$0
16
$155,522
APPLICATIONS DENIED
8
$198,752
189
$134,028
350
$109,611
145
$36,379
0
$0
12
$156,530
APPLICATIONS WITHDRAWN
10
$188,990
102
$167,622
328
$94,215
38
$30,451
2
$283,205
12
$211,743
FILES CLOSED FOR INCOMPLETENESS
6
$152,642
14
$160,691
108
$142,508
6
$97,908
0
$0
2
$125,230
Aggregated Statistics For Year 1999 (Based on 9 full tracts)
A) FHA, FSA/RHS & VA Home Purchase Loans
B) Conventional Home Purchase Loans
C) Refinancings
D) Home Improvement Loans
E) Loans on Dwellings For 5+ Families
F) Non-occupant Loans on < 5 Family Dwellings (A B C & D)
2002 - 2018 National Fire Incident Reporting System (NFIRS) incidents
According to the data from the years 2002 - 2018 the average number of fires per year is 177. The highest number of reported fires - 293 took place in 2004, and the least - 55 in 2016. The data has an increasing trend.
When looking into fire subcategories, the most incidents belonged to: Structure Fires (45.0%), and Outside Fires (38.0%).
Fire incident types reported to NFIRS in Zip Code 01960


 Nearest zip codes: 01904, 01923, 01937, 01905, 01940, 01902.


 According to the data from the years 2002 - 2018 the average number of fires per year is 177. The highest number of reported fires - 293 took place in 2004, and the least - 55 in 2016. The data has an increasing trend.
 When looking into fire subcategories, the most incidents belonged to: Structure Fires (45.0%), and Outside Fires (38.0%).