Estimated zip code population in 2022: 26,977 Zip code population in 2010: 25,251 Zip code population in 2000: 23,573
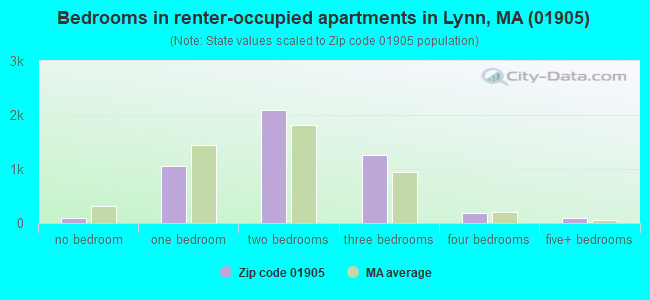
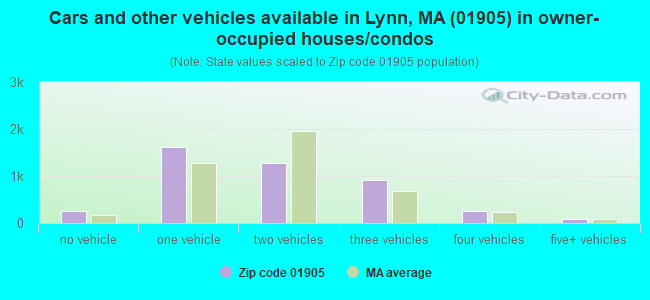
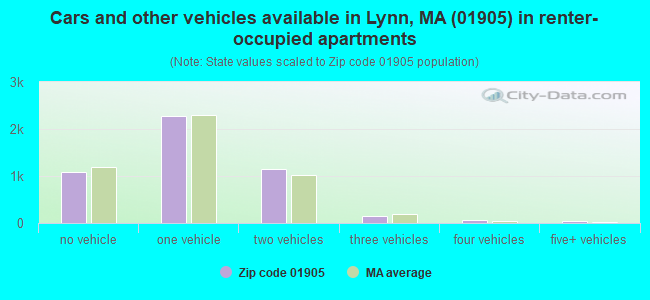
Houses and condos: 9,565 Renter-occupied apartments: 4,767
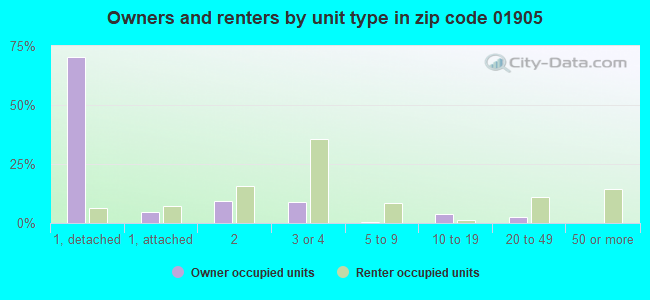
% of renters here:
52%
State:
38%
March 2022 cost of living index in zip code 01905: 134.9 (high, U.S. average is 100)
Land area: 3.6 sq. mi. Water area: 0.5 sq. mi.
Population density: 7,579 people per square mile
(high).
OSM Map
Google Map
MSN Map
OSM Map
General Map
Google Map
MSN Map
OSM Map
Google Map
MSN Map
OSM Map
Google Map
MSN Map
Please wait while loading the map...
Real estate property taxes paid for housing units in 2022:
This zip code:
1.0% ($4,649)
Massachusetts:
1.0% ($5,536)
Median real estate property taxes paid for housing units with mortgages in 2022: $4,506 (1.0%) Median real estate property taxes paid for housing units with no mortgage in 2022: $5,010 (1.0%)
Averages for the 2020 tax year for zip code 01905, filed in 2021:
Average Adjusted Gross Income (AGI) in 2020: $47,022 (Individual Income Tax Returns)
Here:
$47,022
State:
$105,130
Salary/wage: $42,440 (reported on 85.3% of returns)
Here:
$42,440
State:
$82,951
(% of AGI for various income ranges: 1201.8% for AGIs below $25k, 3435.0% for AGIs $25k-50k, 6643.8% for AGIs $50k-75k, 9687.6% for AGIs $75k-100k, 16692.7% for AGIs $100k-200k, 60277.5% for AGIs over 200k)
Taxable interest for individuals: $435 (reported on 18.9% of returns)
This zip code:
$435
Massachusetts:
$2,361
(% of AGI for various income ranges: 6.7% for AGIs below $25k, 4.0% for AGIs $25k-50k, 11.4% for AGIs $50k-75k, 23.9% for AGIs $75k-100k, 35.6% for AGIs $100k-200k, 290.0% for AGIs over 200k)
Ordinary dividends: $1,985 (reported on 6.6% of returns)
Here:
$1,985
State:
$10,365
(% of AGI for various income ranges: 3.5% for AGIs below $25k, 4.8% for AGIs $25k-50k, 14.1% for AGIs $50k-75k, 43.8% for AGIs $75k-100k, 76.8% for AGIs $100k-200k, 882.5% for AGIs over 200k)
Net capital gain/loss in AGI: +$12,224 (reported on 6.2% of returns)
Here:
+$12,224
State:
+$48,178
(% of AGI for various income ranges: 8.9% for AGIs $25k-50k, 17.1% for AGIs $50k-75k, 49.7% for AGIs $75k-100k, 320.5% for AGIs $100k-200k, 18175.0% for AGIs over 200k)
Profit/loss from business: +$7,729 (reported on 16.0% of returns)
Here:
+$7,729
State:
+$20,792
(% of AGI for various income ranges: 159.2% for AGIs below $25k, 146.5% for AGIs $25k-50k, 172.7% for AGIs $50k-75k, 204.9% for AGIs $75k-100k, 246.7% for AGIs $100k-200k)
Taxable individual retirement arrangement distribution: $13,400 (reported on 3.1% of returns)
01905:
$13,400
Massachusetts:
$22,790
(% of AGI for various income ranges: 16.3% for AGIs below $25k, 22.7% for AGIs $25k-50k, 46.4% for AGIs $50k-75k, 125.0% for AGIs $75k-100k, 343.2% for AGIs $100k-200k)
Total itemized deductions: $24,948 (reported on 6.8% of returns)
Here:
$24,948
State:
$36,722
(% of AGI for various income ranges: 26.2% for AGIs below $25k, 94.7% for AGIs $25k-50k, 313.9% for AGIs $50k-75k, 628.6% for AGIs $75k-100k, 818.1% for AGIs $100k-200k, 6652.5% for AGIs over 200k)
Charity contributions: $3,833 (reported on 4.4% of returns)
Here:
$3,833
State:
$12,529
(% of AGI for various income ranges: 1.6% for AGIs below $25k, 5.3% for AGIs $25k-50k, 27.2% for AGIs $50k-75k, 66.7% for AGIs $75k-100k, 109.0% for AGIs $100k-200k, 645.0% for AGIs over 200k)
Taxes paid: $7,848 (reported on 6.7% of returns)
01905:
$7,848
State:
$8,782
(% of AGI for various income ranges: 7.8% for AGIs below $25k, 26.8% for AGIs $25k-50k, 110.2% for AGIs $50k-75k, 223.5% for AGIs $75k-100k, 265.1% for AGIs $100k-200k, 1030.0% for AGIs over 200k)
Earned income credit: $2,254 (reported on 19.9% of returns)
Here:
$2,254
State:
$1,909
(% of AGI for various income ranges: 99.7% for AGIs below $25k, 77.3% for AGIs $25k-50k, 0.9% for AGIs $50k-75k)
Percentage of individuals using paid preparers for their 2020 taxes: 92.5%
Here:
93%
State:
92%
(% for various income ranges: 89.3% for AGIs below $25k, 93.5% for AGIs $25k-50k, 94.9% for AGIs $50k-75k, 94.3% for AGIs $75k-100k, 94.9% for AGIs $100k-200k, 100.0% for AGIs over 200k)
Averages for the 2012 tax year for zip code 01905, filed in 2013:
Average Adjusted Gross Income (AGI) in 2012: $37,897 (Individual Income Tax Returns)
Here:
$37,897
State:
$81,425
Salary/wage: $36,142 (reported on 89.2% of returns)
Here:
$36,142
State:
$64,752
(% of AGI for various income ranges: 80.8% for AGIs below $25k, 88.4% for AGIs $25k-50k, 85.6% for AGIs $50k-75k, 87.1% for AGIs $75k-100k, 84.5% for AGIs $100k-200k, 61.8% for AGIs over 200k)
Taxable interest for individuals: $490 (reported on 20.7% of returns)
This zip code:
$490
Massachusetts:
$2,136
(% of AGI for various income ranges: 0.3% for AGIs below $25k, 0.3% for AGIs $25k-50k, 0.3% for AGIs $50k-75k, 0.2% for AGIs $75k-100k, 0.2% for AGIs $100k-200k, 0.8% for AGIs over 200k)
Ordinary dividends: $1,799 (reported on 7.8% of returns)
Here:
$1,799
State:
$9,473
(% of AGI for various income ranges: 0.4% for AGIs below $25k, 0.3% for AGIs $25k-50k, 0.4% for AGIs $50k-75k, 0.3% for AGIs $75k-100k, 0.6% for AGIs $100k-200k)
Net capital gain/loss in AGI: +$2,064 (reported on 4.5% of returns)
Here:
+$2,064
State:
+$31,437
(% of AGI for various income ranges: 0.3% for AGIs $75k-100k, 1.0% for AGIs $100k-200k)
Profit/loss from business: +$9,271 (reported on 10.2% of returns)
Here:
+$9,271
State:
+$20,662
(% of AGI for various income ranges: 8.3% for AGIs below $25k, 2.3% for AGIs $25k-50k, 1.7% for AGIs $50k-75k, 0.8% for AGIs $75k-100k, 0.7% for AGIs $100k-200k)
Taxable individual retirement arrangement distribution: $11,692 (reported on 4.2% of returns)
01905:
$11,692
Massachusetts:
$18,892
(% of AGI for various income ranges: 1.3% for AGIs below $25k, 0.8% for AGIs $25k-50k, 1.4% for AGIs $50k-75k, 1.4% for AGIs $75k-100k, 2.0% for AGIs $100k-200k)
Total itemized deductions: $17,575 (25% of AGI, reported on 24.8% of returns)
Here:
$17,575
State:
$28,907
Here:
24.6% of AGI
State:
18.2% of AGI
(% of AGI for various income ranges: 5.9% for AGIs below $25k, 8.5% for AGIs $25k-50k, 13.5% for AGIs $50k-75k, 14.3% for AGIs $75k-100k, 15.2% for AGIs $100k-200k, 15.4% for AGIs over 200k)
Charity contributions: $1,700 (reported on 18.6% of returns)
Here:
$1,700
State:
$4,208
(% of AGI for various income ranges: 0.3% for AGIs below $25k, 0.6% for AGIs $25k-50k, 0.8% for AGIs $50k-75k, 1.0% for AGIs $75k-100k, 1.3% for AGIs $100k-200k, 1.3% for AGIs over 200k)
Taxes paid: $6,510 (reported on 24.8% of returns)
01905:
$6,510
State:
$13,303
(% of AGI for various income ranges: 1.3% for AGIs below $25k, 2.7% for AGIs $25k-50k, 4.8% for AGIs $50k-75k, 5.9% for AGIs $75k-100k, 6.7% for AGIs $100k-200k, 6.7% for AGIs over 200k)
Earned income credit: $2,323 (reported on 25.1% of returns)
Here:
$2,323
State:
$1,971
(% of AGI for various income ranges: 8.0% for AGIs below $25k, 1.3% for AGIs $25k-50k)
Percentage of individuals using paid preparers for their 2012 taxes: 64.0%
Here:
64%
State:
56%
(% for various income ranges: 63.5% for AGIs below $25k, 63.6% for AGIs $25k-50k, 65.1% for AGIs $50k-75k, 67.6% for AGIs $75k-100k, 63.2% for AGIs $100k-200k, 75.0% for AGIs over 200k)
Averages for the 2004 tax year for zip code 01905, filed in 2005:
Average Adjusted Gross Income (AGI) in 2004: $34,288 (Individual Income Tax Returns)
Here:
$34,288
State:
$62,877
Salary/wage: $33,381 (reported on 88.7% of returns)
Here:
$33,381
State:
$52,969
(% of AGI for various income ranges: 97.5% for AGIs below $10k, 81.9% for AGIs $10k-25k, 89.4% for AGIs $25k-50k, 88.7% for AGIs $50k-75k, 89.6% for AGIs $75k-100k, 75.5% for AGIs over 100k)
Taxable interest for individuals: $789 (reported on 37.8% of returns)
This zip code:
$789
Massachusetts:
$1,945
(% of AGI for various income ranges: 2.2% for AGIs below $10k, 1.4% for AGIs $10k-25k, 0.7% for AGIs $25k-50k, 0.8% for AGIs $50k-75k, 0.5% for AGIs $75k-100k, 1.1% for AGIs over 100k)
Taxable dividends: $1,627 (reported on 12.2% of returns)
Here:
$1,627
State:
$5,323
(% of AGI for various income ranges: 1.0% for AGIs below $10k, 0.6% for AGIs $10k-25k, 0.5% for AGIs $25k-50k, 0.5% for AGIs $50k-75k, 0.5% for AGIs $75k-100k, 0.8% for AGIs over 100k)
Net capital gain/loss: +$5,675 (reported on 7.9% of returns)
Here:
+$5,675
State:
+$20,377
(% of AGI for various income ranges: -0.5% for AGIs below $10k, 0.2% for AGIs $10k-25k, 0.2% for AGIs $25k-50k, 0.7% for AGIs $50k-75k, 0.7% for AGIs $75k-100k, 6.8% for AGIs over 100k)
Profit/loss from business: +$6,895 (reported on 10.5% of returns)
Here:
+$6,895
State:
+$17,837
(% of AGI for various income ranges: 10.1% for AGIs below $10k, 6.2% for AGIs $10k-25k, 1.4% for AGIs $25k-50k, 1.4% for AGIs $50k-75k, 0.6% for AGIs $75k-100k, 0.6% for AGIs over 100k)
IRA payment deduction: $2,764 (reported on 1.3% of returns)
01905:
$2,764
Massachusetts:
$3,100
(% of AGI for various income ranges: 0.1% for AGIs $10k-25k, 0.2% for AGIs $25k-50k, 0.1% for AGIs $50k-75k, 0.1% for AGIs $75k-100k)
Total itemized deductions: $15,946 (26% of AGI, reported on 29.2% of returns)
Here:
$15,946
State:
$22,573
Here:
26.4% of AGI
State:
19.5% of AGI
(% of AGI for various income ranges: 9.5% for AGIs below $10k, 7.8% for AGIs $10k-25k, 12.6% for AGIs $25k-50k, 16.4% for AGIs $50k-75k, 16.3% for AGIs $75k-100k, 14.9% for AGIs over 100k)
Charity contributions deductions: $1,867 (3% of AGI, reported on 25.0% of returns)
Here:
$1,867
State:
$3,295
Here:
2.9% of AGI
State:
2.7% of AGI
(% of AGI for various income ranges: 0.3% for AGIs below $10k, 0.7% for AGIs $10k-25k, 1.1% for AGIs $25k-50k, 1.5% for AGIs $50k-75k, 1.4% for AGIs $75k-100k, 2.4% for AGIs over 100k)
Total tax: $4,051 (reported on 72.0% of returns)
01905:
$4,051
State:
$11,494
(% of AGI for various income ranges: 3.0% for AGIs below $10k, 3.9% for AGIs $10k-25k, 6.6% for AGIs $25k-50k, 8.8% for AGIs $50k-75k, 10.6% for AGIs $75k-100k, 15.7% for AGIs over 100k)
Earned income credit: $1,809 (reported on 21.2% of returns)
Here:
$1,809
State:
$1,518
Percentage of individuals using paid preparers for their 2004 taxes: 65.0%
Here:
65%
State:
58%
(% for various income ranges: 59.1% for AGIs below $10k, 67.8% for AGIs $10k-25k, 63.5% for AGIs $25k-50k, 70.7% for AGIs $50k-75k, 66.2% for AGIs $75k-100k, 64.7% for AGIs over 100k)
Likely homosexual households (counted as self-reported same-sex unmarried-partner households)
Lesbian couples: 0.0% of all households
Gay men: 0.3% of all households
Household received Food Stamps/SNAP in the past 12 months: 2,969 Household did not receive Food Stamps/SNAP in the past 12 months: 6,471
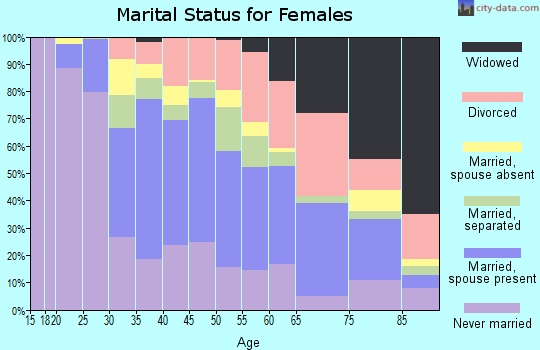
Women who had a birth in the past 12 months: 264 (193 now married, 69 unmarried) Women who did not have a birth in the past 12 months: 6,465 (2,174 now married, 4,303 unmarried)
Housing units in zip code 01905 with a mortgage: 3,338 (339 second mortgage, 211 both second mortgage and home equity loan) Houses without a mortgage: 264
Median monthly owner costs for units with a mortgage: $2,266 Median monthly owner costs for units without a mortgage: $926
Residents with income below the poverty level in 2022:
This zip code:
13.9%
Whole state:
10.4%
Residents with income below 50% of the poverty level in 2022:
This zip code:
7.3%
Whole state:
5.1%
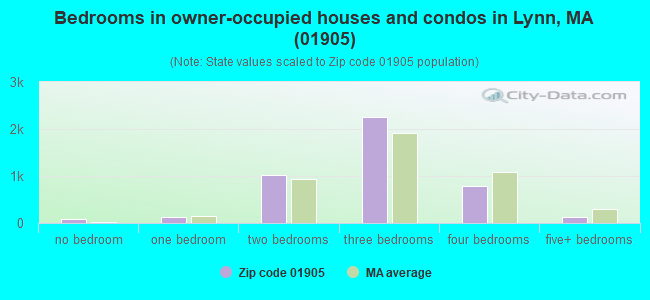
Median number of rooms in houses and condos:
Here:
5.9
State:
6.5
Median number of rooms in apartments:
Here:
4.3
State:
4.0
Notable locations in this zip code not listed on our city pages
Notable locations in zip code 01905: River Works Station (A), Lynn Fire Department Tower Hill Station (B), Lynn Fire Department Headquarters (C), Hartnett Library (D), Drewicz School Library (E), Lynn Classical High School Library (F). Display/hide their locations on the map
Churches in zip code 01905 include: Lynn Cambodian Baptist Church (A), First Baptist Church of Lynn (B), Bethlehem Temple Pentecostal Church (C), Austin Square Cambodian Baptist Church (D), Austin Square Baptist Church (E). Display/hide their locations on the map
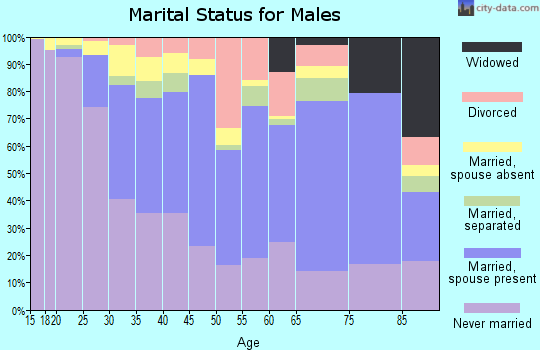
2,920 married couples with children.
2,559 single-parent households (561 men, 1,998 women).
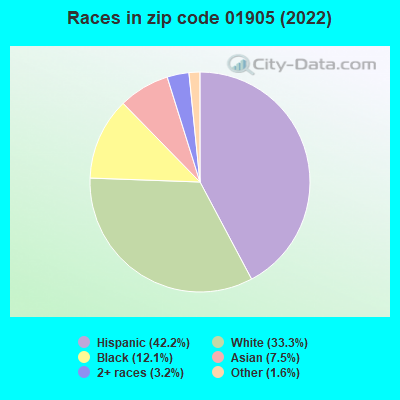
48.5% of residents of 01905 zip code speak English at home.
35.8% of residents speak Spanish at home (44% very well, 24% well, 21% not well, 10% not at all).
7.2% of residents speak other Indo-European language at home (47% very well, 26% well, 20% not well, 8% not at all).
5.9% of residents speak Asian or Pacific Island language at home (41% very well, 27% well, 28% not well, 4% not at all).
3.1% of residents speak other language at home (91% very well, 7% well, 2% not well).
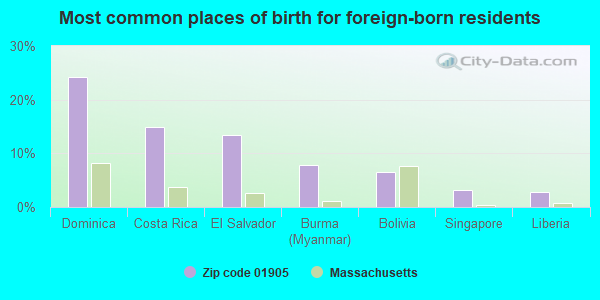
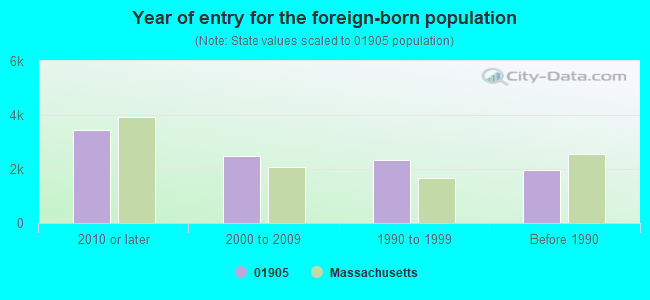
Foreign born population: 9,625 (35.7%) (51.6% of them are naturalized citizens)
Major facilities with environmental interests located in this zip code:
LYNN VOCATIONAL TECHNICAL INSTITUTE (80 NEPTUNE BLVD in LYNN, MA)
AIR MINOR (AIRS/AFS) STATE MASTER (MA-EPICS) - NEI-1191686, AIR PROGRAM (National Center for Education Statistics) - STATE ID-163605 CRITERIA AND HAZARDOUS AIR POLLUTANT INVENTORY (Inventory of air pollution sources) Conditionally Exempt Small Quantity Generators, less than 100 kg/month of hazardous waste (Resource Conservation and Recovery Act (tracking hazardous waste)) - notification Organizations: LYNN VOC TECH INSTITUTE (CONTACT/OPERATOR)
, LYNN VOCATIONAL TECHNICAL SCHOOL (CONTACT/OWNER)
Alternative names: LYNN VOC TECH INSTITUTE, LYNN VOCATIONAL TECHNICAL SCHOOL, MARSHALLS WHARF
LYNN WATER TREATMENT PLANT (390 PARKLAND AVENUE in LYNN, MA)
ENFORCEMENT/COMPLIANCE ACTIVITY (Integrated Compliance Information System) - ICIS-01-2003-9082, FORMAL ENFORCEMENT ACTION (Integrated Compliance Information System) - ICIS-01-2003-9082, FORMAL ENFORCEMENT ACTION National Pollutant Discharge Elimination System NON-MAJOR (Tracking pollutant discharge elimination systems) - permit Business SIC classification: WATER SUPPLY Organizations: LYNN WATER TREATMENT FAC (CONTACT/OPERATOR)
Alternative names: LYNN WATER & SEWER, LYNN WATER & SEWER COMM., LYNN WATER TREATMENT FAC
LYNN REGIONAL WASTEWATER TREATMENT PLANT (2 CIRCLE AVENUE in LYNN, MA)
AIR SYNTHETIC MINOR (AIRS/AFS) - ICIS-, ENFORCEMENT/COMPLIANCE ACTIVITY CRITERIA AND HAZARDOUS AIR POLLUTANT INVENTORY (Inventory of air pollution sources) National Pollutant Discharge Elimination System MAJOR (Tracking pollutant discharge elimination systems) - permit - ICIS-, ENFORCEMENT/COMPLIANCE ACTIVITY AIR MAJOR ("Best Available" air pollution technologies tracking) Business SIC classification: SEWERAGE SYSTEMS Organizations: U.S. FILTER (CONTACT/OPERATOR)
, LYNN WATER & SEWER COMM (CONTACT/OWNER)
Alternative names: LYNN REGIONAL WATER POLLUTION CONTROL PLANT, LYNN REGIONAL W P C F, LYNN REGIONAL WATER POLLUTION CONTROL PLANT, LYNN REGIONAL WWTP
CL HAUTHAWAY & SONS (638 SUMMER ST. in LYNN, MA)
AIR MINOR (AIRS/AFS) COMPLIANCE ACTIVITY (Tracking inspections of insecticide, fungicide, and rodenticide, and toxic substances) CRITERIA AND HAZARDOUS AIR POLLUTANT INVENTORY (Inventory of air pollution sources) HAZARDOUS WASTE BIENNIAL REPORTER (Resource Conservation and Recovery Act (tracking hazardous waste)) Large Quantity Generators, more that 1000 kg of hazardous waste/month (Resource Conservation and Recovery Act (tracking hazardous waste)) - notification TRI REPORTER (Tracking of toxic chemicals releasing facilities) Business SIC classification: ADHESIVES AND SEALANTS Business NAICS classification: ADHESIVE MANUFACTURING. Organizations: C.L. HAUTHAWAY AND SONS CORP. (CONTACT/OPERATOR)
, LEO JOHNSON (CONTACT/OWNER)
Alternative names: C L HAUTHAWAY & SONS CORPORATION, C.L. HAWTHAWAY & SONS, HATHAWAY & SONS, HAUTHAWAY C L & SONS CORP
A DREWICZ ELEM (34 HOOD STREET in LYNN, MA)
(National Center for Education Statistics) - STATE ID-163016 Organizations: LYNN (SCHOOL DISTRICT)
LINCOLN-THOMSON (115 GARDINER STREET in LYNN, MA)
(National Center for Education Statistics) - STATE ID-163070 Organizations: LYNN (SCHOOL DISTRICT)
JULIA F CALLAHAN (200 O'CALLAGHAN WAY in LYNN, MA)
(National Center for Education Statistics) - STATE ID-163030 Organizations: LYNN (SCHOOL DISTRICT)
BREED MIDDLE SCHOOL (90 O'CALLAGHAN WAY in LYNN, MA)
(National Center for Education Statistics) - STATE ID-163405 Organizations: LYNN (SCHOOL DISTRICT)
CLASSICAL HIGH (235 O'CALLAGHAN WAY in LYNN, MA)
(National Center for Education Statistics) - STATE ID-163505 Organizations: LYNN (SCHOOL DISTRICT)
BREST BOB BUICK INC (770 LYNNWAY in LYNN, MA)
(Resource Conservation and Recovery Act (tracking hazardous waste)) Organizations: ROBERT BREST (CONTACT/OWNER)
ANTHONY LOUIS L CO INC (1127 WESTERN AVE in LYNN, MA)
(Resource Conservation and Recovery Act (tracking hazardous waste)) Organizations: LOUIS L ANTHONY JR (CONTACT/OWNER)
LYNN CARBURETOR & AUTO SERVICE (1067 WESTERN AVE in LYNN, MA)
(Resource Conservation and Recovery Act (tracking hazardous waste)) Organizations: CHRISTOPHER ANSLONO (CONTACT/OWNER)
Housing units lacking complete plumbing facilities: 0.3% Housing units lacking complete kitchen facilities: 0.3%
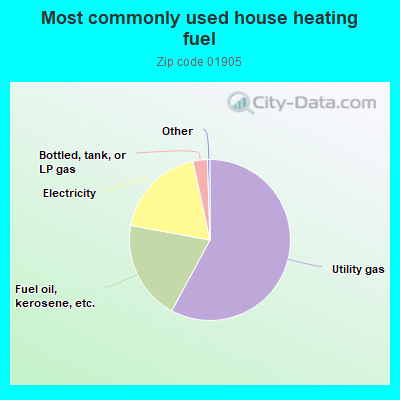
57.9%Utility gas
20.0%Fuel oil, kerosene, etc.
18.7%Electricity
2.9%Bottled, tank, or LP gas
Population in 1990: 21,360. Population change in the 1990s: +2,213 (+10.4%).
Place of birth for U.S.-born residents:
This state: 15,056
Northeast: 895
Midwest: 244
South: 325
West: 84
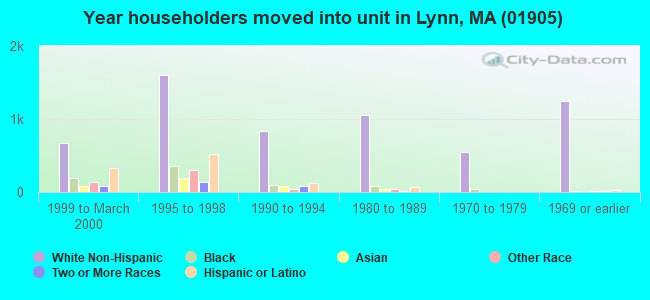
60% of the 01905 zip code residents lived in the same house 5 years ago. Out of people who lived in different houses, 69% lived in this county. Out of people who lived in different counties, 50% lived in Massachusetts.
92% of the 01905 zip code residents lived in the same house 1 year ago. Out of people who lived in different houses, 51% moved from this county. Out of people who lived in different houses, 38% moved from different county within same state. Out of people who lived in different houses, 3% moved from different state. Out of people who lived in different houses, 7% moved from abroad.
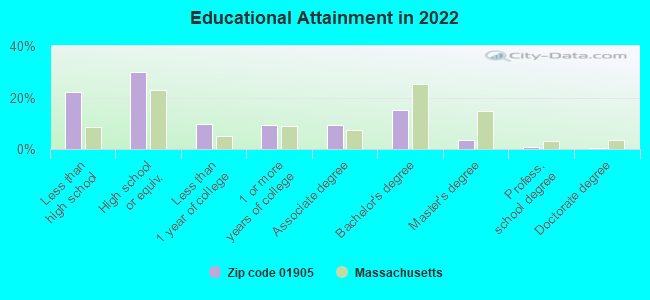
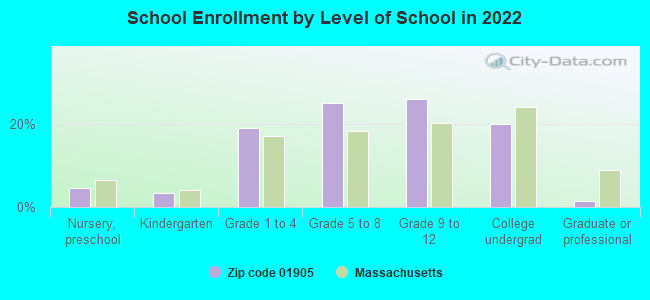
Private vs. public school enrollment:
Students in private schools in grades 1 to 8 (elementary and middle school): 450
Here:
14.4%
Massachusetts:
10.3%
Students in private schools in grades 9 to 12 (high school): 136
Here:
7.5%
Massachusetts:
12.3%
Students in private undergraduate colleges: 564
Here:
40.8%
Massachusetts:
51.2%
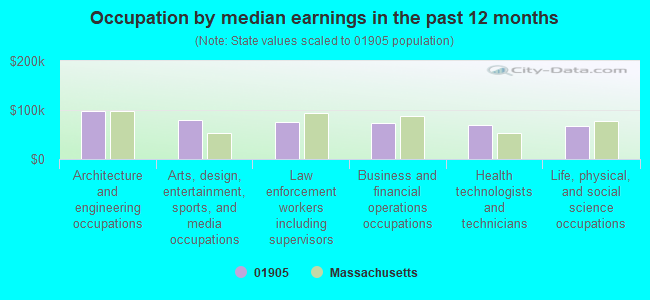
Occupation by median earnings in the past 12 months ($)
98,600Architecture and engineering occupations
78,700Arts, design, entertainment, sports, and media occupations
75,795Law enforcement workers including supervisors
73,893Business and financial operations occupations
68,566Health technologists and technicians
67,581Life, physical, and social science occupations
Companies with federal contracts located in this zip code:
ESSEX ENGINEERING INC (20 DAY ST in LYNN, MA; small business) 50 employees, $0 revenue. Veteran Owned Business: $371,765 in 10 contractsfrom 2000 to 2006
Contracts for Miscellaneous Aircraft Accessories and Components, Other Defense -- Applied Research and Exploratory Development (R&D), Aircraft Maintenance and Repair Shop Specialized Equipment, Aircraft Ground Servicing Equipment, and moreby Navy, Army, Defense Logistics Agency Signed by year:2000: $128,500; 2001: $67,415; 2002: $15,925; 2003: $69,615; 2004: $71,310; 2005: $0; 2006: $19,000.
Biggest contracts:
$99,500 with Navy for Miscellaneous Aircraft Accessories and Components. Signed on 2000-07-19. Completion date: 2000-12-31.
$67,415 with Army for Other Defense -- Applied Research and Exploratory Development (R&D). Signed on 2001-08-02. Completion date: 2001-12-30.
$35,250 with Navy for Aircraft Maintenance and Repair Shop Specialized Equipment. Signed on 2003-03-04. Completion date: 2003-07-02.
$34,365 with Defense Logistics Agency for Aircraft Ground Servicing Equipment. Signed on 2003-11-28. Completion date: 2004-03-26.
CARRIERE AIR CONDITIONING INC (90 CLIFF STREET in LYNN, MA; small business) : $80,200 in 4 contractsfrom 2003 to 2004
$75,452 with Army for Waste Disposal Equipment. Signed on 2003-09-24. Completion date: 2004-03-01.
$29,497 with Army for Other Buildings. Signed on 2003-04-29. Completion date: 2003-05-23.
$3,970 with Army for Waste Disposal Equipment. Signed on 2003-10-14. Completion date: 2004-03-01.
-$28,719, same as above.Signed on 2004-05-10. Completion date: 2004-03-01.
OEM SALES (19 BENNETT STREET in WEST LYNN, MA; small business)
$32,000 with Navy for Miscellaneous Communication Equipment. Signed on 2003-03-20. Completion date: 2003-03-30.
THERMO CRAFT ENGINEERING CORP (701 WESTERN AVE in LYNN, MA; small business) : $21,168 in 2 contractsfrom 2005 to 2006
$21,418 with Army for Weapons Maintenance and Repair Shop Specialized Equipment. Signed on 2005-09-21. Completion date: 2006-02-17.
-$250, same as above.Signed on 2006-05-11. Completion date: 2006-05-26.
AMERICAN POWER DEVICES INC (69 BENNETT ST in LYNN, MA; small business)
$4,940 with Defense Logistics Agency for Semiconductor Devices and Associated Hardware. Signed on 2005-03-29. Completion date: 2005-04-23.
ERC WIPING PRODUCTS INC (19 BENNETT ST in LYNN, MA; small business)
$3,213 with Army for Textile Fabrics. Signed on 2005-09-24. Completion date: 2005-09-29.
GAYNOR INDUSTRIES INC (37 BENNETT ST in LYNN, MA; small business) : $274 in 3 contractsfrom 2004 to 2006
$155 with Army for Packing and Gasket Materials. Signed on 2004-05-18. Completion date: 2004-06-18.
$69 with Army for Nuts and Washers. Signed on 2005-08-22. Completion date: 2005-09-02.
$50 with Army for Packing and Gasket Materials. Signed on 2006-03-06. Completion date: 2006-03-20.
Top industries in this zip code by the number of employees in 2005:
2002 - 2018 National Fire Incident Reporting System (NFIRS) incidents
Based on the data from the years 2002 - 2018 the average number of fire incidents per year is 98. The highest number of reported fires - 175 took place in 2011, and the least - 18 in 2003. The data has a rising trend.
When looking into fire subcategories, the most reports belonged to: Structure Fires (67.8%), and Outside Fires (20.0%).
Fire incident types reported to NFIRS in Zip Code 01905


 Nearest zip codes: 01904, 01901, 01902, 01906, 02151, 01908.
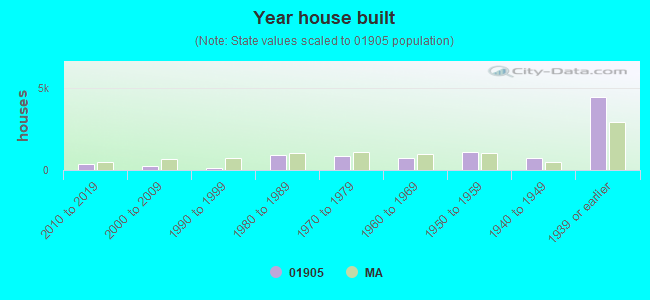


 Based on the data from the years 2002 - 2018 the average number of fire incidents per year is 98. The highest number of reported fires - 175 took place in 2011, and the least - 18 in 2003. The data has a rising trend.
 When looking into fire subcategories, the most reports belonged to: Structure Fires (67.8%), and Outside Fires (20.0%).