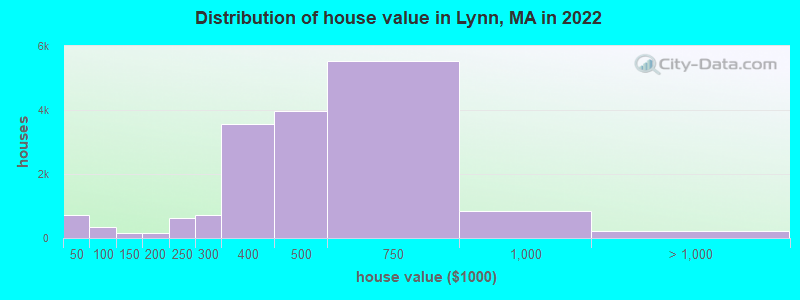
Estimated median house or condo value in 2022: $475,100 (it was $145,300 in 2000)
Lynn:
$475,100
MA:
$534,700
Mean prices in 2022:all housing units: $463,835; detached houses: $472,944; townhouses or other attached units: $418,383; in 2-unit structures: $544,117; in 3-to-4-unit structures: $463,028; in 5-or-more-unit structures: $275,488
Median gross rent in 2022: $1,560.
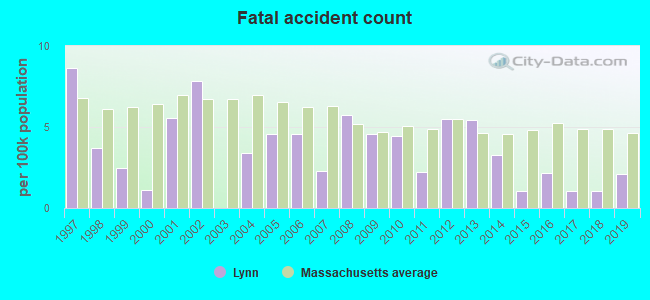
March 2022 cost of living index in Lynn: 138.1 (high, U.S. average is 100)
Percentage of residents living in poverty in 2022: 13.4%
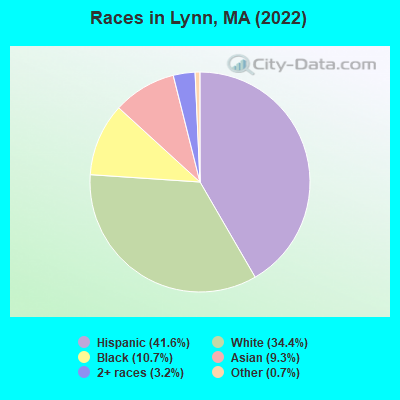
(12.5% for White Non-Hispanic residents, 14.2% for Black residents, 16.0% for Hispanic or Latino residents, 36.9% for American Indian residents, 15.6% for other race residents, 12.0% for two or more races residents)
The City-Data.com crime index weighs serious crimes and violent crimes more heavily. Higher means more crime, U.S. average is 246.1. It adjusts for the number of visitors and daily workers commuting into cities.
- means the value is smaller than the state average. - means the value is about the same as the state average. - means the value is bigger than the state average. - means the value is much bigger than the state average.
Latest news from Lynn, MA collected exclusively by city-data.com from local newspapers, TV, and radio stations
Ancestries: Irish (5.9%), Italian (3.6%), Haitian (2.8%), American (1.8%), English (1.6%), Brazilian (1.6%).
Current Local Time: EST time zone
Elevation: 30 feet
Land area: 10.8 square miles.
Population density: 9,329 people per square mile (high).
37,274 residents are foreign born (26.1% Latin America, 3.8% Asia).
This city:
37.0%
Massachusetts:
17.6%
Median real estate property taxes paid for housing units with mortgages in 2022: $4,529 (0.9%) Median real estate property taxes paid for housing units with no mortgage in 2022: $4,510 (1.0%)
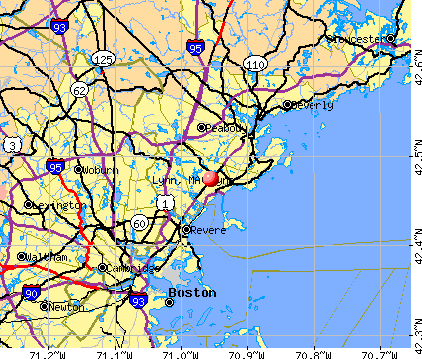
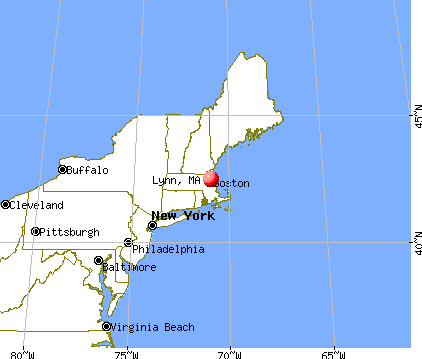
Nearest city with pop. 200,000+: Boston, MA (12.6 miles , pop. 589,141).
Nearest city with pop. 1,000,000+: Bronx, NY (188.1 miles , pop. 1,332,650).
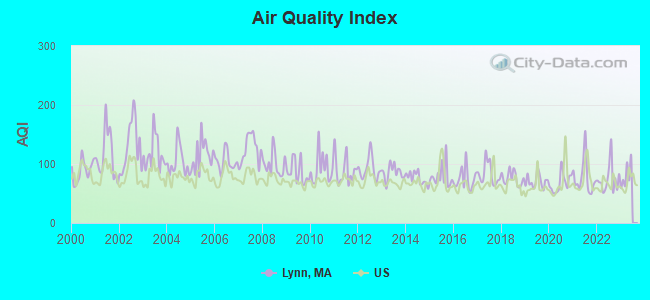
Air Quality Index (AQI) level in 2022 was 74.3. This is about average.
City:
74.3
U.S.:
72.6
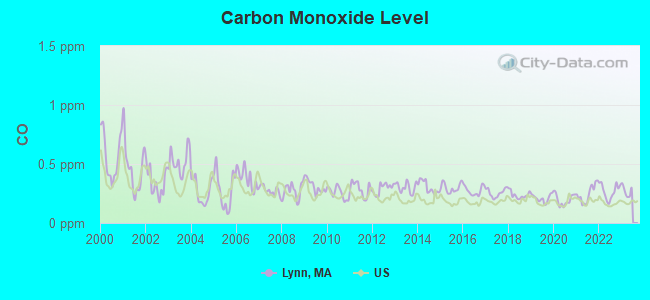
Carbon Monoxide (CO) [ppm] level in 2022 was 0.269. This is about average.Closest monitor was 7.6 miles away from the city center.
City:
0.269
U.S.:
0.251
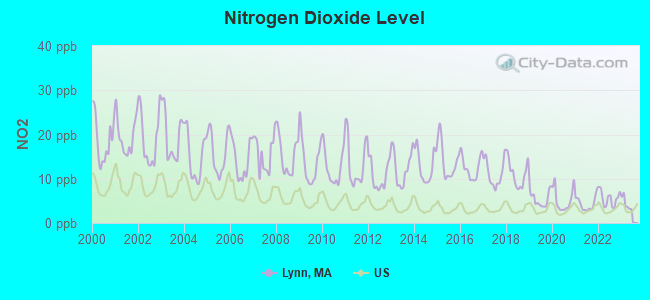
Nitrogen Dioxide (NO2) [ppb] level in 2022 was 5.55. This is about average.Closest monitor was 0.6 miles away from the city center.
City:
5.55
U.S.:
5.11
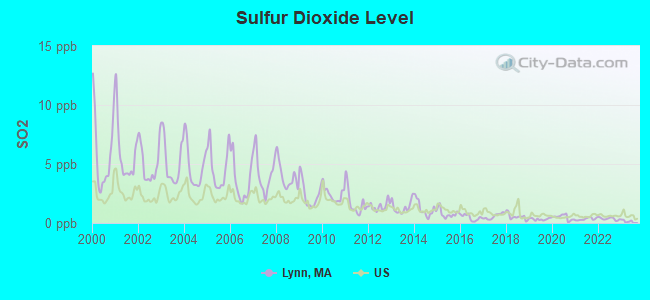
Sulfur Dioxide (SO2) [ppb] level in 2022 was 0.358. This is significantly better than average.Closest monitor was 0.6 miles away from the city center.
City:
0.358
U.S.:
1.515
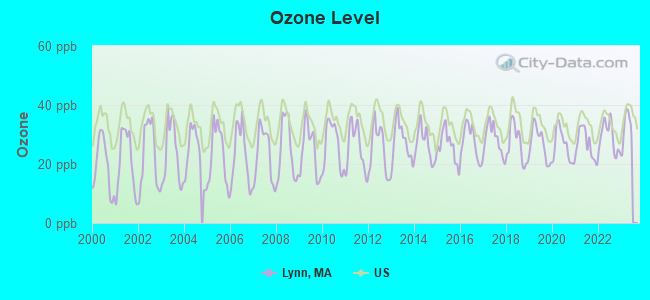
Ozone [ppb] level in 2022 was 29.1. This is about average.Closest monitor was 3.3 miles away from the city center.
City:
29.1
U.S.:
33.3
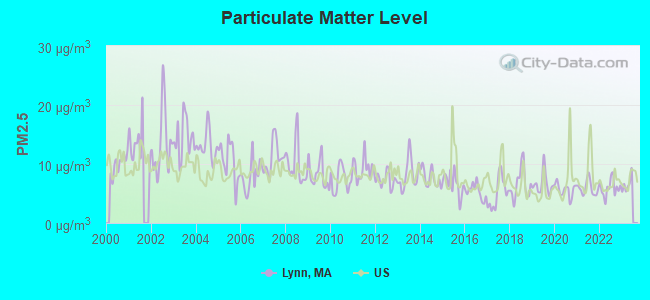
Particulate Matter (PM2.5) [µg/m3] level in 2022 was 5.94. This is better than average.Closest monitor was 0.8 miles away from the city center.
City:
5.94
U.S.:
8.11
Tornado activity:
Lynn-area historical tornado activity is slightly below Massachusetts state average. It is 48% smaller than the overall U.S. average.
On 6/9/1953, a category F4 (max. wind speeds 207-260 mph) tornado 31.2 miles away from the Lynn city center killed 90 peopleand injured 1228 peopleand causedbetween $50,000,000 and $500,000,000 in damages.
On 9/29/1974, a category F3 (max. wind speeds 158-206 mph) tornado 16.0 miles away from the city center injured one personand causedbetween $50,000 and $500,000 in damages.
Earthquake activity:
Lynn-area historical earthquake activity is significantly above Massachusetts state average. It is 73% smaller than the overall U.S. average.
On 4/20/2002 at 10:50:47, a magnitude 5.3 (5.3 ML, Depth: 3.0 mi, Class: Moderate, Intensity: VI - VII) earthquake occurred 197.0 miles away from the city center On 10/7/1983 at 10:18:46, a magnitude 5.3 (5.1 MB, 5.3 LG, 5.1 ML) earthquake occurred 199.0 miles away from Lynn center On 1/19/1982 at 00:14:42, a magnitude 4.7 (4.5 MB, 4.7 MD, 4.5 LG, Class: Light, Intensity: IV - V) earthquake occurred 78.1 miles away from the city center On 10/16/2012 at 23:12:25, a magnitude 4.7 (4.7 ML, Depth: 10.0 mi) earthquake occurred 79.2 miles away from the city center On 4/20/2002 at 10:50:47, a magnitude 5.2 (5.2 MB, 4.2 MS, 5.2 MW, 5.0 MW) earthquake occurred 196.5 miles away from Lynn center On 8/22/1992 at 12:20:32, a magnitude 4.8 (4.8 MB, 3.8 MS, 4.7 LG, Depth: 6.2 mi) earthquake occurred 235.3 miles away from the city center Magnitude types: regional Lg-wave magnitude (LG), body-wave magnitude (MB), duration magnitude (MD), local magnitude (ML), surface-wave magnitude (MS), moment magnitude (MW)
Natural disasters:
The number of natural disasters in Essex County (33) is a lot greater than the US average (15). Major Disasters (Presidential) Declared: 20 Emergencies Declared: 13
Causes of natural disasters: Floods: 14, Storms: 11, Hurricanes: 6, Snowstorms: 5, Winter Storms: 5, Snows: 3, Blizzards: 2, Fire: 1, Heavy Rain: 1, Snowfall: 1, Water Main Break: 1, Wind: 1 (Note: some incidents may be assigned to more than one category).
Hospitals in Lynn:
ALL CARE HOSPICE INC (16 CITY HALL SQUARE)
ATLANTICARE MEDICAL CENTER INC UNION (provides emergency services, 212 BOSTON STREET)
Home Health Centers in Lynn:
ABLE HOME CARE, LLC (140 UNION STREET S-414)
ALL CARE VNA-GREATER LYNN INC (16 CITY HALL SQUARE)
MULTICULTURAL HOME CARE, INC (330 THE LYNNWAY, SUITE 103)
NEIGHBORHOOD HOME CARE LLC (145 MUNROE STREET, SUITE 407)
Nursing Homes in Lynn:
ABBOTT HOUSE NURSING HOME (28 ESSEX STREET)
ALBA NURSING HOME (12 PARK ST)
ATLANTICARE MEDICAL CENTER T C U (500 LYNNFIELD STREET, 3RD FLOOR)
AVALON N H (24 BAKER ST)
ESSEX CONVALESCENT HOME,THE (94 FRANKLIN STREET)
JOSEPH B DEVLIN PMI (179 HOLYOKE STREET)
LAWRENCE MANOR NURSING HOME (26 HENRY AVENUE)
LENOX HILL NURS REHAB CARE FAC (70 GRANITE ST)
LYNN CONV HOME (655 BOSTON ST)
NORTH SHORE HEALTH CARE CENTER (70 GRANITE STREET)
LYNN PUBLIC LIBRARY (Operating income: $1,157,026; Location: 5 NORTH COMMON ST.; 112,890 books; 2,554 audio materials; 4,188 video materials; 7 local licensed databases; 34 state licensed databases; 11 other licensed databases; 175 print serial subscriptions)
User-submitted facts and corrections:
Please add this to the section on private elementary schools: North Shore Christian School, founded 1951; Location: 26 Urban Street, Lynn; Student body: 156, grades K to 8 www.nschristian.org, 781-599-2040
lynn historian first player in lynn streethockey history to score 3 goals in 53 seconds was Jimmy Lozzi in the 1980's
Please add this to the section on private elementary schools: North Shore Christian School, founded 1951; Location: 26 Urban Street, Lynn; Student body: 156, grades K to 8 www.nschristian.org, 781-599-2040
Notable locations in Lynn: Lynn-Central Square Station (A), River Works Station (B), Lynn Station (C), Lynngate Plaza (D), Hyde-Mills House (E), Lynn Fire Department Pine Hill Station (F), Lynn Fire Department Tower Hill Station (G), Lynn Fire Department Fayette Street Station (H), Lynn Fire Department Eastern Avenue Station (I), Lynn Fire Department Broadway Station (J), Lynn Fire Department Highlands Station (K), Lynn City Hall (L), Lynn Fire Department Headquarters (M), Shoemaker Elementary School Library (N), Hartnett Library (O), Drewicz School Library (P), Robert Ford Elementary School Library (Q), Lynn Classical High School Library (R), Lynn Fire Department Lynnfield Street Station (S). Display/hide their locations on the map
Churches in Lynn include: All Saints Church (A), Lynn Cambodian Baptist Church (B), Good Samaritan Church (C), First Spanish Free Methodist Church (D), First Lutheran Church (E), First Church of Christ Scientist (F), First Christian Church (G), First Baptist Church of Lynn (H), First Assembly of God Church (I). Display/hide their locations on the map
Cemeteries: Old East Burying Ground (1), Saint Josephs Cemetery (2), Saint Jeans Cemetery (3), Pine Grove Cemetery (4). Display/hide their locations on the map
Lakes, reservoirs, and swamps: Cedar Pond (A), Flax Pond (B), Floating Bridge Pond (C), Lily Mere (D), Frog Pond (E), Goldfish Pond (F), Birch Pond (G), Walden Pond (H). Display/hide their locations on the map
Parks in Lynn include: Lynn Common (1), Central Square Historic District (2), Memorial Park (3), Barry Park (4), Clark Street Playground (5), Kiley Playground (6), Hood Playground (7), Flax Pond Playground (8), Frazier Field (9). Display/hide their locations on the map
Tourist attractions: Grand Army Museum (58 Andrew Street), Gibbons Aquaria- Inc. (Aquariums; 55 Purdon Avenue), City Of Lynn (Cultural Attractions- Events- & Facilities; 270 Broadway), Mary Baker Eddy Historical Home (Cultural Attractions- Events- & Facilities; 12 Broad Street), Lynnway Bowling Center Inc (Amusement & Theme Parks; 497 Lynnway).
Hotels: Four Seasons Demaguy Fashions (138 Munroe Street), Caron Gerard L CPA (142 Ocean Street).
Courts: Huss Court Properties (20 Huss Court), Mass Commonwealth - Essex Juvenile Court In Lynn- Courts- Juvenile Courts- Lynn Juvenile C (139 Central Avenue), Essex County - Superior Court- District Attorney's Ofc (580 Essex Street).
Birthplace of: John J. Donovan - Computer scientist, William Dudley Pelley - (1890-1965), fascist and metaphysician, Walter Brennan - Actor, Jim Hegan - Baseball player and coach, Albert Cole (Massachusetts) - Politician, Alfred Tozzer - Anthropologist, Tricia Psarreas - Writer, Harry Agganis - Baseball player, Biff Elliot - Film actor, Eleanor Manning O'Connor - Architect.
Essex County has a predicted average indoor radon screening level greater than 4 pCi/L (pico curies per liter) - Highest Potential
Drinking water stations with addresses in Lynn that have no violations reported:
LYNN WATER AND SEWER COMM (Population served: 90,329,Primary Water Source Type: Surface water)
Average household size:
This city:
2.7 people
Massachusetts:
2.5 people
Percentage of family households:
This city:
63.0%
Whole state:
63.0%
Percentage of households with unmarried partners:
This city:
8.2%
Whole state:
7.0%
Likely homosexual households (counted as self-reported same-sex unmarried-partner households)
Lesbian couples: 0.5% of all households
Gay men: 0.5% of all households
People in group quarters in Lynn in 2010:
263 people in nursing facilities/skilled-nursing facilities
240 people in group homes intended for adults
156 people in other noninstitutional facilities
129 people in emergency and transitional shelters (with sleeping facilities) for people experiencing homelessness
26 people in residential treatment centers for adults
21 people in group homes for juveniles (non-correctional)
People in group quarters in Lynn in 2000:
738 people in nursing homes
214 people in other noninstitutional group quarters
125 people in other group homes
108 people in homes for the mentally retarded
104 people in other nonhousehold living situations
21 people in homes for the mentally ill
18 people in religious group quarters
16 people in homes or halfway houses for drug/alcohol abuse
Banks with branches in Lynn (2011 data):
Sovereign Bank, National Association: West Lynn Branch, Exchange Street Branch, Lynn - Broadway Branch. Info updated 2012/01/31: Bank assets: $78,146.9 mil, Deposits: $48,042.9 mil, headquarters in Wilmington, DE, positive income, Commercial Lending Specialization, 718 total offices, Holding Company: Banco Santander, S.A.
Eastern Bank: Lynngate Branch at 156 Boston Street, branch established on 1826/01/01; Market Street Branch at 112 Market Street, branch established on 1855/05/15. Info updated 2011/03/30: Bank assets: $7,812.9 mil, Deposits: $6,295.8 mil, headquarters in Boston, MA, positive income, Commercial Lending Specialization, 94 total offices, Holding Company: Eastern Bank Corporation
Salem Five Cents Savings Bank: Boston Street Lynn Branch at 35 Boston Street, branch established on 2007/12/31; Lynn Branch at 20 State Street, branch established on 2001/06/28. Info updated 2011/07/11: Bank assets: $2,876.6 mil, Deposits: $2,019.1 mil, headquarters in Salem, MA, positive income, Commercial Lending Specialization, 23 total offices, Holding Company: Salem Five Bancorp
Bank of America, National Association: Lynn Branch at 1 State Street, branch established on 1968/08/30. Info updated 2009/11/18: Bank assets: $1,451,969.3 mil, Deposits: $1,077,176.8 mil, headquarters in Charlotte, NC, positive income, 5782 total offices, Holding Company: Bank Of America Corporation
East Boston Savings Bank: Lynn Branch at 335 Broadway, branch established on 2007/07/23. Info updated 2011/06/07: Bank assets: $1,946.5 mil, Deposits: $1,609.3 mil, headquarters in Boston, MA, positive income, Commercial Lending Specialization, 24 total offices, Holding Company: Meridian Financial Services, Inc
Equitable Co-operative Bank: Equitable Co-Operative Bank at 400 Broadway, branch established on 1877/01/01. Info updated 2010/01/11: Bank assets: $101.4 mil, Deposits: $79.2 mil, local headquarters, positive income, Mortgage Lending Specialization, 2 total offices
Century Bank and Trust Company: Lynn Branch at 2 State Street, branch established on 1919/01/01. Info updated 2010/05/27: Bank assets: $2,740.5 mil, Deposits: $2,148.1 mil, headquarters in Somerville, MA, positive income, Mortgage Lending Specialization, 25 total offices, Holding Company: Century Bancorp, Inc.
RBS Citizens, National Association: Lynn Stop And Shop Branch at 35 Washington Street, branch established on 2002/06/12. Info updated 2007/09/19: Bank assets: $106,940.6 mil, Deposits: $75,690.2 mil, headquarters in Providence, RI, positive income, 1135 total offices, Holding Company: Uk Financial Investments Limited
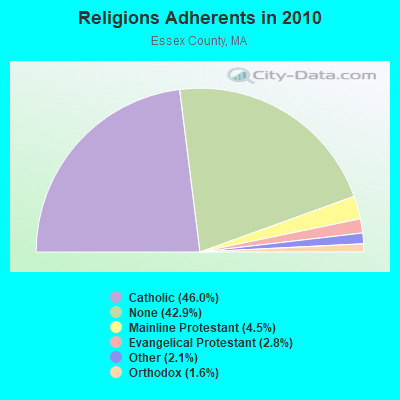
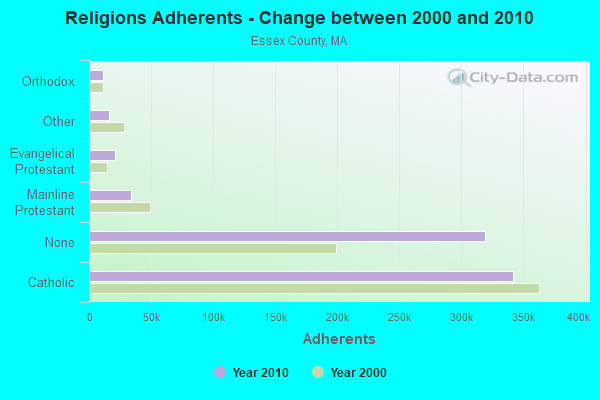
Religion statistics for Lynn, MA (based on Essex County data)
Religion
Adherents
Congregations
Catholic
341,970
55
Mainline Protestant
33,710
140
Evangelical Protestant
20,925
160
Other
15,882
63
Orthodox
11,590
13
Black Protestant
376
3
None
318,706
-
Source: Clifford Grammich, Kirk Hadaway, Richard Houseal, Dale E.Jones, Alexei Krindatch, Richie Stanley and Richard H.Taylor. 2012. 2010 U.S.Religion Census: Religious Congregations & Membership Study. Association of Statisticians of American Religious Bodies. Jones, Dale E., et al. 2002. Congregations and Membership in the United States 2000. Nashville, TN: Glenmary Research Center. Graphs represent county-level data
Aircraft: CULVER V (Category: Land, Seats: 2, Weight: Up to 12,499 Pounds, Speed: 93 mph), Engine: CONT MOTOR C85 SERIES (85 HP) (Reciprocating) N-Number: 3062K, N3062K, N-3062K, Serial Number: V281, Year manufactured: 1946 Registrant (Individual): Wallace T Bates, 35 Groveland, Lynn, MA 01901 Deregistered:Cancel Date: 12/09/2019
Aircraft: TAYLORCRAFT DC-65 (Category: Land, Seats: 2, Weight: Up to 12,499 Pounds, Speed: 82 mph), Engine: CONT MOTOR A&C65 SERIES (65 HP) (Reciprocating) N-Number: 58042, N58042, N-58042, Serial Number: 5656, Year manufactured: 1943 Registrant (Individual): Ruth C Tansey, 4 Beede Ave, Lynn, MA 01901 Deregistered:Cancel Date: 12/20/2019
Aircraft: AEROSTAR INTERNATIONAL INC RAVEN S-55A (Category: Land, Weight: Up to 12,499 Pounds), Engine: None N-Number: 6472V, N6472V, N-6472V, Serial Number: S55A-3026, Year manufactured: 1987, Airworthiness Date: 03/09/1987, Certificate Issue Date: 06/26/1998 Registrant (Individual): Thomas P Easton, 100 New Park St, Lynn, MA 01905 Deregistered:Cancel Date: 05/23/2017
Home Mortgage Disclosure Act Aggregated Statistics For Year 2009 (Based on 22 full tracts)
A) FHA, FSA/RHS & VA Home Purchase Loans
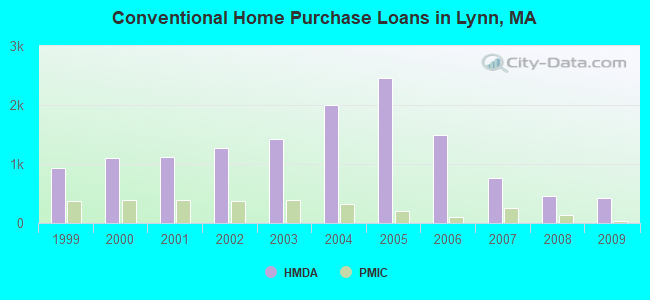
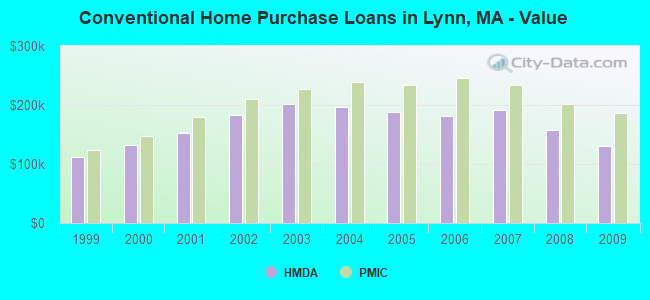
B) Conventional Home Purchase Loans
C) Refinancings
D) Home Improvement Loans
E) Loans on Dwellings For 5+ Families
F) Non-occupant Loans on < 5 Family Dwellings (A B C & D)
G) Loans On Manufactured Home Dwelling (A B C & D)
Number
Average Value
Number
Average Value
Number
Average Value
Number
Average Value
Number
Average Value
Number
Average Value
Number
Average Value
LOANS ORIGINATED
382
$193,406
417
$131,223
1,156
$195,748
58
$98,638
12
$534,667
158
$148,032
1
$166,000
APPLICATIONS APPROVED, NOT ACCEPTED
40
$168,875
27
$119,444
101
$202,851
17
$36,294
3
$1,203,667
15
$119,200
0
$0
APPLICATIONS DENIED
111
$177,450
122
$128,680
468
$209,801
48
$75,958
6
$341,667
63
$140,857
0
$0
APPLICATIONS WITHDRAWN
80
$183,362
72
$136,639
259
$207,375
14
$189,286
0
$0
28
$136,250
0
$0
FILES CLOSED FOR INCOMPLETENESS
17
$204,471
14
$201,286
93
$221,108
2
$124,000
0
$0
6
$117,000
0
$0
Aggregated Statistics For Year 2008 (Based on 22 full tracts)
A) FHA, FSA/RHS & VA Home Purchase Loans
B) Conventional Home Purchase Loans
C) Refinancings
D) Home Improvement Loans
E) Loans on Dwellings For 5+ Families
F) Non-occupant Loans on < 5 Family Dwellings (A B C & D)
G) Loans On Manufactured Home Dwelling (A B C & D)
Number
Average Value
Number
Average Value
Number
Average Value
Number
Average Value
Number
Average Value
Number
Average Value
Number
Average Value
LOANS ORIGINATED
306
$204,428
457
$158,346
738
$209,038
86
$76,895
22
$492,500
170
$175,282
1
$75,000
APPLICATIONS APPROVED, NOT ACCEPTED
24
$210,083
49
$179,000
129
$216,147
28
$52,893
3
$988,000
23
$188,609
0
$0
APPLICATIONS DENIED
110
$214,845
178
$174,994
635
$232,369
130
$49,308
7
$334,429
90
$180,244
0
$0
APPLICATIONS WITHDRAWN
33
$182,758
96
$167,396
225
$226,111
20
$185,400
2
$731,500
30
$177,167
0
$0
FILES CLOSED FOR INCOMPLETENESS
7
$183,571
19
$178,000
60
$220,933
7
$182,429
0
$0
9
$161,000
0
$0
Aggregated Statistics For Year 2007 (Based on 22 full tracts)
A) FHA, FSA/RHS & VA Home Purchase Loans
B) Conventional Home Purchase Loans
C) Refinancings
D) Home Improvement Loans
E) Loans on Dwellings For 5+ Families
F) Non-occupant Loans on < 5 Family Dwellings (A B C & D)
G) Loans On Manufactured Home Dwelling (A B C & D)
Number
Average Value
Number
Average Value
Number
Average Value
Number
Average Value
Number
Average Value
Number
Average Value
Number
Average Value
LOANS ORIGINATED
39
$252,974
767
$190,859
1,318
$214,967
164
$99,915
35
$522,600
153
$214,641
1
$91,000
APPLICATIONS APPROVED, NOT ACCEPTED
5
$288,400
115
$203,861
348
$228,759
50
$82,920
4
$992,000
49
$230,918
2
$238,000
APPLICATIONS DENIED
10
$252,100
365
$214,649
1,552
$253,973
238
$83,214
7
$395,286
125
$209,704
4
$22,500
APPLICATIONS WITHDRAWN
2
$330,000
100
$186,080
613
$242,837
37
$135,892
4
$536,250
40
$260,225
0
$0
FILES CLOSED FOR INCOMPLETENESS
0
$0
39
$251,667
233
$268,275
5
$100,600
1
$1,212,000
9
$283,000
0
$0
Aggregated Statistics For Year 2006 (Based on 22 full tracts)
A) FHA, FSA/RHS & VA Home Purchase Loans
B) Conventional Home Purchase Loans
C) Refinancings
D) Home Improvement Loans
E) Loans on Dwellings For 5+ Families
F) Non-occupant Loans on < 5 Family Dwellings (A B C & D)
G) Loans On Manufactured Home Dwelling (A B C & D)
Number
Average Value
Number
Average Value
Number
Average Value
Number
Average Value
Number
Average Value
Number
Average Value
Number
Average Value
LOANS ORIGINATED
28
$296,571
1,496
$181,034
2,312
$218,147
346
$91,309
32
$480,656
200
$241,220
2
$285,500
APPLICATIONS APPROVED, NOT ACCEPTED
0
$0
189
$177,566
459
$233,856
52
$94,442
1
$371,000
41
$211,585
2
$62,500
APPLICATIONS DENIED
7
$349,714
548
$191,562
1,961
$241,796
315
$85,368
10
$457,400
146
$215,295
10
$296,100
APPLICATIONS WITHDRAWN
2
$222,500
253
$196,830
1,137
$245,285
43
$135,372
4
$311,250
67
$274,119
0
$0
FILES CLOSED FOR INCOMPLETENESS
0
$0
53
$187,717
227
$262,079
8
$45,125
0
$0
10
$262,400
1
$338,000
Aggregated Statistics For Year 2005 (Based on 22 full tracts)
A) FHA, FSA/RHS & VA Home Purchase Loans
B) Conventional Home Purchase Loans
C) Refinancings
D) Home Improvement Loans
E) Loans on Dwellings For 5+ Families
F) Non-occupant Loans on < 5 Family Dwellings (A B C & D)
G) Loans On Manufactured Home Dwelling (A B C & D)
Number
Average Value
Number
Average Value
Number
Average Value
Number
Average Value
Number
Average Value
Number
Average Value
Number
Average Value
LOANS ORIGINATED
35
$306,571
2,454
$188,470
2,653
$219,247
299
$123,231
43
$503,233
338
$233,047
4
$111,000
APPLICATIONS APPROVED, NOT ACCEPTED
5
$265,200
201
$193,279
337
$221,653
51
$84,529
2
$184,500
42
$231,357
0
$0
APPLICATIONS DENIED
12
$368,750
649
$190,618
1,657
$243,342
312
$107,330
5
$483,000
163
$214,080
15
$58,533
APPLICATIONS WITHDRAWN
3
$305,667
442
$195,724
1,080
$233,396
126
$192,254
8
$271,375
119
$273,471
5
$185,400
FILES CLOSED FOR INCOMPLETENESS
0
$0
96
$198,333
491
$259,261
5
$122,400
2
$340,000
28
$268,714
0
$0
Aggregated Statistics For Year 2004 (Based on 22 full tracts)
A) FHA, FSA/RHS & VA Home Purchase Loans
B) Conventional Home Purchase Loans
C) Refinancings
D) Home Improvement Loans
E) Loans on Dwellings For 5+ Families
F) Non-occupant Loans on < 5 Family Dwellings (A B C & D)
G) Loans On Manufactured Home Dwelling (A B C & D)
Number
Average Value
Number
Average Value
Number
Average Value
Number
Average Value
Number
Average Value
Number
Average Value
Number
Average Value
LOANS ORIGINATED
98
$283,969
2,007
$195,996
3,002
$208,989
337
$118,050
52
$607,981
335
$221,675
17
$308,059
APPLICATIONS APPROVED, NOT ACCEPTED
8
$280,125
220
$207,945
450
$221,078
87
$89,230
2
$350,000
46
$220,043
3
$41,667
APPLICATIONS DENIED
18
$305,667
455
$206,495
1,234
$232,282
367
$93,409
5
$518,200
143
$252,336
8
$170,750
APPLICATIONS WITHDRAWN
15
$321,133
204
$190,490
1,104
$223,132
145
$129,869
9
$1,659,333
63
$254,254
1
$132,000
FILES CLOSED FOR INCOMPLETENESS
3
$252,333
60
$193,483
340
$230,018
20
$100,400
1
$200,000
22
$247,455
2
$71,500
Aggregated Statistics For Year 2003 (Based on 22 full tracts)
A) FHA, FSA/RHS & VA Home Purchase Loans
B) Conventional Home Purchase Loans
C) Refinancings
D) Home Improvement Loans
E) Loans on Dwellings For 5+ Families
F) Non-occupant Loans on < 5 Family Dwellings (A B C & D)
Number
Average Value
Number
Average Value
Number
Average Value
Number
Average Value
Number
Average Value
Number
Average Value
LOANS ORIGINATED
162
$287,395
1,419
$200,850
5,482
$173,041
134
$41,746
40
$688,550
465
$196,366
APPLICATIONS APPROVED, NOT ACCEPTED
13
$263,385
159
$207,792
733
$182,816
61
$38,279
1
$620,000
62
$195,581
APPLICATIONS DENIED
43
$280,256
340
$208,715
1,535
$197,100
247
$40,547
5
$420,800
135
$225,919
APPLICATIONS WITHDRAWN
11
$282,818
160
$191,075
1,411
$187,039
70
$69,814
10
$452,600
57
$196,789
FILES CLOSED FOR INCOMPLETENESS
6
$257,333
25
$207,040
130
$205,777
4
$30,000
0
$0
11
$210,818
Aggregated Statistics For Year 2002 (Based on 22 full tracts)
A) FHA, FSA/RHS & VA Home Purchase Loans
B) Conventional Home Purchase Loans
C) Refinancings
D) Home Improvement Loans
E) Loans on Dwellings For 5+ Families
F) Non-occupant Loans on < 5 Family Dwellings (A B C & D)
Number
Average Value
Number
Average Value
Number
Average Value
Number
Average Value
Number
Average Value
Number
Average Value
LOANS ORIGINATED
289
$251,488
1,275
$183,527
3,783
$158,372
162
$38,617
48
$625,938
361
$179,019
APPLICATIONS APPROVED, NOT ACCEPTED
14
$258,643
103
$205,718
432
$152,933
63
$37,667
4
$479,000
34
$178,618
APPLICATIONS DENIED
45
$275,356
213
$205,460
913
$154,591
224
$30,996
8
$373,000
62
$162,210
APPLICATIONS WITHDRAWN
29
$246,862
125
$180,144
760
$160,361
57
$46,404
4
$260,750
54
$160,389
FILES CLOSED FOR INCOMPLETENESS
3
$209,000
56
$187,714
155
$165,652
2
$47,500
0
$0
9
$143,778
Aggregated Statistics For Year 2001 (Based on 22 full tracts)
A) FHA, FSA/RHS & VA Home Purchase Loans
B) Conventional Home Purchase Loans
C) Refinancings
D) Home Improvement Loans
E) Loans on Dwellings For 5+ Families
F) Non-occupant Loans on < 5 Family Dwellings (A B C & D)
Number
Average Value
Number
Average Value
Number
Average Value
Number
Average Value
Number
Average Value
Number
Average Value
LOANS ORIGINATED
379
$202,607
1,116
$153,148
3,105
$140,159
190
$35,142
33
$485,758
305
$148,144
APPLICATIONS APPROVED, NOT ACCEPTED
21
$203,667
104
$159,404
369
$124,756
63
$30,778
5
$272,600
40
$139,350
APPLICATIONS DENIED
59
$209,051
181
$164,436
960
$122,882
349
$29,433
7
$650,429
65
$149,400
APPLICATIONS WITHDRAWN
24
$204,125
98
$141,398
730
$130,882
108
$51,463
4
$803,750
42
$131,048
FILES CLOSED FOR INCOMPLETENESS
3
$179,333
19
$151,421
111
$141,892
3
$24,333
2
$384,500
3
$108,000
Aggregated Statistics For Year 2000 (Based on 22 full tracts)
A) FHA, FSA/RHS & VA Home Purchase Loans
B) Conventional Home Purchase Loans
C) Refinancings
D) Home Improvement Loans
E) Loans on Dwellings For 5+ Families
F) Non-occupant Loans on < 5 Family Dwellings (A B C & D)
Number
Average Value
Number
Average Value
Number
Average Value
Number
Average Value
Number
Average Value
Number
Average Value
LOANS ORIGINATED
304
$157,717
1,095
$131,557
847
$106,643
233
$23,429
27
$465,148
177
$117,486
APPLICATIONS APPROVED, NOT ACCEPTED
18
$157,056
87
$133,931
153
$101,275
120
$26,450
0
$0
24
$111,917
APPLICATIONS DENIED
68
$168,824
256
$128,113
583
$86,509
270
$28,733
6
$225,500
64
$109,016
APPLICATIONS WITHDRAWN
18
$162,722
127
$121,291
458
$86,867
43
$41,953
2
$593,500
25
$132,920
FILES CLOSED FOR INCOMPLETENESS
9
$128,222
30
$128,400
138
$113,877
1
$51,000
0
$0
9
$116,000
Aggregated Statistics For Year 1999 (Based on 20 full and 2 partial tracts)
A) FHA, FSA/RHS & VA Home Purchase Loans
B) Conventional Home Purchase Loans
C) Refinancings
D) Home Improvement Loans
E) Loans on Dwellings For 5+ Families
F) Non-occupant Loans on < 5 Family Dwellings (A B C & D)
2002 - 2018 National Fire Incident Reporting System (NFIRS) incidents
According to the data from the years 2002 - 2018 the average number of fire incidents per year is 310. The highest number of reported fires - 561 took place in 2011, and the least - 76 in 2005. The data has an increasing trend.
When looking into fire subcategories, the most reports belonged to: Structure Fires (73.1%), and Outside Fires (16.9%).
#8 on the list of "Top 101 cities with largest percentage of males in occupations: healthcare support occupations (population 50,000+)"
#10 on the list of "Top 100 cities with oldest houses (pop. 50,000+)"
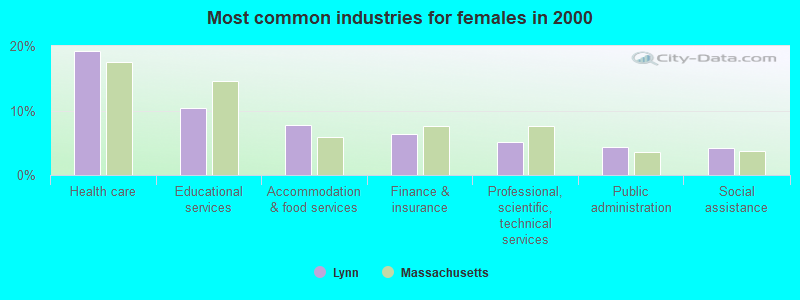
#12 on the list of "Top 101 cities with largest percentage of males in industries: health care and social assistance (population 50,000+)"
#12 on the list of "Top 100 cities with old houses but young residents (pop. 50,000+)"
#13 on the list of "Top 101 cities with largest percentage of females in industries: health care and social assistance (population 50,000+)"
#15 on the list of "Top 101 cities with the most residents born in Dominican Republic (population 500+)"
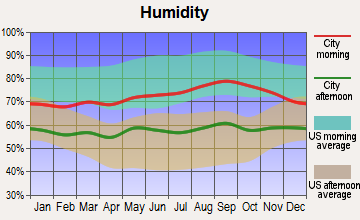
#15 on the list of "Top 101 cities with the smallest differences between morning and afternoon humidity (population 50,000+)"
#15 on the list of "Top 101 cities with the smallest humidity differences during a year (population 50,000+)"
#20 on the list of "Top 101 cities with the most residents born in Cambodia (population 500+)"
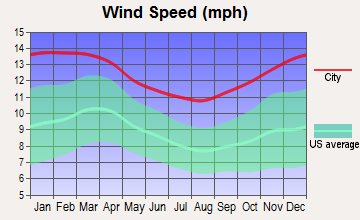
#20 on the list of "Top 101 cities with the highest average wind speeds (population 50,000+)"
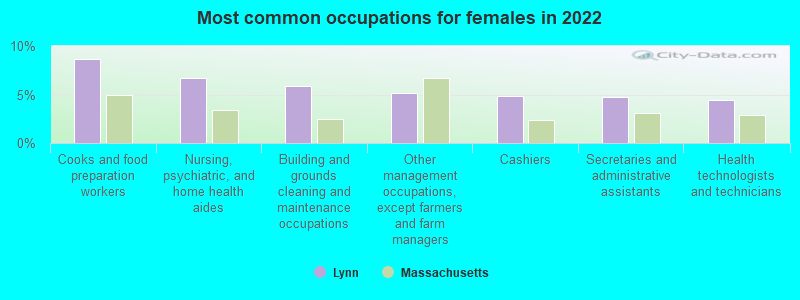
#22 on the list of "Top 101 cities with largest percentage of females in occupations: health technologists and technicians (population 50,000+)"
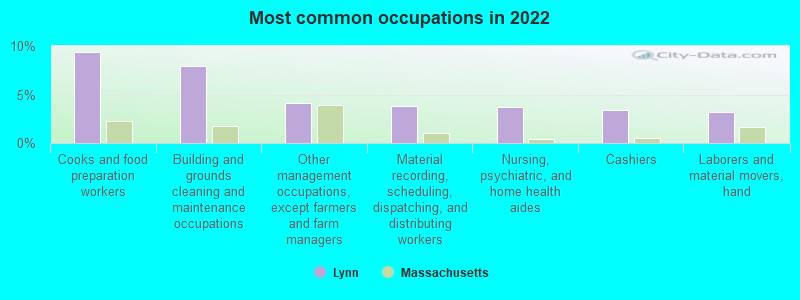
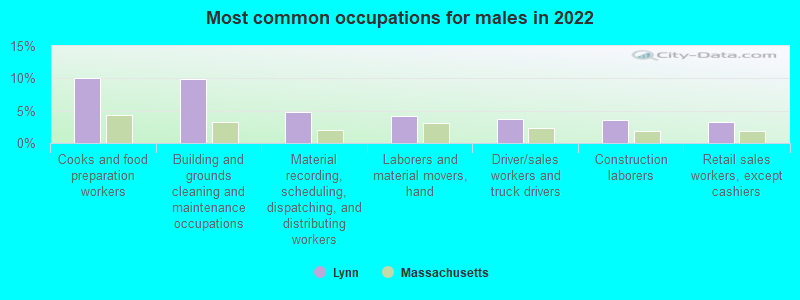
#28 on the list of "Top 101 cities with largest percentage of males in occupations: building and grounds cleaning and maintenance occupations (population 50,000+)"
#40 on the list of "Top 101 cities with largest percentage of females in occupations: healthcare support occupations (population 50,000+)"
#42 on the list of "Top 101 cities with largest percentage of females in occupations: food preparation and serving related occupations (population 50,000+)"
#44 on the list of "Top 101 cities with largest percentage of males in occupations: food preparation and serving related occupations (population 50,000+)"
#56 on the list of "Top 101 cities with the least cars per house, population 50,000+"
#57 on the list of "Top 101 cities with the lowest percentage of workers working at home, population 50,000+"
#57 on the list of "Top 101 cities with largest percentage of females in industries: fuel dealers (population 50,000+)"
#58 on the list of "Top 101 cities with largest percentage of females in industries: farm supplies merchant wholesalers (population 50,000+)"
#59 on the list of "Top 101 cities with largest percentage of females in industries: petroleum and coal products (population 50,000+)"
#44 (01906) on the list of "Top 101 zip codes with the largest percentage of Irish first ancestries (pop 5,000+)"
#69 (01940) on the list of "Top 101 zip codes with the largest percentage of Greek first ancestries (pop 5,000+)"
#21 on the list of "Top 101 counties with the lowest percentage of residents that keep firearms around their homes"
#21 on the list of "Top 101 counties with the most Orthodox adherents"
#23 on the list of "Top 101 counties with the highest carbon monoxide air pollution readings in 2012 (ppm)"
#30 on the list of "Top 101 counties with the most Catholic adherents"
#36 on the list of "Top 101 counties with the most Orthodox congregations (pop. 50,000+)"


 Recent articles from our blog. Our writers, many of them Ph.D. graduates or candidates, create easy-to-read articles on a wide variety of topics.

 (12.6 miles

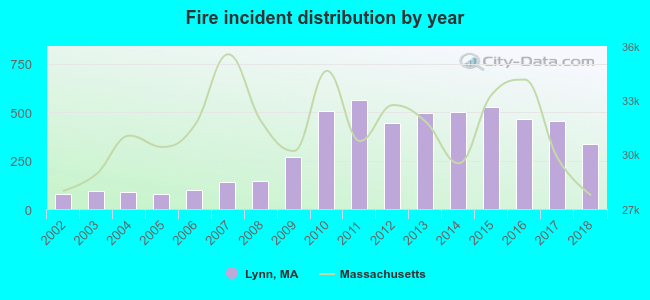 According to the data from the years 2002 - 2018 the average number of fire incidents per year is 310. The highest number of reported fires - 561 took place in 2011, and the least - 76 in 2005. The data has an increasing trend.
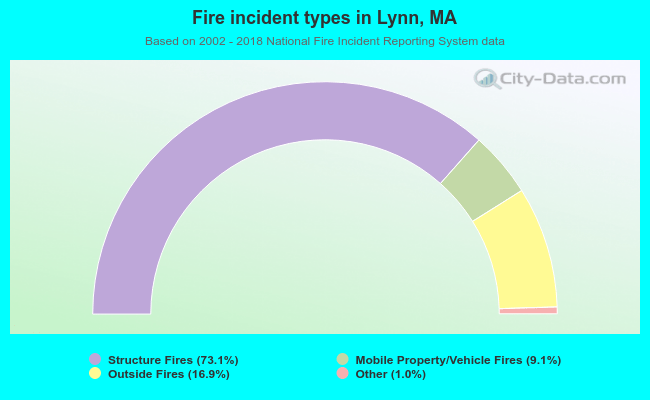 When looking into fire subcategories, the most reports belonged to: Structure Fires (73.1%), and Outside Fires (16.9%).