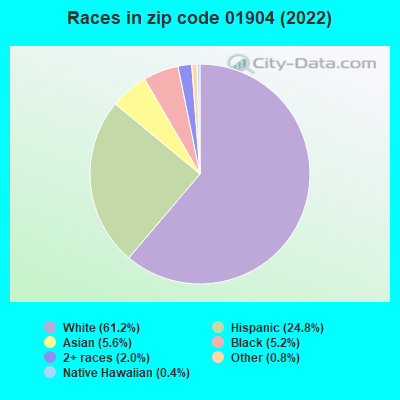
Estimated zip code population in 2022: 20,071 Zip code population in 2010: 18,203 Zip code population in 2000: 17,818
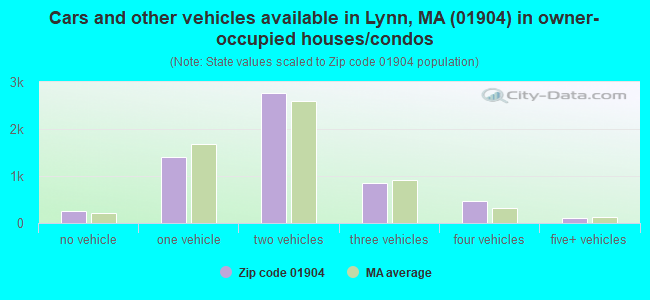
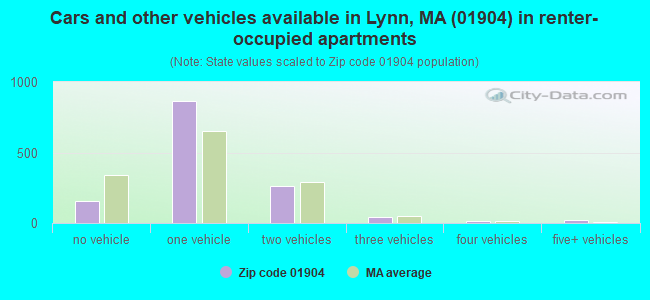
Houses and condos: 7,326 Renter-occupied apartments: 1,349
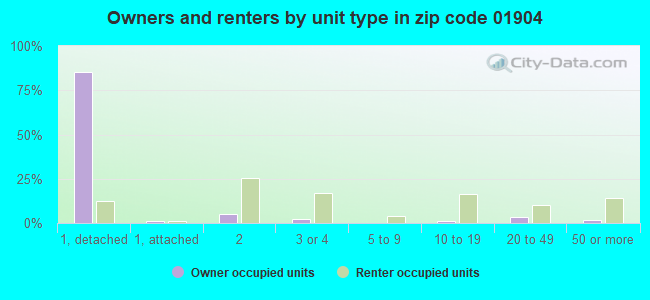
% of renters here:
19%
State:
38%
March 2022 cost of living index in zip code 01904: 133.5 (high, U.S. average is 100)
Land area: 4.5 sq. mi. Water area: 0.5 sq. mi.
Population density: 4,440 people per square mile
(average).
OSM Map
Google Map
MSN Map
OSM Map
General Map
Google Map
MSN Map
OSM Map
Google Map
MSN Map
OSM Map
Google Map
MSN Map
Please wait while loading the map...
Real estate property taxes paid for housing units in 2022:
This zip code:
1.1% ($5,583)
Massachusetts:
1.0% ($5,536)
Median real estate property taxes paid for housing units with mortgages in 2022: $5,576 (1.0%) Median real estate property taxes paid for housing units with no mortgage in 2022: $5,602 (1.2%)
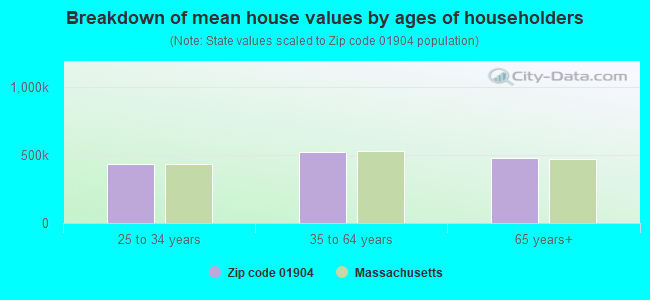
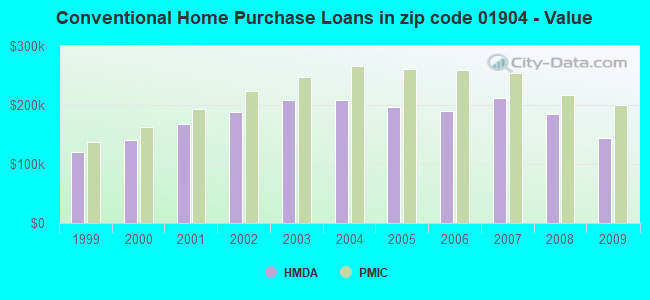
Estimated median house/condo value in 2022: $523,429
01904:
$523,429
Massachusetts:
$534,700
According to our research of Massachusetts and other state lists, there were 6 registered sex offenders living in 01904 zip code as of April 26, 2024. The ratio of all residents to sex offenders in zip code 01904 is 2,891 to 1. The ratio of registered sex offenders to all residents in this zip code is lower than the state average.
Median resident age:
This zip code:
41.3 years
Massachusetts median age:
40.3 years
Average household size:
This zip code:
2.8 people
Massachusetts:
2.4 people
Averages for the 2020 tax year for zip code 01904, filed in 2021:
Average Adjusted Gross Income (AGI) in 2020: $65,189 (Individual Income Tax Returns)
Here:
$65,189
State:
$105,130
Salary/wage: $58,015 (reported on 83.2% of returns)
Here:
$58,015
State:
$82,951
(% of AGI for various income ranges: 1126.9% for AGIs below $25k, 3530.8% for AGIs $25k-50k, 6211.2% for AGIs $50k-75k, 9042.1% for AGIs $75k-100k, 17612.1% for AGIs $100k-200k, 73311.1% for AGIs over 200k)
Taxable interest for individuals: $782 (reported on 31.0% of returns)
This zip code:
$782
Massachusetts:
$2,361
(% of AGI for various income ranges: 16.2% for AGIs below $25k, 12.6% for AGIs $25k-50k, 33.5% for AGIs $50k-75k, 46.5% for AGIs $75k-100k, 68.9% for AGIs $100k-200k, 468.9% for AGIs over 200k)
Ordinary dividends: $2,187 (reported on 15.2% of returns)
Here:
$2,187
State:
$10,365
(% of AGI for various income ranges: 13.3% for AGIs below $25k, 18.2% for AGIs $25k-50k, 37.2% for AGIs $50k-75k, 69.5% for AGIs $75k-100k, 97.9% for AGIs $100k-200k, 858.9% for AGIs over 200k)
Net capital gain/loss in AGI: +$11,410 (reported on 12.6% of returns)
Here:
+$11,410
State:
+$48,178
(% of AGI for various income ranges: 4.3% for AGIs below $25k, 19.1% for AGIs $25k-50k, 36.5% for AGIs $50k-75k, 87.5% for AGIs $75k-100k, 273.4% for AGIs $100k-200k, 12456.7% for AGIs over 200k)
Profit/loss from business: +$10,386 (reported on 14.3% of returns)
Here:
+$10,386
State:
+$20,792
(% of AGI for various income ranges: 117.8% for AGIs below $25k, 174.1% for AGIs $25k-50k, 196.1% for AGIs $50k-75k, 156.8% for AGIs $75k-100k, 379.1% for AGIs $100k-200k, 2120.0% for AGIs over 200k)
Taxable individual retirement arrangement distribution: $16,161 (reported on 7.5% of returns)
01904:
$16,161
Massachusetts:
$22,790
(% of AGI for various income ranges: 45.4% for AGIs below $25k, 63.3% for AGIs $25k-50k, 133.6% for AGIs $50k-75k, 247.8% for AGIs $75k-100k, 426.6% for AGIs $100k-200k, 2446.7% for AGIs over 200k)
Self-employed (Keogh) retirement plans: $10,200 (reported on 0.2% of returns)
01904:
$10,200
Massachusetts:
$26,868
(% of AGI for various income ranges: 9.7% for AGIs $25k-50k)
Total itemized deductions: $24,129 (reported on 13.1% of returns)
Here:
$24,129
State:
$36,722
(% of AGI for various income ranges: 67.0% for AGIs below $25k, 177.4% for AGIs $25k-50k, 525.7% for AGIs $50k-75k, 799.4% for AGIs $75k-100k, 1054.4% for AGIs $100k-200k, 3571.1% for AGIs over 200k)
Charity contributions: $3,099 (reported on 9.2% of returns)
Here:
$3,099
State:
$12,529
(% of AGI for various income ranges: 2.3% for AGIs below $25k, 9.2% for AGIs $25k-50k, 25.3% for AGIs $50k-75k, 52.1% for AGIs $75k-100k, 119.3% for AGIs $100k-200k, 791.1% for AGIs over 200k)
Taxes paid: $8,339 (reported on 13.1% of returns)
01904:
$8,339
State:
$8,782
(% of AGI for various income ranges: 15.3% for AGIs below $25k, 53.2% for AGIs $25k-50k, 171.4% for AGIs $50k-75k, 307.4% for AGIs $75k-100k, 400.3% for AGIs $100k-200k, 990.0% for AGIs over 200k)
Earned income credit: $2,080 (reported on 11.0% of returns)
Here:
$2,080
State:
$1,909
(% of AGI for various income ranges: 72.3% for AGIs below $25k, 53.4% for AGIs $25k-50k)
Percentage of individuals using paid preparers for their 2020 taxes: 92.4%
Here:
92%
State:
92%
(% for various income ranges: 89.9% for AGIs below $25k, 93.7% for AGIs $25k-50k, 93.0% for AGIs $50k-75k, 93.4% for AGIs $75k-100k, 93.1% for AGIs $100k-200k, 94.1% for AGIs over 200k)
Averages for the 2012 tax year for zip code 01904, filed in 2013:
Average Adjusted Gross Income (AGI) in 2012: $55,753 (Individual Income Tax Returns)
Here:
$55,753
State:
$81,425
Salary/wage: $51,177 (reported on 85.6% of returns)
Here:
$51,177
State:
$64,752
(% of AGI for various income ranges: 71.5% for AGIs below $25k, 80.1% for AGIs $25k-50k, 77.2% for AGIs $50k-75k, 79.4% for AGIs $75k-100k, 83.7% for AGIs $100k-200k, 60.6% for AGIs over 200k)
Taxable interest for individuals: $778 (reported on 37.8% of returns)
This zip code:
$778
Massachusetts:
$2,136
(% of AGI for various income ranges: 1.2% for AGIs below $25k, 0.6% for AGIs $25k-50k, 0.6% for AGIs $50k-75k, 0.5% for AGIs $75k-100k, 0.4% for AGIs $100k-200k, 0.5% for AGIs over 200k)
Ordinary dividends: $2,271 (reported on 19.1% of returns)
Here:
$2,271
State:
$9,473
(% of AGI for various income ranges: 1.5% for AGIs below $25k, 0.9% for AGIs $25k-50k, 0.8% for AGIs $50k-75k, 0.7% for AGIs $75k-100k, 0.6% for AGIs $100k-200k, 0.8% for AGIs over 200k)
Net capital gain/loss in AGI: +$2,012 (reported on 11.7% of returns)
Here:
+$2,012
State:
+$31,437
(% of AGI for various income ranges: 0.2% for AGIs $50k-75k, 0.3% for AGIs $75k-100k, 0.7% for AGIs $100k-200k, 1.2% for AGIs over 200k)
Profit/loss from business: +$12,478 (reported on 11.5% of returns)
Here:
+$12,478
State:
+$20,662
(% of AGI for various income ranges: 6.6% for AGIs below $25k, 2.4% for AGIs $25k-50k, 2.7% for AGIs $50k-75k, 2.3% for AGIs $75k-100k, 1.9% for AGIs $100k-200k, 2.8% for AGIs over 200k)
Taxable individual retirement arrangement distribution: $11,490 (reported on 9.4% of returns)
01904:
$11,490
Massachusetts:
$18,892
(% of AGI for various income ranges: 2.8% for AGIs below $25k, 2.1% for AGIs $25k-50k, 2.2% for AGIs $50k-75k, 1.4% for AGIs $75k-100k, 1.6% for AGIs $100k-200k, 2.7% for AGIs over 200k)
Self-employment retirement plans: $8,375 (reported on 0.4% of returns)
01904:
$8,375
Massachusetts:
$20,669
Total itemized deductions: $20,164 (22% of AGI, reported on 41.3% of returns)
Here:
$20,164
State:
$28,907
Here:
22.2% of AGI
State:
18.2% of AGI
(% of AGI for various income ranges: 10.2% for AGIs below $25k, 12.1% for AGIs $25k-50k, 15.2% for AGIs $50k-75k, 16.6% for AGIs $75k-100k, 16.7% for AGIs $100k-200k, 12.6% for AGIs over 200k)
Charity contributions: $1,784 (reported on 34.3% of returns)
Here:
$1,784
State:
$4,208
(% of AGI for various income ranges: 0.6% for AGIs below $25k, 0.9% for AGIs $25k-50k, 1.0% for AGIs $50k-75k, 1.0% for AGIs $75k-100k, 1.4% for AGIs $100k-200k, 0.9% for AGIs over 200k)
Taxes paid: $8,463 (reported on 41.2% of returns)
01904:
$8,463
State:
$13,303
(% of AGI for various income ranges: 2.9% for AGIs below $25k, 3.9% for AGIs $25k-50k, 5.8% for AGIs $50k-75k, 7.0% for AGIs $75k-100k, 7.8% for AGIs $100k-200k, 6.4% for AGIs over 200k)
Earned income credit: $2,033 (reported on 12.8% of returns)
Here:
$2,033
State:
$1,971
(% of AGI for various income ranges: 4.9% for AGIs below $25k, 0.8% for AGIs $25k-50k)
Percentage of individuals using paid preparers for their 2012 taxes: 60.4%
Here:
60%
State:
56%
(% for various income ranges: 56.1% for AGIs below $25k, 60.2% for AGIs $25k-50k, 63.1% for AGIs $50k-75k, 63.0% for AGIs $75k-100k, 64.8% for AGIs $100k-200k, 71.4% for AGIs over 200k)
Averages for the 2004 tax year for zip code 01904, filed in 2005:
Average Adjusted Gross Income (AGI) in 2004: $47,566 (Individual Income Tax Returns)
Here:
$47,566
State:
$62,877
Salary/wage: $44,876 (reported on 85.7% of returns)
Here:
$44,876
State:
$52,969
(% of AGI for various income ranges: 93.3% for AGIs below $10k, 70.9% for AGIs $10k-25k, 79.8% for AGIs $25k-50k, 81.7% for AGIs $50k-75k, 86.8% for AGIs $75k-100k, 78.5% for AGIs over 100k)
Taxable interest for individuals: $1,079 (reported on 58.0% of returns)
This zip code:
$1,079
Massachusetts:
$1,945
(% of AGI for various income ranges: 4.5% for AGIs below $10k, 3.1% for AGIs $10k-25k, 1.5% for AGIs $25k-50k, 1.3% for AGIs $50k-75k, 0.7% for AGIs $75k-100k, 1.1% for AGIs over 100k)
Taxable dividends: $1,883 (reported on 24.7% of returns)
Here:
$1,883
State:
$5,323
(% of AGI for various income ranges: 2.4% for AGIs below $10k, 1.8% for AGIs $10k-25k, 1.1% for AGIs $25k-50k, 0.9% for AGIs $50k-75k, 0.7% for AGIs $75k-100k, 0.9% for AGIs over 100k)
Net capital gain/loss: +$6,116 (reported on 16.7% of returns)
Here:
+$6,116
State:
+$20,377
(% of AGI for various income ranges: -1.6% for AGIs below $10k, -0.1% for AGIs $10k-25k, 0.4% for AGIs $25k-50k, 0.7% for AGIs $50k-75k, 0.9% for AGIs $75k-100k, 6.2% for AGIs over 100k)
Profit/loss from business: +$11,711 (reported on 12.2% of returns)
Here:
+$11,711
State:
+$17,837
(% of AGI for various income ranges: 6.6% for AGIs below $10k, 5.8% for AGIs $10k-25k, 3.4% for AGIs $25k-50k, 3.2% for AGIs $50k-75k, 1.8% for AGIs $75k-100k, 2.6% for AGIs over 100k)
IRA payment deduction: $3,150 (reported on 2.3% of returns)
01904:
$3,150
Massachusetts:
$3,100
(% of AGI for various income ranges: 0.3% for AGIs $10k-25k, 0.2% for AGIs $25k-50k, 0.2% for AGIs $50k-75k, 0.1% for AGIs $75k-100k, 0.1% for AGIs over 100k)
Self-employed pension: $8,625 (reported on 0.6% of returns)
Here:
$8,625
Massachusetts:
$14,516
(% of AGI for various income ranges: 0.1% for AGIs $25k-50k, 0.1% for AGIs $50k-75k, 0.1% for AGIs $75k-100k, 0.2% for AGIs over 100k)
Total itemized deductions: $17,868 (24% of AGI, reported on 45.1% of returns)
Here:
$17,868
State:
$22,573
Here:
24.1% of AGI
State:
19.5% of AGI
(% of AGI for various income ranges: 12.3% for AGIs below $10k, 13.4% for AGIs $10k-25k, 15.3% for AGIs $25k-50k, 18.2% for AGIs $50k-75k, 19.2% for AGIs $75k-100k, 16.6% for AGIs over 100k)
Charity contributions deductions: $1,859 (2% of AGI, reported on 41.5% of returns)
Here:
$1,859
State:
$3,295
Here:
2.4% of AGI
State:
2.7% of AGI
(% of AGI for various income ranges: 0.7% for AGIs below $10k, 1.0% for AGIs $10k-25k, 1.3% for AGIs $25k-50k, 1.5% for AGIs $50k-75k, 1.7% for AGIs $75k-100k, 2.0% for AGIs over 100k)
Total tax: $5,961 (reported on 81.7% of returns)
01904:
$5,961
State:
$11,494
(% of AGI for various income ranges: 2.7% for AGIs below $10k, 4.5% for AGIs $10k-25k, 7.8% for AGIs $25k-50k, 9.5% for AGIs $50k-75k, 10.1% for AGIs $75k-100k, 14.4% for AGIs over 100k)
Earned income credit: $1,615 (reported on 9.2% of returns)
Here:
$1,615
State:
$1,518
Percentage of individuals using paid preparers for their 2004 taxes: 61.5%
Here:
62%
State:
58%
(% for various income ranges: 49.0% for AGIs below $10k, 62.2% for AGIs $10k-25k, 60.7% for AGIs $25k-50k, 65.6% for AGIs $50k-75k, 66.3% for AGIs $75k-100k, 69.7% for AGIs over 100k)
Likely homosexual households (counted as self-reported same-sex unmarried-partner households)
Lesbian couples: 0.2% of all households
Gay men: 0.2% of all households
Household received Food Stamps/SNAP in the past 12 months: 1,076 Household did not receive Food Stamps/SNAP in the past 12 months: 6,140
Women who had a birth in the past 12 months: 201 (96 now married, 95 unmarried) Women who did not have a birth in the past 12 months: 4,224 (1,528 now married, 2,696 unmarried)
Housing units in zip code 01904 with a mortgage: 4,115 (504 second mortgage, 31 home equity loan, 451 both second mortgage and home equity loan) Houses without a mortgage: 223
Median monthly owner costs for units with a mortgage: $2,485 Median monthly owner costs for units without a mortgage: $1,003
Residents with income below the poverty level in 2022:
This zip code:
8.7%
Whole state:
10.4%
Residents with income below 50% of the poverty level in 2022:
This zip code:
3.3%
Whole state:
5.1%
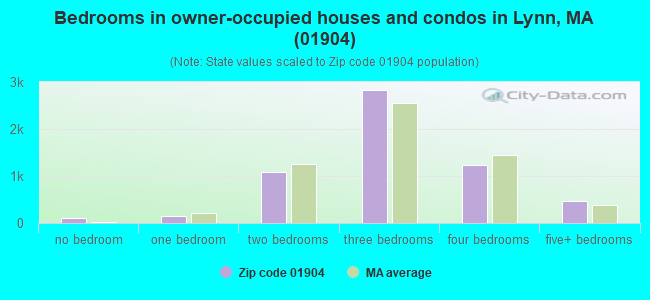
Median number of rooms in houses and condos:
Here:
6.3
State:
6.5
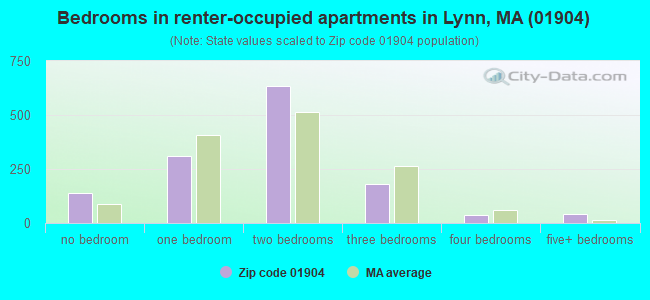
Median number of rooms in apartments:
Here:
4.4
State:
4.0
Notable locations in this zip code not listed on our city pages
Notable locations in zip code 01904: Lynngate Plaza (A), Lynn Fire Department Pine Hill Station (B), Lynn Fire Department Broadway Station (C), Shoemaker Elementary School Library (D), Lynn Fire Department Lynnfield Street Station (E). Display/hide their locations on the map
Churches in zip code 01904 include: First Spanish Free Methodist Church (A), First Lutheran Church (B), Broadway United Methodist Church (C). Display/hide their locations on the map
Lakes and reservoirs: Cedar Pond (A), Flax Pond (B), Lily Mere (C), Frog Pond (D), Walden Pond (E), Breeds Pond (F), Sluice Pond (G). Display/hide their locations on the map
In group quarters: 46 (-1 institutionalized population)
Size of family households: 1,868 2-persons, 780 3-persons, 1,414 4-persons, 634 5-persons, 289 6-persons, 89 7-or-more-persons
Size of nonfamily households: 1,620 1-person, 422 2-persons, 56 3-persons
2,463 married couples with children.
1,419 single-parent households (288 men, 1,131 women).
69.3% of residents of 01904 zip code speak English at home.
19.6% of residents speak Spanish at home (51% very well, 13% well, 21% not well, 15% not at all).
6.6% of residents speak other Indo-European language at home (74% very well, 20% well, 6% not well).
4.0% of residents speak Asian or Pacific Island language at home (52% very well, 27% well, 16% not well, 5% not at all).
0.5% of residents speak other language at home (88% very well, 12% not well).
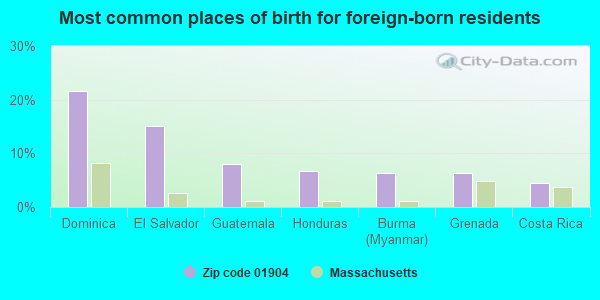
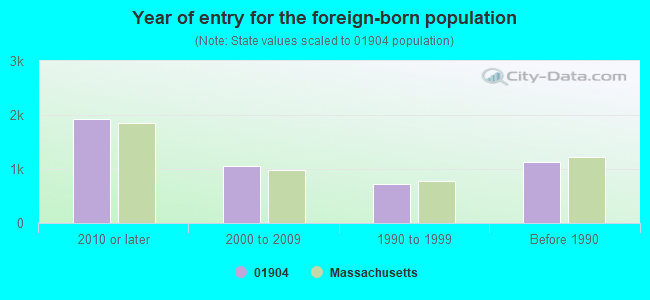
Foreign born population: 4,581 (22.8%) (56.7% of them are naturalized citizens)
Major facilities with environmental interests located in this zip code:
LYNN DPW (250 COMMERCIAL ST in LYNN, MA)
ENFORCEMENT/COMPLIANCE ACTIVITY (Integrated Compliance Information System) - ICIS-01-2003-9080, FORMAL ENFORCEMENT ACTION (Integrated Compliance Information System) - ICIS-01-2003-9080, FORMAL ENFORCEMENT ACTION (Resource Conservation and Recovery Act (tracking hazardous waste)) Organizations: CITY OF LYNN (CONTACT/OWNER)
Alternative names: CITY OF LYNN DEPARTMENT OF PUBLIC WORKS, CITY OF LYNN DEPARTMENT OF PUBLIC WORKS MAIN GARAGE, LYNN DPW MAIN GARAGE
MBTA LYNN BUS GARAGE (WESTERN AVE in LYNN, MA)
AIR MINOR (AIRS/AFS) ENFORCEMENT/COMPLIANCE ACTIVITY (Integrated Compliance Information System) (Integrated Compliance Information System) - ICIS-01-2000-0041, FORMAL ENFORCEMENT ACTION Conditionally Exempt Small Quantity Generators, less than 100 kg/month of hazardous waste (Resource Conservation and Recovery Act (tracking hazardous waste)) - notification Business SIC classification: LOCAL AND SUBURBAN TRANSIT; TRANSPORTATION SERVICES Organizations: MASS BAY TRANSPORTATION AUTHORITY (CONTACT/OWNER)
Alternative names: M B T A LYNN BUS GARAGE, MBTA LYNN GARAGE
ATLANTICARE MEDICAL (212 BOSTON ST. in LYNN, MA)
AIR MINOR (AIRS/AFS) (Resource Conservation and Recovery Act (tracking hazardous waste)) Business SIC classification: GENERAL MEDICAL AND SURGICAL HOSPITALS Organizations: ATLANTICARE MEDICAL CTR (CONTACT/OWNER)
Alternative names: ATLANTI CARE M C, ATLANTIC CARE M.C., ATLANTICARE MEDICAL CTR BSC
CAPT WILLIAM G SHOEMAKER (26 REGINA RD in LYNN, MA)
(National Center for Education Statistics) - STATE ID-163090 Organizations: LYNN (SCHOOL DISTRICT)
EDWARD A SISSON (58 CONOMO AVENUE in LYNN, MA)
(National Center for Education Statistics) - STATE ID-163095 Organizations: LYNN (SCHOOL DISTRICT)
LYNN WOODS (31 TREVETT AVENUE in LYNN, MA)
(National Center for Education Statistics) - STATE ID-163075
ADVANCE AUTO PARTS 8643 (152 BOSTON ST in LYNN, MA)
COCA COLA BOTTLING CO OF NEW ENG (654 CHESTNUT ST in LYNN, MA)
(Resource Conservation and Recovery Act (tracking hazardous waste)) Organizations: COCA COLA BOTTLING CO OF NEW ENGLAND (CONTACT/OWNER)
BOBS AUTO REPAIR (458 BOSTON ST in LYNN, MA)
(Resource Conservation and Recovery Act (tracking hazardous waste)) Organizations: ROBERT C PROUTY (CONTACT/OWNER)
BROOKS PHARMACY 548 (52 BOSTON ST in LYNN, MA)
Small Quantity Generators, between 100 kg and 1000 kg of hazardous waste/month (Resource Conservation and Recovery Act (tracking hazardous waste)) - notification Organizations: SIP LYNN JV (CONTACT/OWNER)
, PJC REALTY CO INC (CONTACT/OWNER)
MOUNT PLEASANT HOSPITAL (60 GRANITE ST in LYNN, MA)
(Resource Conservation and Recovery Act (tracking hazardous waste))
LYDIA PINKHAM TRUST (271 WESTERN AVENUE in LYNN, MA)
AIR MINOR (AIRS/AFS) CRITERIA AND HAZARDOUS AIR POLLUTANT INVENTORY (Inventory of air pollution sources) Business SIC classification: NONCLASSIFIABLE ESTABLISHMENTS
ARTIC OIL CO (WASHINGTON ST in LYNN, MA)
AIR MINOR (AIRS/AFS) Business SIC classification: PETROLEUM BULK STATIONS AND TERMINALS
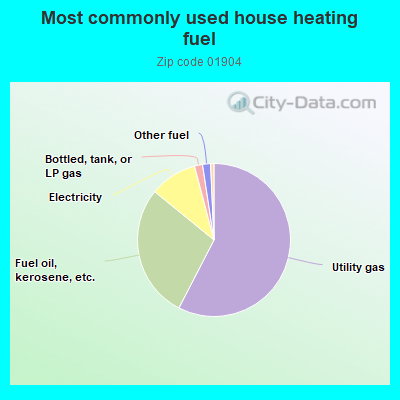
57.6%Utility gas
28.3%Fuel oil, kerosene, etc.
10.0%Electricity
1.7%Bottled, tank, or LP gas
1.7%Other fuel
Population in 1990: 17,073. Population change in the 1990s: +745 (+4.4%).
Place of birth for U.S.-born residents:
This state: 13,717
Northeast: 692
Midwest: 212
South: 345
West: 201
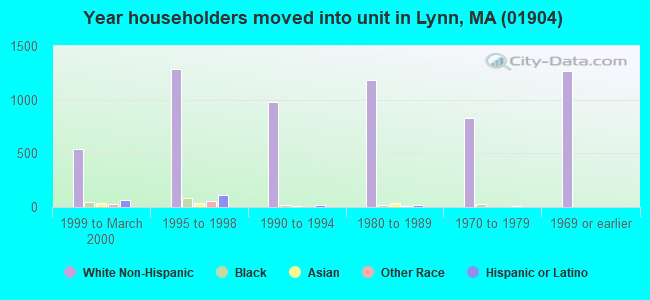
69% of the 01904 zip code residents lived in the same house 5 years ago. Out of people who lived in different houses, 74% lived in this county. Out of people who lived in different counties, 50% lived in Massachusetts.
93% of the 01904 zip code residents lived in the same house 1 year ago. Out of people who lived in different houses, 57% moved from this county. Out of people who lived in different houses, 27% moved from different county within same state. Out of people who lived in different houses, 3% moved from different state. Out of people who lived in different houses, 11% moved from abroad.
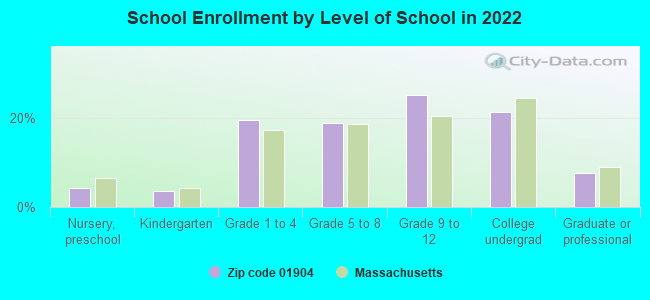
Private vs. public school enrollment:
Students in private schools in grades 1 to 8 (elementary and middle school): 190
Here:
10.6%
Massachusetts:
10.3%
Students in private schools in grades 9 to 12 (high school): 226
Here:
19.3%
Massachusetts:
12.3%
Students in private undergraduate colleges: 317
Here:
32.0%
Massachusetts:
51.2%
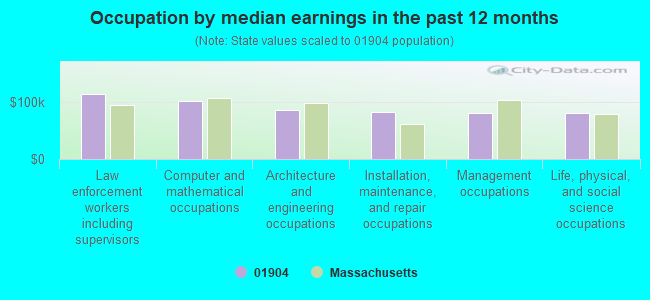
Occupation by median earnings in the past 12 months ($)
113,768Law enforcement workers including supervisors
100,548Computer and mathematical occupations
85,293Architecture and engineering occupations
81,649Installation, maintenance, and repair occupations
80,661Management occupations
79,915Life, physical, and social science occupations
Top industries in this zip code by the number of employees in 2005:
Health Care and Social Assistance: Offices of Physicians (except Mental Health Specialists) (20-49 employees: 2 establishments, 10-19 employees: 4 establishments, 5-9 employees: 8 establishments, 1-4 employees: 10 establishments)
2002 - 2018 National Fire Incident Reporting System (NFIRS) incidents
Based on the data from the years 2002 - 2018 the average number of fire incidents per year is 39. The highest number of reported fires - 76 took place in 2016, and the least - 7 in 2005. The data has a rising trend.
When looking into fire subcategories, the most reports belonged to: Structure Fires (56.1%), and Outside Fires (31.1%).
Fire incident types reported to NFIRS in Zip Code 01904


 Nearest zip codes: 01905, 01902, 01960, 01901, 01906, 01907.
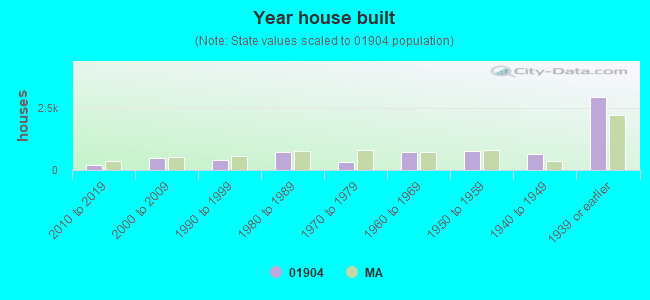


 Based on the data from the years 2002 - 2018 the average number of fire incidents per year is 39. The highest number of reported fires - 76 took place in 2016, and the least - 7 in 2005. The data has a rising trend.
 When looking into fire subcategories, the most reports belonged to: Structure Fires (56.1%), and Outside Fires (31.1%).