Estimated zip code population in 2022: 60,572 Zip code population in 2010: 51,808 Zip code population in 2000: 47,283
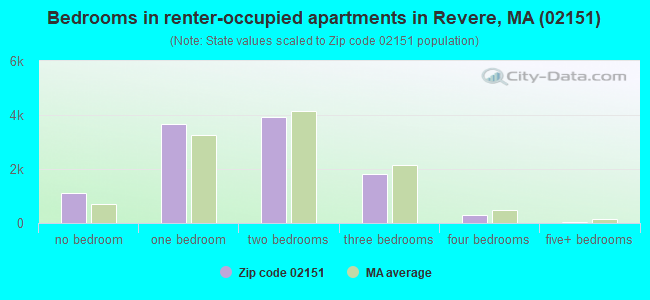
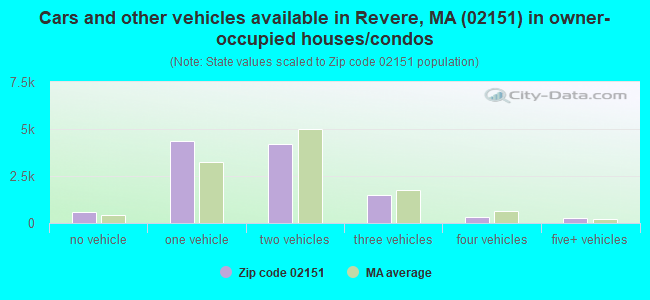
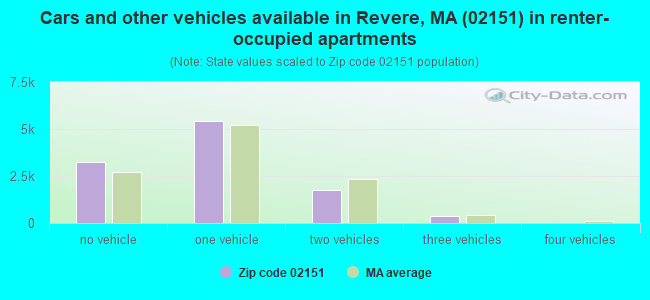
Houses and condos: 23,613 Renter-occupied apartments: 10,846
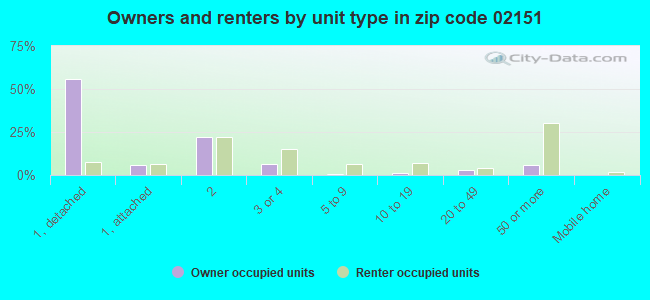
% of renters here:
49%
State:
38%
March 2022 cost of living index in zip code 02151: 136.7 (high, U.S. average is 100)
Land area: 5.9 sq. mi. Water area: 1.3 sq. mi.
Population density: 10,333 people per square mile
(high).
OSM Map
Google Map
MSN Map
OSM Map
General Map
Google Map
MSN Map
OSM Map
Google Map
MSN Map
OSM Map
Google Map
MSN Map
Please wait while loading the map...
Real estate property taxes paid for housing units in 2022:
This zip code:
1.0% ($5,493)
Massachusetts:
1.0% ($5,536)
Median real estate property taxes paid for housing units with mortgages in 2022: $5,474 (0.9%) Median real estate property taxes paid for housing units with no mortgage in 2022: $5,528 (1.0%)
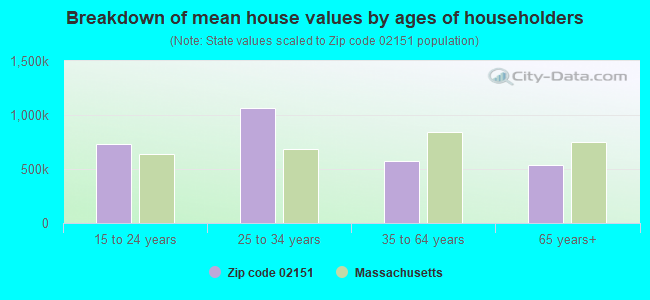
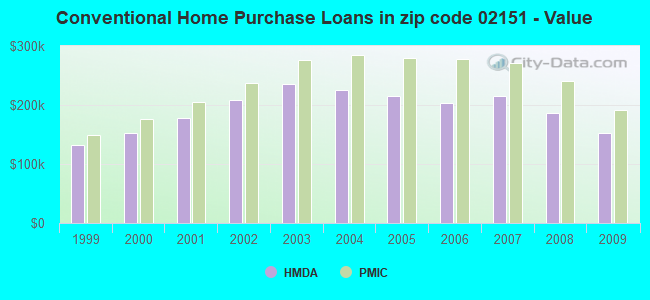
Estimated median house/condo value in 2022: $573,043
02151:
$573,043
Massachusetts:
$534,700
According to our research of Massachusetts and other state lists, there were 37 registered sex offenders living in 02151 zip code as of April 27, 2024. The ratio of all residents to sex offenders in zip code 02151 is 1,458 to 1. The ratio of registered sex offenders to all residents in this zip code is near the state average.
Median resident age:
This zip code:
40.1 years
Massachusetts median age:
40.3 years
Average household size:
This zip code:
2.7 people
Massachusetts:
2.4 people
Averages for the 2020 tax year for zip code 02151, filed in 2021:
Average Adjusted Gross Income (AGI) in 2020: $54,617 (Individual Income Tax Returns)
Here:
$54,617
State:
$105,130
Salary/wage: $48,469 (reported on 81.9% of returns)
Here:
$48,469
State:
$82,951
(% of AGI for various income ranges: 1166.5% for AGIs below $25k, 3494.4% for AGIs $25k-50k, 6634.2% for AGIs $50k-75k, 10102.3% for AGIs $75k-100k, 18038.4% for AGIs $100k-200k, 71565.6% for AGIs over 200k)
Taxable interest for individuals: $1,054 (reported on 23.2% of returns)
This zip code:
$1,054
Massachusetts:
$2,361
(% of AGI for various income ranges: 15.3% for AGIs below $25k, 15.9% for AGIs $25k-50k, 24.4% for AGIs $50k-75k, 50.7% for AGIs $75k-100k, 97.3% for AGIs $100k-200k, 993.3% for AGIs over 200k)
Ordinary dividends: $2,859 (reported on 10.1% of returns)
Here:
$2,859
State:
$10,365
(% of AGI for various income ranges: 9.2% for AGIs below $25k, 14.2% for AGIs $25k-50k, 19.8% for AGIs $50k-75k, 54.1% for AGIs $75k-100k, 116.8% for AGIs $100k-200k, 1893.3% for AGIs over 200k)
Net capital gain/loss in AGI: +$15,772 (reported on 10.1% of returns)
Here:
+$15,772
State:
+$48,178
(% of AGI for various income ranges: 4.8% for AGIs below $25k, 18.0% for AGIs $25k-50k, 53.3% for AGIs $50k-75k, 106.5% for AGIs $75k-100k, 414.3% for AGIs $100k-200k, 19883.9% for AGIs over 200k)
Profit/loss from business: +$10,929 (reported on 19.0% of returns)
Here:
+$10,929
State:
+$20,792
(% of AGI for various income ranges: 233.0% for AGIs below $25k, 244.5% for AGIs $25k-50k, 270.9% for AGIs $50k-75k, 293.1% for AGIs $75k-100k, 524.9% for AGIs $100k-200k, 4287.8% for AGIs over 200k)
Taxable individual retirement arrangement distribution: $15,137 (reported on 4.2% of returns)
02151:
$15,137
Massachusetts:
$22,790
(% of AGI for various income ranges: 28.4% for AGIs below $25k, 42.5% for AGIs $25k-50k, 76.4% for AGIs $50k-75k, 164.6% for AGIs $75k-100k, 337.4% for AGIs $100k-200k, 1367.8% for AGIs over 200k)
Self-employed (Keogh) retirement plans: $13,967 (reported on 0.2% of returns)
02151:
$13,967
Massachusetts:
$26,868
(% of AGI for various income ranges: 4.5% for AGIs $25k-50k, 27.8% for AGIs $100k-200k)
Total itemized deductions: $24,600 (reported on 7.1% of returns)
Here:
$24,600
State:
$36,722
(% of AGI for various income ranges: 45.3% for AGIs below $25k, 101.3% for AGIs $25k-50k, 277.1% for AGIs $50k-75k, 485.2% for AGIs $75k-100k, 931.8% for AGIs $100k-200k, 3693.3% for AGIs over 200k)
Charity contributions: $3,487 (reported on 4.9% of returns)
Here:
$3,487
State:
$12,529
(% of AGI for various income ranges: 2.4% for AGIs below $25k, 5.8% for AGIs $25k-50k, 20.7% for AGIs $50k-75k, 46.0% for AGIs $75k-100k, 102.0% for AGIs $100k-200k, 611.7% for AGIs over 200k)
Taxes paid: $8,020 (reported on 7.1% of returns)
02151:
$8,020
State:
$8,782
(% of AGI for various income ranges: 10.5% for AGIs below $25k, 30.7% for AGIs $25k-50k, 87.5% for AGIs $50k-75k, 168.0% for AGIs $75k-100k, 328.7% for AGIs $100k-200k, 1074.4% for AGIs over 200k)
Earned income credit: $1,987 (reported on 13.4% of returns)
Here:
$1,987
State:
$1,909
(% of AGI for various income ranges: 73.7% for AGIs below $25k, 55.6% for AGIs $25k-50k, 0.9% for AGIs $50k-75k)
Percentage of individuals using paid preparers for their 2020 taxes: 89.5%
Here:
90%
State:
92%
(% for various income ranges: 84.3% for AGIs below $25k, 90.7% for AGIs $25k-50k, 92.3% for AGIs $50k-75k, 93.7% for AGIs $75k-100k, 93.5% for AGIs $100k-200k, 92.3% for AGIs over 200k)
Averages for the 2012 tax year for zip code 02151, filed in 2013:
Average Adjusted Gross Income (AGI) in 2012: $43,233 (Individual Income Tax Returns)
Here:
$43,233
State:
$81,425
Salary/wage: $40,527 (reported on 84.1% of returns)
Here:
$40,527
State:
$64,752
(% of AGI for various income ranges: 72.7% for AGIs below $25k, 83.8% for AGIs $25k-50k, 83.9% for AGIs $50k-75k, 83.0% for AGIs $75k-100k, 80.9% for AGIs $100k-200k, 42.3% for AGIs over 200k)
Taxable interest for individuals: $972 (reported on 28.2% of returns)
This zip code:
$972
Massachusetts:
$2,136
(% of AGI for various income ranges: 0.9% for AGIs below $25k, 0.5% for AGIs $25k-50k, 0.6% for AGIs $50k-75k, 0.6% for AGIs $75k-100k, 0.7% for AGIs $100k-200k, 0.7% for AGIs over 200k)
Ordinary dividends: $2,322 (reported on 11.4% of returns)
Here:
$2,322
State:
$9,473
(% of AGI for various income ranges: 0.7% for AGIs below $25k, 0.4% for AGIs $25k-50k, 0.5% for AGIs $50k-75k, 0.5% for AGIs $75k-100k, 0.7% for AGIs $100k-200k, 1.6% for AGIs over 200k)
Net capital gain/loss in AGI: +$5,624 (reported on 8.1% of returns)
Here:
+$5,624
State:
+$31,437
(% of AGI for various income ranges: 0.3% for AGIs $50k-75k, 0.3% for AGIs $75k-100k, 1.4% for AGIs $100k-200k, 9.4% for AGIs over 200k)
Profit/loss from business: +$12,715 (reported on 13.7% of returns)
Here:
+$12,715
State:
+$20,662
(% of AGI for various income ranges: 13.1% for AGIs below $25k, 4.5% for AGIs $25k-50k, 2.3% for AGIs $50k-75k, 2.0% for AGIs $75k-100k, 1.9% for AGIs $100k-200k, 3.1% for AGIs over 200k)
Taxable individual retirement arrangement distribution: $11,856 (reported on 6.4% of returns)
02151:
$11,856
Massachusetts:
$18,892
(% of AGI for various income ranges: 2.1% for AGIs below $25k, 1.3% for AGIs $25k-50k, 1.4% for AGIs $50k-75k, 1.8% for AGIs $75k-100k, 2.0% for AGIs $100k-200k, 3.0% for AGIs over 200k)
Self-employment retirement plans: $14,600 (reported on 0.2% of returns)
02151:
$14,600
Massachusetts:
$20,669
Total itemized deductions: $18,324 (23% of AGI, reported on 25.6% of returns)
Here:
$18,324
State:
$28,907
Here:
23.4% of AGI
State:
18.2% of AGI
(% of AGI for various income ranges: 7.7% for AGIs below $25k, 8.2% for AGIs $25k-50k, 11.3% for AGIs $50k-75k, 13.6% for AGIs $75k-100k, 13.7% for AGIs $100k-200k, 10.5% for AGIs over 200k)
Charity contributions: $1,784 (reported on 19.3% of returns)
Here:
$1,784
State:
$4,208
(% of AGI for various income ranges: 0.4% for AGIs below $25k, 0.6% for AGIs $25k-50k, 0.8% for AGIs $50k-75k, 1.0% for AGIs $75k-100k, 1.0% for AGIs $100k-200k, 1.4% for AGIs over 200k)
Taxes paid: $7,147 (reported on 25.6% of returns)
02151:
$7,147
State:
$13,303
(% of AGI for various income ranges: 2.3% for AGIs below $25k, 2.5% for AGIs $25k-50k, 4.0% for AGIs $50k-75k, 5.4% for AGIs $75k-100k, 6.3% for AGIs $100k-200k, 6.1% for AGIs over 200k)
Earned income credit: $2,017 (reported on 18.5% of returns)
Here:
$2,017
State:
$1,971
(% of AGI for various income ranges: 5.7% for AGIs below $25k, 0.8% for AGIs $25k-50k)
Percentage of individuals using paid preparers for their 2012 taxes: 64.9%
Here:
65%
State:
56%
(% for various income ranges: 64.0% for AGIs below $25k, 63.5% for AGIs $25k-50k, 66.7% for AGIs $50k-75k, 66.7% for AGIs $75k-100k, 68.1% for AGIs $100k-200k, 85.0% for AGIs over 200k)
Averages for the 2004 tax year for zip code 02151, filed in 2005:
Average Adjusted Gross Income (AGI) in 2004: $36,947 (Individual Income Tax Returns)
Here:
$36,947
State:
$62,877
Salary/wage: $35,783 (reported on 84.5% of returns)
Here:
$35,783
State:
$52,969
(% of AGI for various income ranges: 110.6% for AGIs below $10k, 78.4% for AGIs $10k-25k, 86.2% for AGIs $25k-50k, 85.2% for AGIs $50k-75k, 85.6% for AGIs $75k-100k, 66.8% for AGIs over 100k)
Taxable interest for individuals: $1,327 (reported on 44.2% of returns)
This zip code:
$1,327
Massachusetts:
$1,945
(% of AGI for various income ranges: 6.6% for AGIs below $10k, 2.4% for AGIs $10k-25k, 1.3% for AGIs $25k-50k, 1.3% for AGIs $50k-75k, 1.2% for AGIs $75k-100k, 1.8% for AGIs over 100k)
Taxable dividends: $1,499 (reported on 15.4% of returns)
Here:
$1,499
State:
$5,323
(% of AGI for various income ranges: 1.9% for AGIs below $10k, 0.6% for AGIs $10k-25k, 0.4% for AGIs $25k-50k, 0.5% for AGIs $50k-75k, 0.6% for AGIs $75k-100k, 1.0% for AGIs over 100k)
Net capital gain/loss: +$9,110 (reported on 12.1% of returns)
Here:
+$9,110
State:
+$20,377
(% of AGI for various income ranges: -0.8% for AGIs below $10k, -0.0% for AGIs $10k-25k, 0.3% for AGIs $25k-50k, 0.7% for AGIs $50k-75k, 1.7% for AGIs $75k-100k, 13.7% for AGIs over 100k)
Profit/loss from business: +$8,908 (reported on 12.9% of returns)
Here:
+$8,908
State:
+$17,837
(% of AGI for various income ranges: 15.3% for AGIs below $10k, 6.2% for AGIs $10k-25k, 2.6% for AGIs $25k-50k, 1.8% for AGIs $50k-75k, 1.6% for AGIs $75k-100k, 3.5% for AGIs over 100k)
IRA payment deduction: $2,966 (reported on 2.1% of returns)
02151:
$2,966
Massachusetts:
$3,100
(% of AGI for various income ranges: 0.3% for AGIs below $10k, 0.2% for AGIs $10k-25k, 0.2% for AGIs $25k-50k, 0.2% for AGIs $50k-75k, 0.2% for AGIs $75k-100k, 0.1% for AGIs over 100k)
Self-employed pension: $8,373 (reported on 0.3% of returns)
Here:
$8,373
Massachusetts:
$14,516
(% of AGI for various income ranges: 0.0% for AGIs $25k-50k, 0.0% for AGIs $50k-75k, 0.1% for AGIs $75k-100k, 0.2% for AGIs over 100k)
Total itemized deductions: $16,316 (27% of AGI, reported on 30.5% of returns)
Here:
$16,316
State:
$22,573
Here:
26.5% of AGI
State:
19.5% of AGI
(% of AGI for various income ranges: 19.8% for AGIs below $10k, 11.2% for AGIs $10k-25k, 11.8% for AGIs $25k-50k, 15.3% for AGIs $50k-75k, 15.8% for AGIs $75k-100k, 13.0% for AGIs over 100k)
Charity contributions deductions: $1,742 (3% of AGI, reported on 26.1% of returns)
Here:
$1,742
State:
$3,295
Here:
2.7% of AGI
State:
2.7% of AGI
(% of AGI for various income ranges: 0.9% for AGIs below $10k, 0.8% for AGIs $10k-25k, 1.1% for AGIs $25k-50k, 1.4% for AGIs $50k-75k, 1.5% for AGIs $75k-100k, 1.4% for AGIs over 100k)
Total tax: $4,699 (reported on 76.5% of returns)
02151:
$4,699
State:
$11,494
(% of AGI for various income ranges: 4.2% for AGIs below $10k, 4.6% for AGIs $10k-25k, 7.6% for AGIs $25k-50k, 9.7% for AGIs $50k-75k, 11.0% for AGIs $75k-100k, 16.2% for AGIs over 100k)
Earned income credit: $1,527 (reported on 13.7% of returns)
Here:
$1,527
State:
$1,518
Percentage of individuals using paid preparers for their 2004 taxes: 64.0%
Here:
64%
State:
58%
(% for various income ranges: 58.4% for AGIs below $10k, 62.9% for AGIs $10k-25k, 63.2% for AGIs $25k-50k, 68.6% for AGIs $50k-75k, 70.7% for AGIs $75k-100k, 74.9% for AGIs over 100k)
Likely homosexual households (counted as self-reported same-sex unmarried-partner households)
Lesbian couples: 0.0% of all households
Gay men: 0.1% of all households
Household received Food Stamps/SNAP in the past 12 months: 4,302 Household did not receive Food Stamps/SNAP in the past 12 months: 17,868
Women who had a birth in the past 12 months: 427 (345 now married, 84 unmarried) Women who did not have a birth in the past 12 months: 13,841 (5,508 now married, 8,304 unmarried)
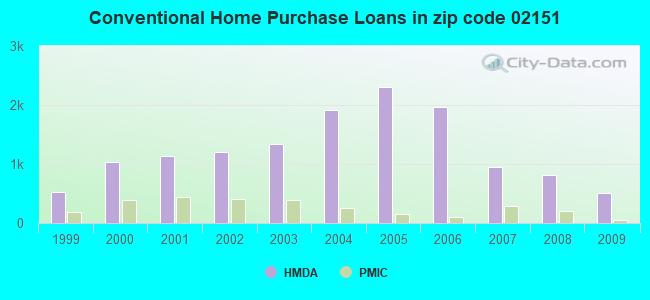
Housing units in zip code 02151 with a mortgage: 7,179 (1,027 second mortgage, 6 home equity loan, 618 both second mortgage and home equity loan) Houses without a mortgage: 284
Median monthly owner costs for units with a mortgage: $2,599 Median monthly owner costs for units without a mortgage: $991
Residents with income below the poverty level in 2022:
This zip code:
12.7%
Whole state:
10.4%
Residents with income below 50% of the poverty level in 2022:
This zip code:
6.7%
Whole state:
5.1%
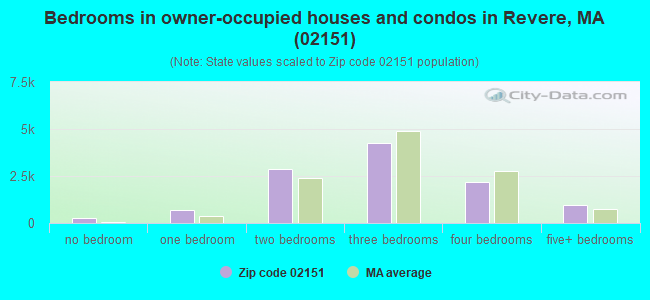
Median number of rooms in houses and condos:
Here:
5.9
State:
6.5
Median number of rooms in apartments:
Here:
3.7
State:
4.0
Notable locations in this zip code not listed on our city pages
Notable locations in zip code 02151: Brown Circle (A), Crescent Beach Station (B), Revere City Hall (C), Revere Fire Department Fire Training Facility (D), Revere Fire Department Station 5 (E), Revere Fire Department Headquarters (F), Revere Public Library (G). Display/hide their locations on the map
Churches in zip code 02151 include: Full Gospel Community Church (A), First Congregational Church (B), First Baptist Church of Revere (C). Display/hide their locations on the map
Parks in zip code 02151 include: Suffolk Downs Park (1), Fredericks Park (2), Suffolk Downs Park (3), Webner Park (4), Paul Revere Park (5). Display/hide their locations on the map
6,195 married couples with children.
3,524 single-parent households (986 men, 2,538 women).
42.3% of residents of 02151 zip code speak English at home.
37.7% of residents speak Spanish at home (39% very well, 29% well, 21% not well, 11% not at all).
14.0% of residents speak other Indo-European language at home (50% very well, 26% well, 18% not well, 6% not at all).
3.7% of residents speak Asian or Pacific Island language at home (28% very well, 23% well, 40% not well, 8% not at all).
3.7% of residents speak other language at home (53% very well, 33% well, 12% not well, 2% not at all).
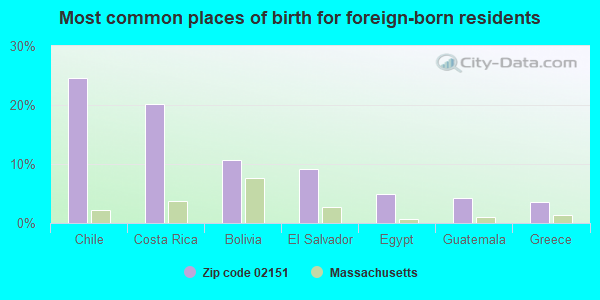
Foreign born population: 27,242 (45.0%) (42.7% of them are naturalized citizens)
This zip code:
45.0%
Whole state:
18.0%
25%Chile
20%Costa Rica
11%Bolivia
9%El Salvador
5%Egypt
4%Guatemala
4%Greece
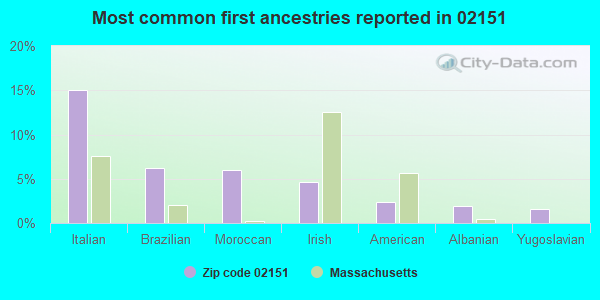
15%Italian
6%Brazilian
6%Moroccan
5%Irish
2%American
2%Albanian
2%Yugoslavian
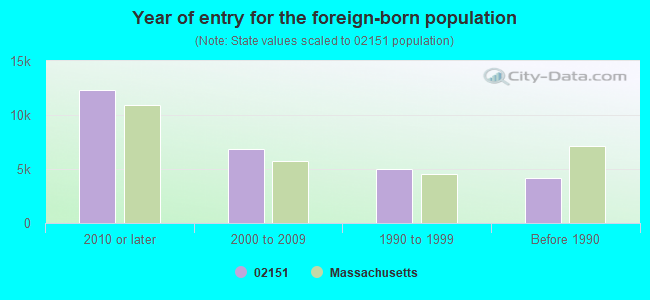
Year of entry for the foreign-born population
12,3002010 or later
6,8332000 to 2009
5,0201990 to 1999
4,208Before 1990
Major facilities with environmental interests located in this zip code:
ABRAHAM LINCOLN SCHOOL (68 TUCKERMAN STREET in REVERE, MA)
AIR MINOR (AIRS/AFS) (National Center for Education Statistics) - STATE ID-248025 CRITERIA AND HAZARDOUS AIR POLLUTANT INVENTORY (Inventory of air pollution sources) Business SIC classification: ELEMENTARY AND SECONDARY SCHOOLS Organizations: REVERE (SCHOOL DISTRICT)
YORK OLDSMOBILE INC (540 SQUIRE RD in REVERE, MA)
(Integrated Compliance Information System) - ICIS-01-1997-0089, FORMAL ENFORCEMENT ACTION (Resource Conservation and Recovery Act (tracking hazardous waste))
PAUL REVERE (395 REVERE STREET in REVERE, MA)
(National Center for Education Statistics) - STATE ID-248050
BEACHMONT (15 EVERARD STREET in REVERE, MA)
(National Center for Education Statistics) - STATE ID-248012 Organizations: REVERE (SCHOOL DISTRICT)
AUGUSTINE C WHELAN MEM (107 NEWHALL STREET in REVERE, MA)
(National Center for Education Statistics) - STATE ID-248003 Organizations: REVERE (SCHOOL DISTRICT)
NORTHGATE RECYCLING (320 CHARGER STREET in REVERE, MA)
AIR SYNTHETIC MINOR (AIRS/AFS) CRITERIA AND HAZARDOUS AIR POLLUTANT INVENTORY (Inventory of air pollution sources) National Pollutant Discharge Elimination System NON-MAJOR (Tracking pollutant discharge elimination systems) - permit Business SIC classification: BRICK, STONE, AND RELATED CONSTRUCTION MATERIALS Organizations: BFI / ALLIED WASTE (CONTACT/OPERATOR)
Alternative names: BFI / ALLIED WASTE
BOSTON GAS COMPANY (RAILROAD AVE in REVERE, MA)
AIR MINOR (AIRS/AFS) CRITERIA AND HAZARDOUS AIR POLLUTANT INVENTORY (Inventory of air pollution sources) (Resource Conservation and Recovery Act (tracking hazardous waste)) Business SIC classification: NATURAL GAS DISTRIBUTION
JAY CLEANERS (505 BROADWAY in REVERE, MA)
AIR MINOR (AIRS/AFS) (Resource Conservation and Recovery Act (tracking hazardous waste)) Business SIC classification: GARMENT PRESSING, AND AGENTS FOR LAUNDRIES AND DRYCLEANERS
JOURNAL PUBLISHING CO INC (327 BROADWAY in REVERE, MA)
(Resource Conservation and Recovery Act (tracking hazardous waste)) Business NAICS classification: PREPRESS SERVICES. Alternative names: REVERE JOURNAL INC THE
MOBIL OIL CORP SS 135 (1027 BROADWAY in REVERE, MA)
(Resource Conservation and Recovery Act (tracking hazardous waste)) Organizations: MOBIL OIL CORPORATION (CONTACT/OWNER)
ALL SEASONS TRUCKING INC (1500 SALEM ST in REVERE, MA)
MASSACHUSETTS GENERAL HOSPITAL (300 OCEAN AVE in REVERE, MA)
(Resource Conservation and Recovery Act (tracking hazardous waste)) Business NAICS classification: MEDICAL LABORATORIES. Organizations: THE GENERAL HOSPITAL CORPORATION (CONTACT/OWNER)
Alternative names: MGH REVERE HEALTH CTR
AMERICAN DISCOUNT AUTO PARTS (230 VETERANS OF FOREIGN WARS PKWY in REVERE, MA)
(Resource Conservation and Recovery Act (tracking hazardous waste)) Organizations: RITE AID CORPORATION (CONTACT/OWNER)
Housing units lacking complete plumbing facilities: 0.6% Housing units lacking complete kitchen facilities: 1.3%
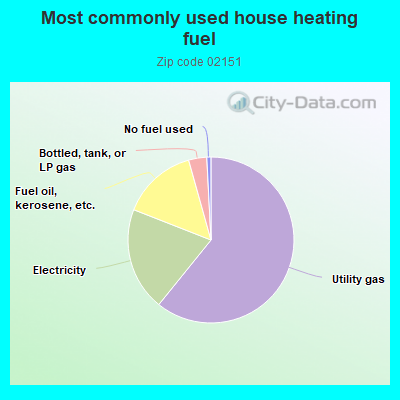
60.4%Utility gas
20.0%Electricity
14.6%Fuel oil, kerosene, etc.
3.5%Bottled, tank, or LP gas
0.8%No fuel used
Population in 1990: 42,766. Population change in the 1990s: +4,517 (+10.6%).
Place of birth for U.S.-born residents:
This state: 28,414
Northeast: 1,636
Midwest: 755
South: 965
West: 809
67% of the 02151 zip code residents lived in the same house 5 years ago. Out of people who lived in different houses, 63% lived in this county. Out of people who lived in different counties, 50% lived in Massachusetts.
88% of the 02151 zip code residents lived in the same house 1 year ago. Out of people who lived in different houses, 58% moved from this county. Out of people who lived in different houses, 19% moved from different county within same state. Out of people who lived in different houses, 8% moved from different state. Out of people who lived in different houses, 12% moved from abroad.
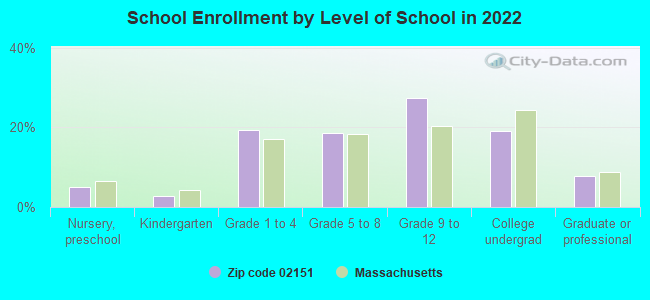
Private vs. public school enrollment:
Students in private schools in grades 1 to 8 (elementary and middle school): 489
Here:
11.1%
Massachusetts:
10.3%
Students in private schools in grades 9 to 12 (high school): 132
Here:
4.2%
Massachusetts:
12.3%
Students in private undergraduate colleges: 919
Here:
41.8%
Massachusetts:
51.2%
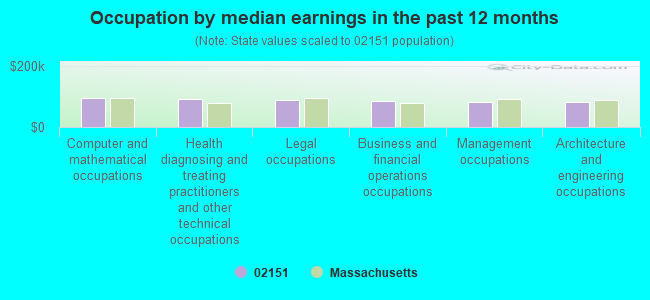
Occupation by median earnings in the past 12 months ($)
96,600Computer and mathematical occupations
92,313Health diagnosing and treating practitioners and other technical occupations
88,240Legal occupations
84,564Business and financial operations occupations
81,811Management occupations
81,703Architecture and engineering occupations
Companies with federal contracts located in this zip code:
NEW ENGLAND CONFECTIONERY COMP (135 AMERICAN LEGION HWY in REVERE, MA) : $529,104 in 5 contractsfrom 2004 to 2005
Contracts for Food Items For Resale by Defense Commissary Agency Signed by year:2000: $0; 2001: $0; 2002: $0; 2003: $0; 2004: $174,836; 2005: $354,268; 2006: $0.
Biggest contracts:
$174,836 with Defense Commissary Agency for Food Items For Resale. Signed on 2004-10-01. Completion date: 2005-02-28.
$120,360, same as above.Signed on 2005-10-01. Completion date: 2005-12-31.
$99,486, same as above.Signed on 2005-04-01. Completion date: 2005-08-31.
$83,774, same as above.Signed on 2005-01-01. Completion date: 2005-03-31.
THE WHITMOR COMPANY INC (15 WHITMOR RD in REVERE, MA; small business) : $504,775 in 43 contractsfrom 2000 to 2006
Contracts for Electrical Control Equipment, Connectors, Electrical, Circuit Breakers, Converters, Electrical, Nonrotating, and moreby Navy, Defense Logistics Agency Signed by year:2000: $25,340; 2001: $34,522; 2002: $0; 2003: $95,600; 2004: $63,554; 2005: $137,346; 2006: $148,413.
Biggest contracts:
$95,600 with Navy for Electrical Control Equipment. Signed on 2003-05-22. Completion date: 2003-07-21.
$43,296 with Navy for Connectors, Electrical. Signed on 2004-05-06. Completion date: 2004-06-21.
$37,317 with Navy for Circuit Breakers. Signed on 2005-08-30. Completion date: 2005-09-16.
$37,120 with Navy for Converters, Electrical, Nonrotating. Signed on 2006-03-21. Completion date: 2006-05-23.
Top industries in this zip code by the number of employees in 2005:
2002 - 2018 National Fire Incident Reporting System (NFIRS) incidents
Based on the data from the years 2002 - 2018 the average number of fires per year is 382. The highest number of fire incidents - 548 took place in 2006, and the least - 85 in 2003. The data has a growing trend.
When looking into fire subcategories, the most incidents belonged to: Structure Fires (71.7%), and Outside Fires (17.0%).
Fire incident types reported to NFIRS in Zip Code 02151


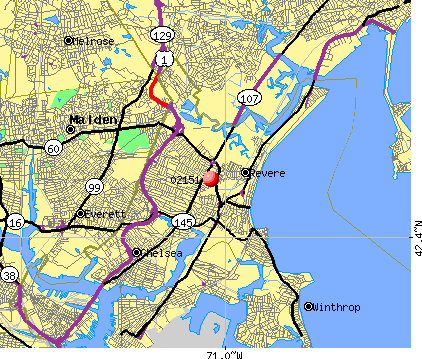 Nearest zip codes: 02150, 01906, 02152, 01905, 02149, 02128.


 Based on the data from the years 2002 - 2018 the average number of fires per year is 382. The highest number of fire incidents - 548 took place in 2006, and the least - 85 in 2003. The data has a growing trend.
 When looking into fire subcategories, the most incidents belonged to: Structure Fires (71.7%), and Outside Fires (17.0%).