Estimated zip code population in 2022: 19,024 Zip code population in 2010: 17,497 Zip code population in 2000: 18,303
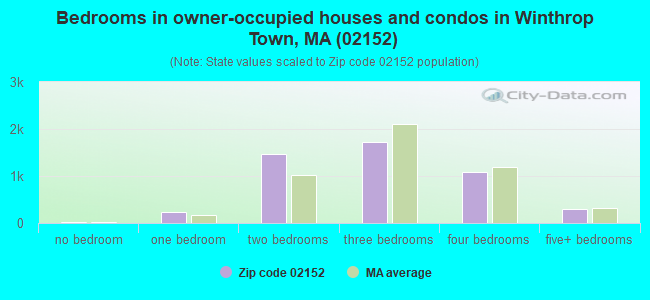
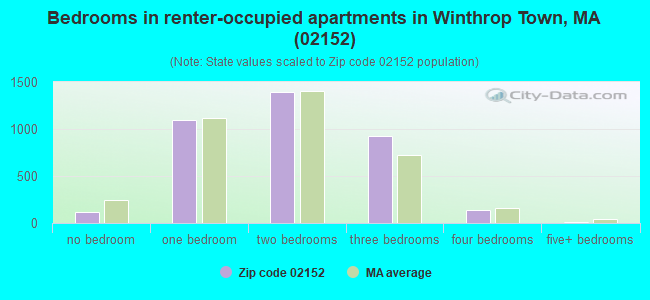
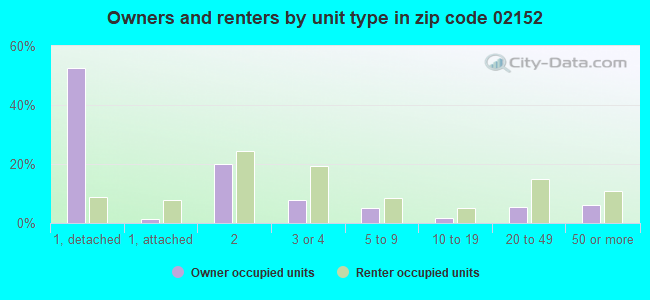
Houses and condos: 9,017 Renter-occupied apartments: 3,685
% of renters here:
43%
State:
38%
March 2022 cost of living index in zip code 02152: 135.6 (high, U.S. average is 100)
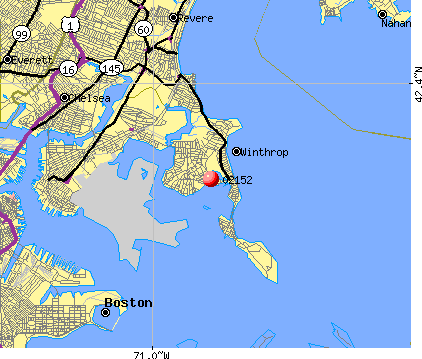
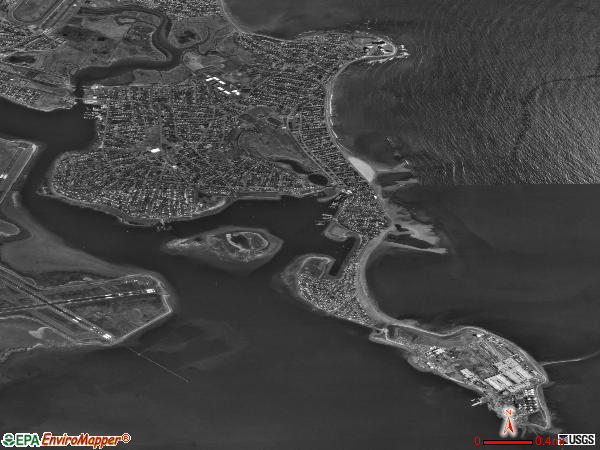
Land area: 2.0 sq. mi. Water area: 1.2 sq. mi.
Population density: 9,645 people per square mile
(high).
OSM Map
Google Map
MSN Map
OSM Map
General Map
Google Map
MSN Map
OSM Map
Google Map
MSN Map
OSM Map
Google Map
MSN Map
Please wait while loading the map...
Real estate property taxes paid for housing units in 2022:
This zip code:
1.0% ($6,128)
Massachusetts:
1.0% ($5,536)
Median real estate property taxes paid for housing units with mortgages in 2022: $6,229 (1.0%) Median real estate property taxes paid for housing units with no mortgage in 2022: $5,985 (1.0%)
Estimated median house/condo value in 2022: $622,214
02152:
$622,214
Massachusetts:
$534,700
According to our research of Massachusetts and other state lists, there were 3 registered sex offenders living in 02152 zip code as of April 27, 2024. The ratio of all residents to sex offenders in zip code 02152 is 6,096 to 1. The ratio of registered sex offenders to all residents in this zip code is much lower than the state average.
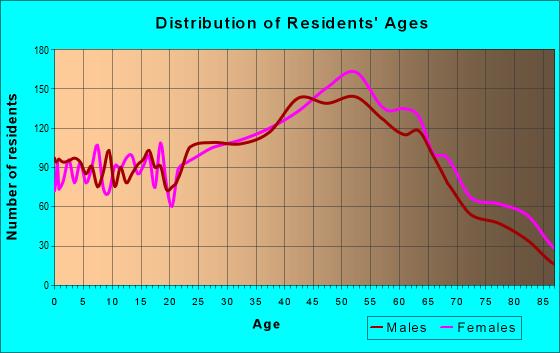
Median resident age:
This zip code:
45.3 years
Massachusetts median age:
40.3 years
Average household size:
This zip code:
2.2 people
Massachusetts:
2.4 people
Averages for the 2020 tax year for zip code 02152, filed in 2021:
Average Adjusted Gross Income (AGI) in 2020: $83,913 (Individual Income Tax Returns)
Here:
$83,913
State:
$105,130
Salary/wage: $71,771 (reported on 80.3% of returns)
Here:
$71,771
State:
$82,951
(% of AGI for various income ranges: 1034.9% for AGIs below $25k, 3519.7% for AGIs $25k-50k, 6388.5% for AGIs $50k-75k, 9603.8% for AGIs $75k-100k, 18819.6% for AGIs $100k-200k, 79638.0% for AGIs over 200k)
Taxable interest for individuals: $1,418 (reported on 35.2% of returns)
This zip code:
$1,418
Massachusetts:
$2,361
(% of AGI for various income ranges: 26.1% for AGIs below $25k, 26.6% for AGIs $25k-50k, 48.4% for AGIs $50k-75k, 80.9% for AGIs $75k-100k, 97.4% for AGIs $100k-200k, 983.5% for AGIs over 200k)
Ordinary dividends: $3,649 (reported on 20.9% of returns)
Here:
$3,649
State:
$10,365
(% of AGI for various income ranges: 26.7% for AGIs below $25k, 31.3% for AGIs $25k-50k, 65.5% for AGIs $50k-75k, 91.4% for AGIs $75k-100k, 173.5% for AGIs $100k-200k, 1719.0% for AGIs over 200k)
Net capital gain/loss in AGI: +$24,828 (reported on 18.6% of returns)
Here:
+$24,828
State:
+$48,178
(% of AGI for various income ranges: 7.7% for AGIs below $25k, 36.9% for AGIs $25k-50k, 82.5% for AGIs $50k-75k, 162.8% for AGIs $75k-100k, 462.2% for AGIs $100k-200k, 19018.0% for AGIs over 200k)
Profit/loss from business: +$14,711 (reported on 16.0% of returns)
Here:
+$14,711
State:
+$20,792
(% of AGI for various income ranges: 154.4% for AGIs below $25k, 178.7% for AGIs $25k-50k, 200.5% for AGIs $50k-75k, 304.6% for AGIs $75k-100k, 510.5% for AGIs $100k-200k, 4234.0% for AGIs over 200k)
Taxable individual retirement arrangement distribution: $17,673 (reported on 9.6% of returns)
02152:
$17,673
Massachusetts:
$22,790
(% of AGI for various income ranges: 90.2% for AGIs below $25k, 113.5% for AGIs $25k-50k, 211.8% for AGIs $50k-75k, 348.6% for AGIs $75k-100k, 497.9% for AGIs $100k-200k, 1741.5% for AGIs over 200k)
Self-employed (Keogh) retirement plans: $21,150 (reported on 0.4% of returns)
02152:
$21,150
Massachusetts:
$26,868
(% of AGI for various income ranges: 423.0% for AGIs over 200k)
Total itemized deductions: $26,395 (reported on 13.2% of returns)
Here:
$26,395
State:
$36,722
(% of AGI for various income ranges: 88.2% for AGIs below $25k, 177.9% for AGIs $25k-50k, 356.2% for AGIs $50k-75k, 668.7% for AGIs $75k-100k, 1176.5% for AGIs $100k-200k, 4578.5% for AGIs over 200k)
Charity contributions: $3,104 (reported on 10.3% of returns)
Here:
$3,104
State:
$12,529
(% of AGI for various income ranges: 4.9% for AGIs below $25k, 9.9% for AGIs $25k-50k, 24.1% for AGIs $50k-75k, 54.1% for AGIs $75k-100k, 93.6% for AGIs $100k-200k, 640.0% for AGIs over 200k)
Taxes paid: $8,763 (reported on 13.2% of returns)
02152:
$8,763
State:
$8,782
(% of AGI for various income ranges: 26.4% for AGIs below $25k, 40.6% for AGIs $25k-50k, 120.1% for AGIs $50k-75k, 238.5% for AGIs $75k-100k, 421.7% for AGIs $100k-200k, 1439.5% for AGIs over 200k)
Earned income credit: $1,622 (reported on 7.4% of returns)
Here:
$1,622
State:
$1,909
(% of AGI for various income ranges: 47.2% for AGIs below $25k, 37.1% for AGIs $25k-50k)
Percentage of individuals using paid preparers for their 2020 taxes: 91.3%
Here:
91%
State:
92%
(% for various income ranges: 88.7% for AGIs below $25k, 91.1% for AGIs $25k-50k, 91.6% for AGIs $50k-75k, 91.6% for AGIs $75k-100k, 93.4% for AGIs $100k-200k, 94.3% for AGIs over 200k)
Averages for the 2012 tax year for zip code 02152, filed in 2013:
Average Adjusted Gross Income (AGI) in 2012: $63,368 (Individual Income Tax Returns)
Here:
$63,368
State:
$81,425
Salary/wage: $56,898 (reported on 83.4% of returns)
Here:
$56,898
State:
$64,752
(% of AGI for various income ranges: 66.7% for AGIs below $25k, 77.1% for AGIs $25k-50k, 79.4% for AGIs $50k-75k, 78.0% for AGIs $75k-100k, 81.8% for AGIs $100k-200k, 58.0% for AGIs over 200k)
Taxable interest for individuals: $1,190 (reported on 39.6% of returns)
This zip code:
$1,190
Massachusetts:
$2,136
(% of AGI for various income ranges: 1.7% for AGIs below $25k, 0.7% for AGIs $25k-50k, 0.6% for AGIs $50k-75k, 0.6% for AGIs $75k-100k, 0.7% for AGIs $100k-200k, 0.8% for AGIs over 200k)
Ordinary dividends: $2,963 (reported on 20.2% of returns)
Here:
$2,963
State:
$9,473
(% of AGI for various income ranges: 2.1% for AGIs below $25k, 1.0% for AGIs $25k-50k, 0.8% for AGIs $50k-75k, 0.7% for AGIs $75k-100k, 0.8% for AGIs $100k-200k, 1.2% for AGIs over 200k)
Net capital gain/loss in AGI: +$10,535 (reported on 16.6% of returns)
Here:
+$10,535
State:
+$31,437
(% of AGI for various income ranges: 0.1% for AGIs $25k-50k, 0.3% for AGIs $50k-75k, 0.3% for AGIs $75k-100k, 1.1% for AGIs $100k-200k, 12.6% for AGIs over 200k)
Profit/loss from business: +$15,485 (reported on 12.8% of returns)
Here:
+$15,485
State:
+$20,662
(% of AGI for various income ranges: 8.7% for AGIs below $25k, 4.3% for AGIs $25k-50k, 2.3% for AGIs $50k-75k, 2.8% for AGIs $75k-100k, 2.7% for AGIs $100k-200k, 2.2% for AGIs over 200k)
Taxable individual retirement arrangement distribution: $14,308 (reported on 10.4% of returns)
02152:
$14,308
Massachusetts:
$18,892
(% of AGI for various income ranges: 3.8% for AGIs below $25k, 2.2% for AGIs $25k-50k, 1.9% for AGIs $50k-75k, 2.7% for AGIs $75k-100k, 2.4% for AGIs $100k-200k, 2.0% for AGIs over 200k)
Self-employment retirement plans: $17,400 (reported on 0.4% of returns)
02152:
$17,400
Massachusetts:
$20,669
Total itemized deductions: $21,515 (20% of AGI, reported on 36.1% of returns)
Here:
$21,515
State:
$28,907
Here:
19.7% of AGI
State:
18.2% of AGI
(% of AGI for various income ranges: 13.5% for AGIs below $25k, 8.9% for AGIs $25k-50k, 11.4% for AGIs $50k-75k, 14.0% for AGIs $75k-100k, 14.3% for AGIs $100k-200k, 10.7% for AGIs over 200k)
Charity contributions: $1,707 (reported on 29.9% of returns)
Here:
$1,707
State:
$4,208
(% of AGI for various income ranges: 0.6% for AGIs below $25k, 0.6% for AGIs $25k-50k, 0.7% for AGIs $50k-75k, 0.9% for AGIs $75k-100k, 0.9% for AGIs $100k-200k, 0.9% for AGIs over 200k)
Taxes paid: $9,691 (reported on 36.0% of returns)
02152:
$9,691
State:
$13,303
(% of AGI for various income ranges: 3.6% for AGIs below $25k, 2.8% for AGIs $25k-50k, 4.8% for AGIs $50k-75k, 5.7% for AGIs $75k-100k, 6.8% for AGIs $100k-200k, 6.6% for AGIs over 200k)
Earned income credit: $1,663 (reported on 10.0% of returns)
Here:
$1,663
State:
$1,971
(% of AGI for various income ranges: 3.4% for AGIs below $25k, 0.5% for AGIs $25k-50k)
Percentage of individuals using paid preparers for their 2012 taxes: 60.3%
Here:
60%
State:
56%
(% for various income ranges: 57.7% for AGIs below $25k, 55.9% for AGIs $25k-50k, 60.6% for AGIs $50k-75k, 64.2% for AGIs $75k-100k, 66.9% for AGIs $100k-200k, 76.9% for AGIs over 200k)
Averages for the 2004 tax year for zip code 02152, filed in 2005:
Average Adjusted Gross Income (AGI) in 2004: $49,993 (Individual Income Tax Returns)
Here:
$49,993
State:
$62,877
Salary/wage: $46,673 (reported on 83.0% of returns)
Here:
$46,673
State:
$52,969
(% of AGI for various income ranges: 92.9% for AGIs below $10k, 66.8% for AGIs $10k-25k, 82.0% for AGIs $25k-50k, 81.9% for AGIs $50k-75k, 83.0% for AGIs $75k-100k, 70.6% for AGIs over 100k)
Taxable interest for individuals: $1,362 (reported on 55.1% of returns)
This zip code:
$1,362
Massachusetts:
$1,945
(% of AGI for various income ranges: 5.9% for AGIs below $10k, 3.5% for AGIs $10k-25k, 1.6% for AGIs $25k-50k, 1.5% for AGIs $50k-75k, 1.2% for AGIs $75k-100k, 1.1% for AGIs over 100k)
Taxable dividends: $1,982 (reported on 25.9% of returns)
Here:
$1,982
State:
$5,323
(% of AGI for various income ranges: 3.7% for AGIs below $10k, 2.0% for AGIs $10k-25k, 0.9% for AGIs $25k-50k, 0.6% for AGIs $50k-75k, 0.8% for AGIs $75k-100k, 1.2% for AGIs over 100k)
Net capital gain/loss: +$8,604 (reported on 20.5% of returns)
Here:
+$8,604
State:
+$20,377
(% of AGI for various income ranges: -2.4% for AGIs below $10k, 0.5% for AGIs $10k-25k, 0.4% for AGIs $25k-50k, 0.2% for AGIs $50k-75k, 1.5% for AGIs $75k-100k, 9.4% for AGIs over 100k)
Profit/loss from business: +$14,085 (reported on 13.1% of returns)
Here:
+$14,085
State:
+$17,837
(% of AGI for various income ranges: 15.3% for AGIs below $10k, 5.5% for AGIs $10k-25k, 2.4% for AGIs $25k-50k, 2.9% for AGIs $50k-75k, 2.8% for AGIs $75k-100k, 4.7% for AGIs over 100k)
IRA payment deduction: $3,083 (reported on 2.5% of returns)
02152:
$3,083
Massachusetts:
$3,100
(% of AGI for various income ranges: 0.4% for AGIs $10k-25k, 0.2% for AGIs $25k-50k, 0.1% for AGIs $50k-75k, 0.1% for AGIs $75k-100k, 0.1% for AGIs over 100k)
Self-employed pension: $16,177 (reported on 0.7% of returns)
Here:
$16,177
Massachusetts:
$14,516
Total itemized deductions: $17,784 (22% of AGI, reported on 38.6% of returns)
Here:
$17,784
State:
$22,573
Here:
22.0% of AGI
State:
19.5% of AGI
(% of AGI for various income ranges: 19.4% for AGIs below $10k, 13.9% for AGIs $10k-25k, 11.1% for AGIs $25k-50k, 13.7% for AGIs $50k-75k, 16.1% for AGIs $75k-100k, 13.9% for AGIs over 100k)
Charity contributions deductions: $1,805 (2% of AGI, reported on 35.0% of returns)
Here:
$1,805
State:
$3,295
Here:
2.2% of AGI
State:
2.7% of AGI
(% of AGI for various income ranges: 1.1% for AGIs below $10k, 1.0% for AGIs $10k-25k, 1.0% for AGIs $25k-50k, 1.2% for AGIs $50k-75k, 1.4% for AGIs $75k-100k, 1.4% for AGIs over 100k)
Total tax: $7,245 (reported on 83.0% of returns)
02152:
$7,245
State:
$11,494
(% of AGI for various income ranges: 3.7% for AGIs below $10k, 4.9% for AGIs $10k-25k, 8.6% for AGIs $25k-50k, 10.8% for AGIs $50k-75k, 11.3% for AGIs $75k-100k, 17.0% for AGIs over 100k)
Earned income credit: $1,251 (reported on 7.1% of returns)
Here:
$1,251
State:
$1,518
Percentage of individuals using paid preparers for their 2004 taxes: 61.3%
Here:
61%
State:
58%
(% for various income ranges: 52.9% for AGIs below $10k, 61.4% for AGIs $10k-25k, 57.4% for AGIs $25k-50k, 62.7% for AGIs $50k-75k, 70.8% for AGIs $75k-100k, 73.5% for AGIs over 100k)
Likely homosexual households (counted as self-reported same-sex unmarried-partner households)
Lesbian couples: 0.1% of all households
Gay men: 0.0% of all households
Household received Food Stamps/SNAP in the past 12 months: 1,080 Household did not receive Food Stamps/SNAP in the past 12 months: 7,376
Women who had a birth in the past 12 months: 138 (134 now married, 9 unmarried) Women who did not have a birth in the past 12 months: 4,233 (1,446 now married, 2,793 unmarried)
Housing units in zip code 02152 with a mortgage: 3,060 (306 second mortgage, 2 home equity loan, 265 both second mortgage and home equity loan) Houses without a mortgage: 45
Median monthly owner costs for units with a mortgage: $2,835 Median monthly owner costs for units without a mortgage: $1,198
Residents with income below the poverty level in 2022:
This zip code:
8.3%
Whole state:
10.4%
Residents with income below 50% of the poverty level in 2022:
This zip code:
5.7%
Whole state:
5.1%
Median number of rooms in houses and condos:
Here:
6.3
State:
6.5
Median number of rooms in apartments:
Here:
4.5
State:
4.0
Notable locations in this zip code not listed on our city pages
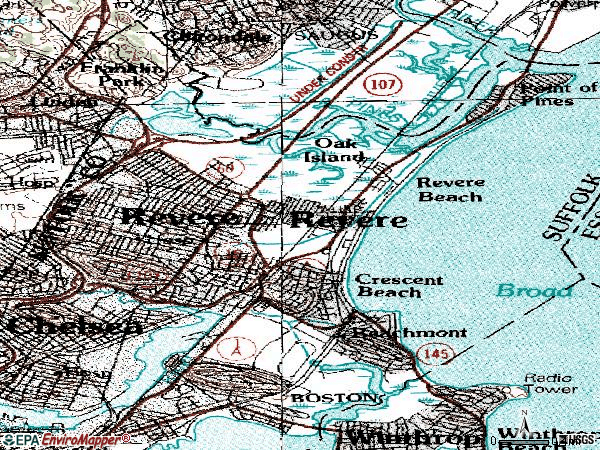
Notable locations in zip code 02152: Miller Field (A), Cottage Park Yacht Club (B), Winthrop Yacht Club (C), Shirley Gut (D), Deer Island Sewerage Treatment Plant (E), Winthrop Fire Department Station 2 Headquarters (F), Winthrop Townhall (G), Winthrop Fire Department Station 1 (H), Winthrop Public Library (I), Winthrop Public Library and Museum (J), Suffolk County House of Correction (K). Display/hide their locations on the map
2,114 married couples with children.
1,018 single-parent households (584 men, 434 women).
70.8% of residents of 02152 zip code speak English at home.
16.1% of residents speak Spanish at home (72% very well, 15% well, 8% not well, 4% not at all).
9.4% of residents speak other Indo-European language at home (78% very well, 18% well, 3% not well).
1.7% of residents speak Asian or Pacific Island language at home (75% very well, 20% well, 3% not well, 3% not at all).
1.9% of residents speak other language at home (76% very well, 11% well, 13% not well).
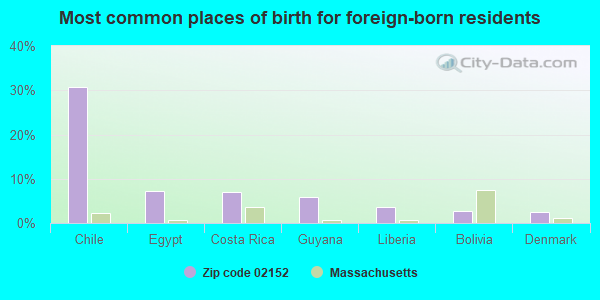
Foreign born population: 3,652 (19.2%) (64.1% of them are naturalized citizens)
This zip code:
19.2%
Whole state:
18.0%
31%Chile
7%Egypt
7%Costa Rica
6%Guyana
4%Liberia
3%Bolivia
2%Denmark
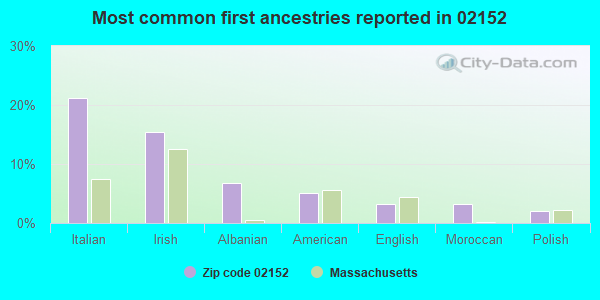
21%Italian
15%Irish
7%Albanian
5%American
3%English
3%Moroccan
2%Polish
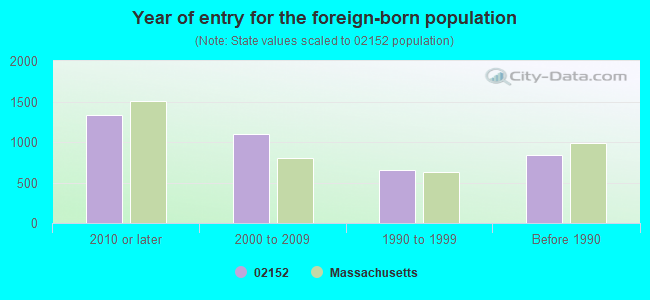
Year of entry for the foreign-born population
1,3362010 or later
1,0952000 to 2009
6521990 to 1999
843Before 1990
Facilities with environmental interests located in this zip code:
MWRA DEER ISLAND TREATMENT PLANT (190 TAFTS AVE in WINTHROP, MA)
AIR MAJOR (AIRS/AFS) - ICIS-, ENFORCEMENT/COMPLIANCE ACTIVITY AIR MINOR (AIRS/AFS) AIR PROGRAM (Clean Air Markets Division Business System) OIL CONTROL (Facility Response Plan for oil discharge) (Integrated Compliance Information System) - ICIS-01-1984-0021, FORMAL ENFORCEMENT ACTION STATE MASTER (MA-EPICS) - NEI-1191899, AIR PROGRAM, NEI-, RCRAINFO-MAD000846345, HAZARDOUS WASTE PROGRAM, RCRAINFO-MAD088980388, CRITERIA AND HAZARDOUS AIR POLLUTANT INVENTORY (Inventory of air pollution sources) National Pollutant Discharge Elimination System MAJOR (Tracking pollutant discharge elimination systems) - permit - ICIS-, ENFORCEMENT/COMPLIANCE ACTIVITY HAZARDOUS WASTE BIENNIAL REPORTER (Resource Conservation and Recovery Act (tracking hazardous waste)) Large Quantity Generators, more that 1000 kg of hazardous waste/month (Resource Conservation and Recovery Act (tracking hazardous waste)) - notification (Resource Conservation and Recovery Act (tracking hazardous waste)) Business SIC classification: SEWERAGE SYSTEMS; AIR AND WATER RESOURCE AND SOLID WASTE MANAGEMENT Business NAICS classification: ADMINISTRATION OF AIR AND WATER RESOURCE AND SOLID WASTE MANAGEMENT PROGRAMS. Organizations: MASSACHUSETTS RESOURCES AUTHORITY (CONTACT/OPERATOR)
, MA WATER RESOURCE AUTHORITY (CONTACT/OPERATOR)
, MASSACHUSETTS WATER RESOURCES AUTHORITY (CONTACT/OWNER)
, MA WATER RESOURCES AUTHORITY (CONTACT/OWNER)
, MA WATER RESOURCE AUTHORITY DEER ISLAND (CONTACT/REGULATORY)
, MASS. WATER RESOURCES AUTHORITY (OWNER/OPERATOR)
Alternative names: DEER ISLAND TRMT PLT, MA WATER RESOURCE AUTHORITY DEER ISLAND PLANT, MA WATER RESOURCES AUTHORITY, MDC DEER ISLAND SSI, MWRA - DEER ISLAND CP-048, MWRA - DEER ISLAND P O T W, MWRA POTW - DEER ISLAND, MWRA RPEM DEPT
ATLANTIS MARINA (550 PLEASANT ST in WINTHROP, MA)
National Pollutant Discharge Elimination System NON-MAJOR (Tracking pollutant discharge elimination systems) - permit National Pollutant Discharge Elimination System NON-MAJOR (Tracking pollutant discharge elimination systems) - permit Organizations: VL REALTY LLC C/O. RCGLLC (CONTACT/OPERATOR)
, COMM OF MA (CONTACT/OWNER)
Alternative names: COMM OF MA, DEPT. CAM, MA MARITIME ACADEMY, VL REALTY LLC, VL REALTY LLC, C/O RCGLLC
ARTHUR W DALRYMPLE (GROVERS AVENUE in WINTHROP, MA)
(National Center for Education Statistics) - STATE ID-346010 Organizations: WINTHROP (SCHOOL DISTRICT)
BODKINS PELLICLE LABORATORIES (61 LOCUST ST in WINTHROP, MA)
(Resource Conservation and Recovery Act (tracking hazardous waste)) Organizations: ARTHUR BODKINS (CONTACT/OWNER)
BOSTON SAND AND GRAVEL DEER ISLAND (DEER ISLAND in WINTHROP, MA)
AIR MINOR (AIRS/AFS) Business SIC classification: CONCRETE PRODUCTS, EXCEPT BLOCK AND BRICK Alternative names: B.S.+ G. DEER ISLAND, B.S.+ G. DEER ISLAND, BOSTON SAND & GRAVEL
PAUL REVERE TRANSPORTATION LLC (65 MAIN ST in WINTHROP, MA)
AIR MINOR (AIRS/AFS) Business SIC classification: TRANSPORTATION SERVICES
Housing units lacking complete plumbing facilities: 0.5% Housing units lacking complete kitchen facilities: 1.9%
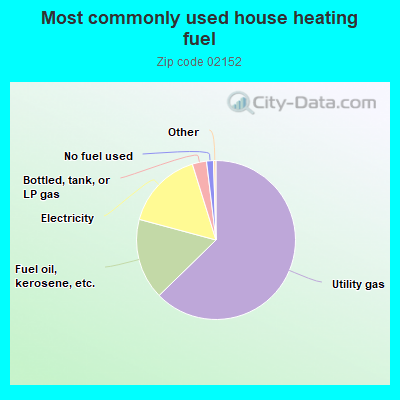
62.7%Utility gas
16.5%Fuel oil, kerosene, etc.
16.0%Electricity
2.9%Bottled, tank, or LP gas
1.4%No fuel used
Population in 1990: 18,907.
Place of birth for U.S.-born residents:
This state: 11,815
Northeast: 1,647
Midwest: 471
South: 712
West: 390
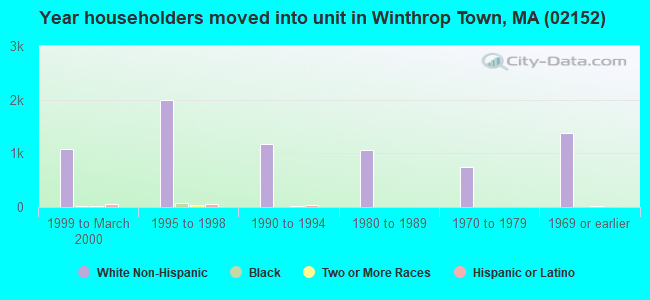
65% of the 02152 zip code residents lived in the same house 5 years ago. Out of people who lived in different houses, 68% lived in this county. Out of people who lived in different counties, 50% lived in Massachusetts.
87% of the 02152 zip code residents lived in the same house 1 year ago. Out of people who lived in different houses, 59% moved from this county. Out of people who lived in different houses, 18% moved from different county within same state. Out of people who lived in different houses, 20% moved from different state. Out of people who lived in different houses, 0% moved from abroad.
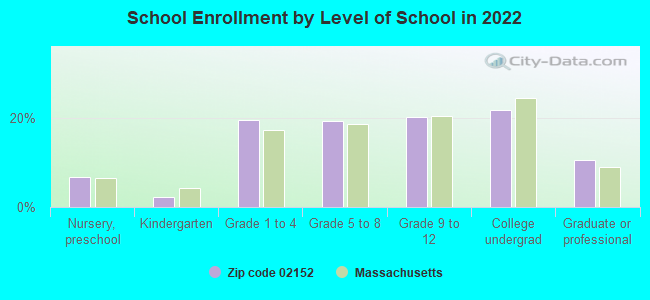
Private vs. public school enrollment:
Students in private schools in grades 1 to 8 (elementary and middle school): 232
Here:
15.1%
Massachusetts:
10.3%
Students in private schools in grades 9 to 12 (high school): 106
Here:
13.1%
Massachusetts:
12.3%
Students in private undergraduate colleges: 447
Here:
51.8%
Massachusetts:
51.2%
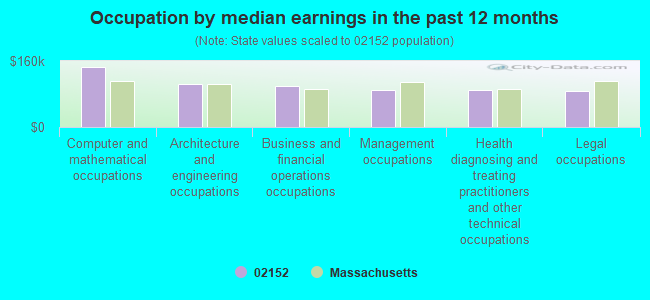
Occupation by median earnings in the past 12 months ($)
146,113Computer and mathematical occupations
103,179Architecture and engineering occupations
100,459Business and financial operations occupations
90,662Management occupations
88,538Health diagnosing and treating practitioners and other technical occupations
87,666Legal occupations
Companies with federal contracts located in this zip code:
NATIONAL COMMUNICATIONS SERVIC (70 QUINCY AVE in WINTHROP, MA; small business)
$2,946 with Department of Defense for Telephone and Telegraph Equipment. Taking place in NY. Signed on 2004-11-29. Completion date: 2004-12-26.
INTERNATIONAL RESTAURANT SUPPLY (68 BEAL STREET in WINTHROP, MA; small business)
$2,935 with Bureau of Prisoners/Federal Prison System for Kitchen Equipment and Appliances. Taking place in TX. Signed on 2005-04-18. Completion date: 2005-04-29.
Top industries in this zip code by the number of employees in 2005:
2002 - 2018 National Fire Incident Reporting System (NFIRS) incidents
Based on the data from the years 2002 - 2018 the average number of fires per year is 78. The highest number of fire incidents - 110 took place in 2005, and the least - 43 in 2012. The data has a dropping trend.
When looking into fire subcategories, the most incidents belonged to: Structure Fires (59.9%), and Outside Fires (27.6%).
Fire incident types reported to NFIRS in Zip Code 02152


 Nearest zip codes: 02128, 02151, 02150, 02210, 01908, 02110.


 Based on the data from the years 2002 - 2018 the average number of fires per year is 78. The highest number of fire incidents - 110 took place in 2005, and the least - 43 in 2012. The data has a dropping trend.
 When looking into fire subcategories, the most incidents belonged to: Structure Fires (59.9%), and Outside Fires (27.6%).