California
Ethnic groups
In 2000, California's foreign-born population numbered 8,864,255, or 26% of the state's total population, the largest percentage among the 50 states. Nearly one-third of all foreign-born persons in the US live in California. Latin Americans account for about half of foreign-born Californians, while Asians account for another third. As of 2002, nearly four-fifths of foreign-born Californians lived in the metropolitan areas of Los Angeles (5.1 million) and San Francisco (1.9 million).
The westward movement of American settlers in the third quarter of the 19th century, followed by German, Irish, North Italian, and Italian Swiss immigrants, overshadowed but did not obliterate California's Spanish heritage. In 2000, 10,966,556 (32.4%) of the state's residents were of Hispanic or Latino origin, up from 7,688,000 (25.8%) in 1990, and more than the total for any other state. The census of 2000 recorded that the majority—8,455,926,
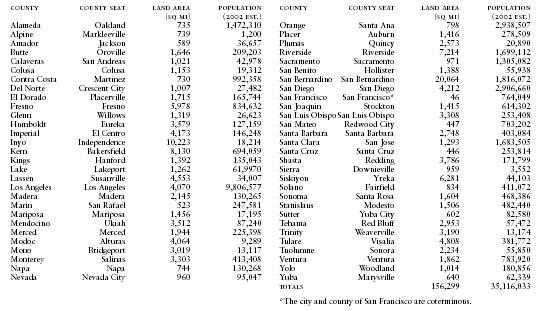
California Counties, County Seats, and County Areas and Populations
| COUNTY | COUNTY SEAT | LAND AREA (SQ MI) | POPULATION (2002 EST.) | COUNTY | COUNTY SEAT | LAND AREA (SQ MI) | POPULATION (2002 EST.) |
| *The city and county of San Francisco are coterminous. | |||||||
| Alameda | Oakland | 735 | 1,472,310 | Orange | Santa Ana | 798 | 2,938,507 |
| Alpine | Markleeville | 739 | 1,200 | Placer | Auburn | 1,416 | 278,509 |
| Amador | Jackson | 589 | 36,657 | Plumas | Quincy | 2,573 | 20,890 |
| Butte | Oroville | 1,646 | 209,203 | Riverside | Riverside | 7,214 | 1,699,112 |
| Calaveras | San Andreas | 1,021 | 42,978 | Sacramento | Sacramento | 971 | 1,305,082 |
| Colusa | Colusa | 1,153 | 19,312 | San Benito | Hollister | 1,388 | 55,938 |
| Contra Costa | Martinez | 730 | 992,358 | San Bernardino | San Bernardino | 20,064 | 1,816,072 |
| Del Norte | Crescent City | 1,007 | 27,482 | San Diego | San Diego | 4,212 | 2,906,660 |
| El Dorado | Placerville | 1,715 | 165,744 | San Francisco | San Francisco* | 46 | 764,049 |
| Fresno | Fresno | 5,978 | 834,632 | San Joaquin | Stockton | 1,415 | 614,302 |
| Glenn | Willows | 1,319 | 26,623 | San Luis Obispo | San Luis Obispo | 3,308 | 253,408 |
| Humboldt | Eureka | 3,579 | 127,159 | San Mateo | Redwood City | 447 | 703,202 |
| Imperial | El Centro | 4,173 | 146,248 | Santa Barbara | Santa Barbara | 2,748 | 403,084 |
| Inyo | Independence | 10,223 | 18,214 | Santa Clara | San Jose | 1,293 | 1,683,505 |
| Kern | Bakersfield | 8,130 | 694,059 | Santa Cruz | Santa Cruz | 446 | 253,814 |
| Kings | Hanford | 1,392 | 135,043 | Shasta | Redding | 3,786 | 171,799 |
| Lake | Lakeport | 1,262 | 61,9970 | Sierra | Downieville | 959 | 3,552 |
| Lassen | Susanville | 4,553 | 34,007 | Siskiyou | Yreka | 6,281 | 44,103 |
| Los Angeles | Los Angeles | 4,070 | 9,806,577 | Solano | Fairfield | 834 | 411,072 |
| Madera | Madera | 2,145 | 130,265 | Sonoma | Santa Rosa | 1,604 | 468,386 |
| Marin | San Rafael | 523 | 247,581 | Stanislaus | Modesto | 1,506 | 482,440 |
| Mariposa | Mariposa | 1,456 | 17,195 | Sutter | Yuba City | 602 | 82,580 |
| Mendocino | Ukiah | 3,512 | 87,240 | Tehama | Red Bluff | 2,953 | 57,472 |
| Merced | Merced | 1,944 | 225,398 | Trinity | Weaverville | 3,190 | 13,174 |
| Modoc | Alturas | 4,064 | 9,289 | Tulare | Visalia | 4,808 | 381,772 |
| Mono | Bridgeport | 3,019 | 13,117 | Tuolumne | Sonora | 2,234 | 55,850 |
| Monterey | Salinas | 3,303 | 413,408 | Ventura | Ventura | 1,862 | 783,920 |
| Napa | Napa | 744 | 130,268 | Yolo | Woodland | 1,014 | 180,856 |
| Nevada | Nevada City | 960 | 95,047 | Yuba | Marysville | 640 | 62,339 |
| TOTALS | 156,299 | 35,116,033 | |||||
up from 5,322,170 in 1990—were Mexican-Americans; there were also 140,570 Puerto Ricans and 72,286 Cubans. After World War II, the Hispanic communities of Los Angeles, San Diego, and other southern California cities developed strong political organizations. Increasing numbers of Mexican-Americans have won local, state, and federal elective office, though their potential remains unrealized.
In 2000 California had the largest Asian population of any state—3,697,513 (up from 2,846,000 in 1990), or 10.9% of the state's total population (the 2nd-highest percentage in the nation). In the same year there were 116,961 Pacific Islanders (including more native Hawaiians than in any state except Hawaii). Chinese workers were first brought to California between 1849 and 1882, when the Chinese Exclusion Act was passed by Congress. In 2000 the Chinese constituted the largest group among California's Asian population, numbering 980,642, or 2.9% of the population. The nation's oldest and largest Chinatown is in San Francisco. Although Chinese-Americans, as they prospered, moved to suburban areas, the seats of the powerful nationwide and worldwide merchant and clan associations are in that city. Los Angeles also has a Chinese district.
The Japanese, spread throughout the western seaboard states, were engaged mainly in agriculture, along with fishing and small business, until their removal and internment during World War II. After the war, some continued in market gardening and other family agriculture, but most, deprived of their landholdings, entered urban occupations, including the professions; many dispersed to other regions of the country. In 2000 there were 288,854 Japanese in California, down from 353,251 in 1990.
After the Chinese, the most populous Asian group in California in 2000 was the Filipino community, with 918,678, or 2.7% of the total state population. In 2000 California also had 345,882 Koreans, 447,032 Vietnamese (up from 242,946 in 1990), 314,819 Asian Indians (up from 112,560), 55,456 Laotians, 20,571 native Hawaiians (down from 43,418 in 1990), 37,498 Samoans, and 20,918 Guamanians.
American Indians and Alaska natives numbered around 333,346 in 2000 (up from 242,000 in 1990), the greatest number of any state in the country. The figure for American Indians includes Indians native to California and many others coaxed to resettle there under a policy that sought to terminate tribal status. Along with the remaining indigenous tribes in California, there is also a large urban Indian population, especially in Los Angeles, which has more Indians than any other US city. Many of the urban Indians were unprepared for the new kind of life and unable to earn an adequate living; militant Indians have made dramatic, but on the whole unsuccessful, protests aimed at bettering their condition.
Black Americans constitute a smaller proportion of California's population than of the nation's as a whole: less than 7% in 2000. Nevertheless, California still had the fifth-largest black population, numbering 2,263,882. Considerable migration of blacks took place during World War II, when defense industries on the West Coast offered new opportunities.