Work and Jobs in Bay City, Texas (TX) Detailed Stats
Occupations, Industries, Unemployment, Workers, Commute
Settings
X


Recent posts about work in Bay City, Texas on our local forum with over 2,400,000 registered users:
 | TV show or movie made in Bay City Texas in the 60s? (10 replies) |
| Bay City - where to live? (9 replies) |
| So, is the Texas power grid 'fixed'? (763 replies) |
| Bay City and surrounding area? (13 replies) |
| Family of 6 wants to buy a house in Texas within 3 hrs of Austin - considering Cypress, New Braufels, etc (55 replies) |
| Victoria Options for Retired Couple? (5 replies) |
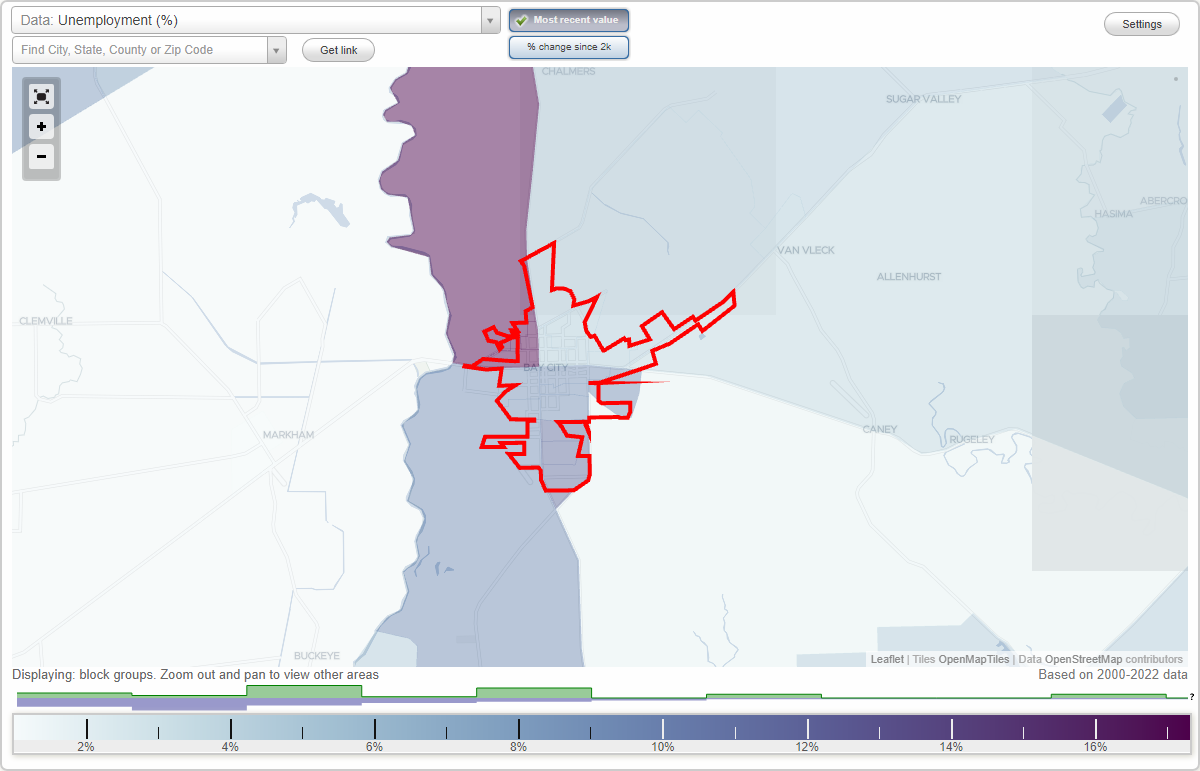
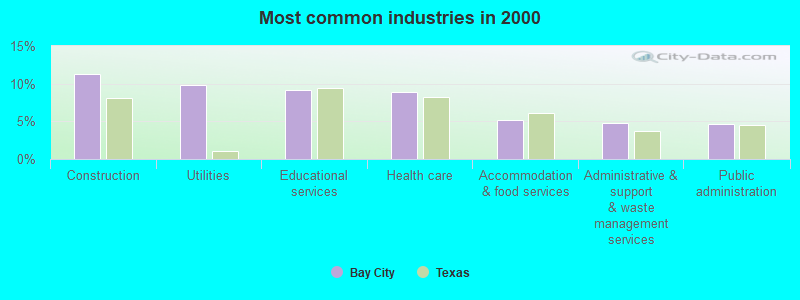
The most common industries in Bay City are: Construction (11.3% of civilian employees), Utilities (9.8% of civilian employees), Educational services (9.1% of civilian employees). 80.6% of workers work in Matagorda County and 1.0% of all workers work at home. 74.3% of workers are employees of private companies, which is 6.3% greater than the rate of 69.6% across the entire state of Texas.
Whole page based on the data from 2000 / 2022 when the population of Bay City, Texas was 18,667 / 18,349
Whole page based on the data from 2000 / 2022 when the population of Bay City, Texas was 18,667 / 18,349
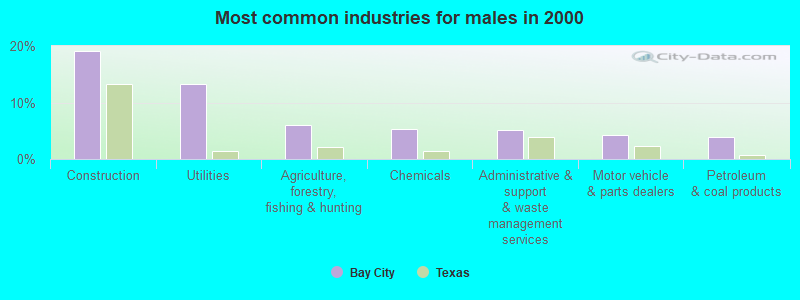
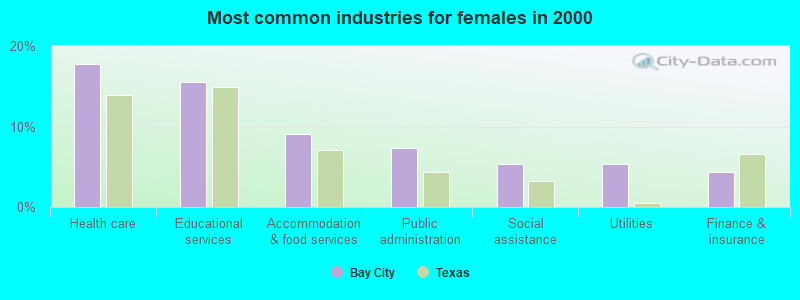
Most common industries
Most common industries | |||
|---|---|---|---|
Industry | All | Males | Females |
| Construction | 11.3% (842) | 19.1% (795) | 1.4% (47) |
| Utilities | 9.8% (731) | 13.3% (554) | 5.4% (177) |
| Educational services | 9.1% (678) | 3.9% (164) | 15.6% (514) |
| Health care | 8.8% (658) | 1.7% (70) | 17.8% (588) |
| Accommodation and food services | 5.2% (390) | 2.1% (89) | 9.1% (301) |
| Administrative and support and waste management services | 4.8% (357) | 5.2% (215) | 4.3% (142) |
| Public administration | 4.7% (350) | 2.6% (107) | 7.4% (243) |
| Chemicals | 3.7% (276) | 5.4% (223) | 1.6% (53) |
| Agriculture, forestry, fishing and hunting | 3.6% (267) | 6.0% (250) | 0.5% (17) |
| Motor vehicle and parts dealers | 2.7% (204) | 4.2% (174) | 0.9% (30) |
| Social assistance | 2.5% (186) | 0.2% (9) | 5.4% (177) |
| Food and beverage stores | 2.4% (182) | 2.2% (93) | 2.7% (89) |
| Finance and insurance | 2.3% (175) | 0.7% (30) | 4.4% (145) |
| Petroleum and coal products | 2.3% (170) | 4.0% (165) | 0.2% (5) |
| Department and other general merchandise stores | 2.3% (169) | 0.9% (37) | 4.0% (132) |
| Real estate and rental and leasing | 2.1% (154) | 1.5% (63) | 2.8% (91) |
| Repair and maintenance | 2.0% (147) | 2.7% (113) | 1.0% (34) |
| Professional, scientific, and technical services | 1.9% (144) | 1.7% (72) | 2.2% (72) |
| Mining, quarrying, and oil and gas extraction | 1.7% (129) | 2.7% (112) | 0.5% (17) |
| Building material and garden equipment and supplies dealers | 1.6% (116) | 2.0% (83) | 1.0% (33) |
| Furniture and home furnishings, and household appliance stores | 0.9% (66) | 1.1% (44) | 0.7% (22) |
| Personal and laundry services | 0.9% (66) | 0.2% (8) | 1.8% (58) |
| Arts, entertainment, and recreation | 0.9% (66) | 1.4% (57) | 0.3% (9) |
| Religious, grantmaking, civic, professional, and similar organizations | 0.9% (64) | 0.8% (32) | 1.0% (32) |
| Plastics and rubber products | 0.8% (60) | 1.4% (60) | 0.0% (0) |
| Metal and metal products | 0.8% (57) | 0.9% (38) | 0.6% (19) |
| Other transportation, and support activities, and couriers | 0.8% (57) | 1.4% (57) | 0.0% (0) |
| Truck transportation | 0.7% (52) | 1.3% (52) | 0.0% (0) |
| Publishing, and motion picture and sound recording industries | 0.6% (47) | 0.5% (19) | 0.8% (28) |
| Machinery, equipment, and supplies merchant wholesalers | 0.6% (45) | 1.1% (45) | 0.0% (0) |
| Miscellaneous manufacturing | 0.5% (40) | 0.5% (19) | 0.6% (21) |
| Radio, TV, and computer stores | 0.5% (37) | 0.6% (26) | 0.3% (11) |
| Private households | 0.5% (34) | 0.0% (0) | 1.0% (34) |
| U. S. Postal service | 0.4% (27) | 0.2% (9) | 0.5% (18) |
| Water transportation | 0.4% (27) | 0.7% (27) | 0.0% (0) |
| Clothing and accessories, including shoe, stores | 0.3% (26) | 0.0% (0) | 0.8% (26) |
| Retail florists | 0.3% (25) | 0.2% (8) | 0.5% (17) |
| Furniture and related product manufacturing | 0.3% (24) | 0.4% (16) | 0.2% (8) |
| Food | 0.3% (24) | 0.2% (9) | 0.5% (15) |
| Rail transportation | 0.3% (20) | 0.5% (20) | 0.0% (0) |
| Other direct selling establishments | 0.3% (20) | 0.2% (7) | 0.4% (13) |
| Computer and electronic products | 0.3% (19) | 0.1% (5) | 0.4% (14) |
| Groceries and related products merchant wholesalers | 0.2% (18) | 0.4% (18) | 0.0% (0) |
| Electrical and electronic goods merchant wholesalers | 0.2% (18) | 0.1% (5) | 0.4% (13) |
| Broadcasting and telecommunications | 0.2% (17) | 0.3% (11) | 0.2% (6) |
| Drugs, sundries, and chemical and allied products merchant wholesalers | 0.1% (11) | 0.3% (11) | 0.0% (0) |
| Electrical equipment, appliances, and components | 0.1% (11) | 0.3% (11) | 0.0% (0) |
| Machinery | 0.1% (10) | 0.2% (10) | 0.0% (0) |
| Book stores and news dealers | 0.1% (10) | 0.2% (10) | 0.0% (0) |
| Petroleum and petroleum products merchant wholesalers | 0.1% (10) | 0.0% (0) | 0.3% (10) |
| Pharmacies and drug stores | 0.1% (9) | 0.2% (9) | 0.0% (0) |
| Farm supplies merchant wholesalers | 0.1% (9) | 0.2% (9) | 0.0% (0) |
| Office supplies and stationery stores | 0.1% (8) | 0.2% (8) | 0.0% (0) |
| Apparel | 0.1% (8) | 0.0% (2) | 0.2% (6) |
| Music stores | 0.1% (8) | 0.0% (0) | 0.2% (8) |
| Motor vehicles, parts and supplies merchant wholesalers | 0.1% (8) | 0.2% (8) | 0.0% (0) |
| Wood products | 0.1% (7) | 0.2% (7) | 0.0% (0) |
| Hardware, plumbing and heating equipment, and supplies merchant wholesalers | 0.1% (7) | 0.2% (7) | 0.0% (0) |
| Data processing, libraries, and other information services | 0.1% (7) | 0.2% (7) | 0.0% (0) |
| Transportation equipment | 0.1% (7) | 0.2% (7) | 0.0% (0) |
| Metals and minerals, except petroleum, merchant wholesalers | 0.1% (6) | 0.1% (6) | 0.0% (0) |
| Professional and commercial equipment and supplies merchant wholesalers | 0.1% (6) | 0.1% (6) | 0.0% (0) |
| Nonmetallic mineral products | 0.1% (6) | 0.1% (6) | 0.0% (0) |
| Alcoholic beverages merchant wholesalers | 0.1% (5) | 0.1% (5) | 0.0% (0) |
| Farm product raw materials merchant wholesalers | 0.1% (5) | 0.1% (5) | 0.0% (0) |
Unemployment in Bay City
- Unemployment by race in 2022
- Unemployment rate for White non-Hispanic residents
- 2.7%Males
- 9.4%Females
- Unemployment rate for Black residents
- 28.8%Males
- 22.6%Females
- Unemployment rate for other race residents
- 3.0%Males
- 11.6%Females
- Unemployment rate for two or more race residents
- 9.4%Males
- 28.6%Females
- Unemployment rate for Hispanic or Latino residents
- 4.4%Males
- 14.2%Females
- Unemployment by race in 2000
- Unemployment rate for White non-Hispanic residents
- 4.8%Males
- 7.0%Females
- Unemployment rate for Black residents
- 23.2%Males
- 14.4%Females
- Unemployment rate for other race residents
- 8.3%Males
- 10.1%Females
- Unemployment rate for two or more race residents
- 2.6%Males
- 13.3%Females
- Unemployment rate for Hispanic or Latino residents
- 6.4%Males
- 13.7%Females
Time leaving home to go to work
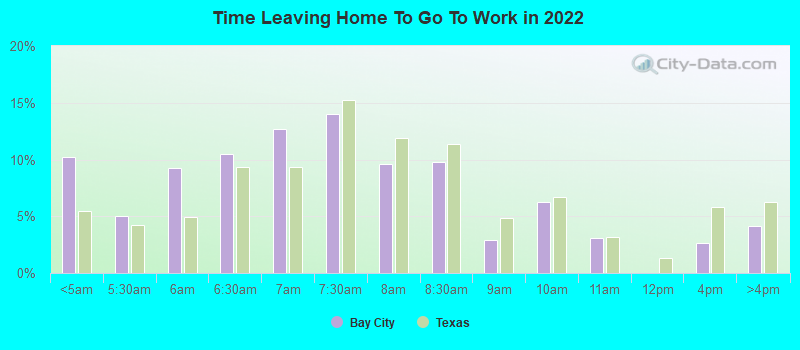
12:00 a.m. to 4:59 a.m.:
| Bay City: | 10.2% (693) |
| Texas: | 5.5% (678,264) |
5:00 a.m. to 5:29 a.m.:
| Bay City: | 5.0% (343) |
| Texas: | 4.3% (525,841) |
5:30 a.m. to 5:59 a.m.:
| Bay City: | 9.3% (629) |
| Texas: | 4.9% (603,953) |
6:00 a.m. to 6:29 a.m.:
| Bay City: | 10.5% (716) |
| Texas: | 9.4% (1,155,020) |
6:30 a.m. to 6:59 a.m.:
| Bay City: | 12.7% (860) |
| Texas: | 9.3% (1,152,822) |
7:00 a.m. to 7:29 a.m.:
| Bay City: | 14.0% (950) |
| Texas: | 15.3% (1,885,477) |
7:30 a.m. to 7:59 a.m.:
| Bay City: | 9.6% (653) |
| Texas: | 11.9% (1,469,628) |
8:00 a.m. to 8:29 a.m.:
| Bay City: | 9.7% (662) |
| Texas: | 11.3% (1,400,175) |
8:30 a.m. to 8:59 a.m.:
| Bay City: | 2.9% (199) |
| Texas: | 4.9% (599,574) |
9:00 a.m. to 9:59 a.m.:
| Bay City: | 6.3% (426) |
| Texas: | 6.7% (829,367) |
10:00 a.m. to 10:59 a.m.:
| Bay City: | 3.0% (207) |
| Texas: | 3.2% (390,354) |
12:00 p.m. to 3:59 p.m.:
| Bay City: | 2.6% (180) |
| Texas: | 5.8% (720,594) |
4:00 p.m. to 11:59 p.m.:
| Bay City: | 4.1% (279) |
| Texas: | 6.3% (777,072) |
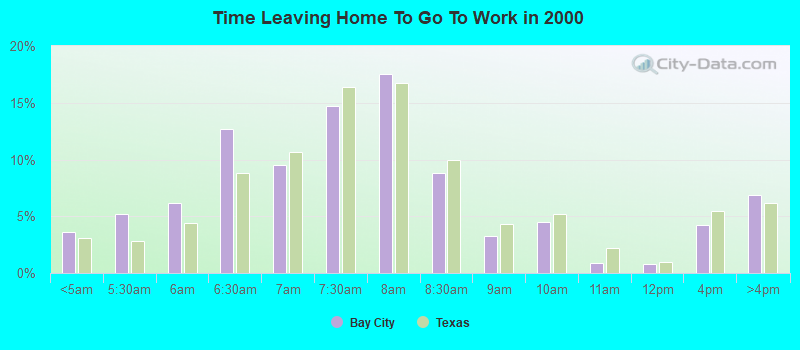
<5am:
| Bay City: | 3.6% (264) |
| Texas: | 3.1% (281,361) |
5:30am:
| Bay City: | 5.2% (382) |
| Texas: | 2.9% (262,060) |
6am:
| Bay City: | 6.2% (450) |
| Texas: | 4.4% (403,423) |
6:30am:
| Bay City: | 12.7% (926) |
| Texas: | 8.8% (808,876) |
7am:
| Bay City: | 9.6% (698) |
| Texas: | 10.7% (976,557) |
7:30am:
| Bay City: | 14.7% (1,074) |
| Texas: | 16.4% (1,500,904) |
8am:
| Bay City: | 17.5% (1,278) |
| Texas: | 16.8% (1,536,308) |
8:30am:
| Bay City: | 8.8% (641) |
| Texas: | 10.0% (913,601) |
9am:
| Bay City: | 3.3% (240) |
| Texas: | 4.4% (398,656) |
10am:
| Bay City: | 4.5% (326) |
| Texas: | 5.2% (472,592) |
11am:
| Bay City: | 0.9% (67) |
| Texas: | 2.2% (197,844) |
12pm:
| Bay City: | 0.8% (58) |
| Texas: | 0.9% (86,997) |
4pm:
| Bay City: | 4.2% (306) |
| Texas: | 5.5% (503,565) |
>4pm:
| Bay City: | 6.9% (501) |
| Texas: | 6.1% (563,107) |
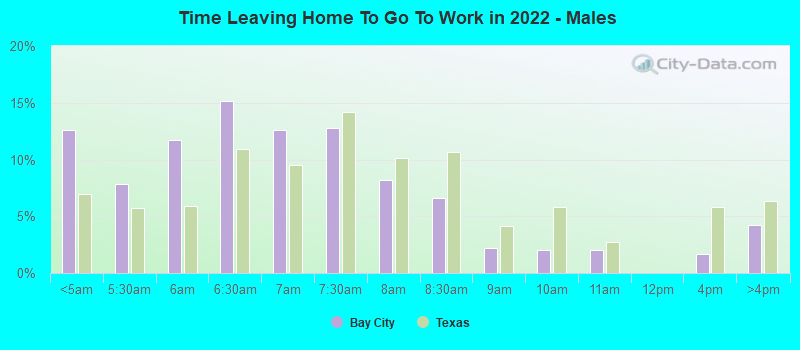
12:00 a.m. to 4:59 a.m. - Males:
| Bay City: | 12.6% (485) |
| Texas: | 7.0% (477,284) |
5:00 a.m. to 5:29 a.m. - Males:
| Bay City: | 7.9% (303) |
| Texas: | 5.8% (394,876) |
5:30 a.m. to 5:59 a.m. - Males:
| Bay City: | 11.7% (450) |
| Texas: | 5.9% (402,788) |
6:00 a.m. to 6:29 a.m. - Males:
| Bay City: | 15.2% (582) |
| Texas: | 10.9% (751,118) |
6:30 a.m. to 6:59 a.m. - Males:
| Bay City: | 12.6% (484) |
| Texas: | 9.5% (652,306) |
7:00 a.m. to 7:29 a.m. - Males:
| Bay City: | 12.8% (492) |
| Texas: | 14.1% (970,598) |
7:30 a.m. to 7:59 a.m. - Males:
| Bay City: | 8.2% (314) |
| Texas: | 10.2% (696,429) |
8:00 a.m. to 8:29 a.m. - Males:
| Bay City: | 6.6% (254) |
| Texas: | 10.6% (729,041) |
8:30 a.m. to 8:59 a.m. - Males:
| Bay City: | 2.2% (84) |
| Texas: | 4.1% (281,762) |
9:00 a.m. to 9:59 a.m. - Males:
| Bay City: | 2.0% (78) |
| Texas: | 5.8% (401,071) |
10:00 a.m. to 10:59 a.m. - Males:
| Bay City: | 2.0% (78) |
| Texas: | 2.7% (186,469) |
12:00 p.m. to 3:59 p.m. - Males:
| Bay City: | 1.7% (65) |
| Texas: | 5.8% (397,795) |
4:00 p.m. to 11:59 p.m. - Males:
| Bay City: | 4.3% (163) |
| Texas: | 6.4% (435,950) |
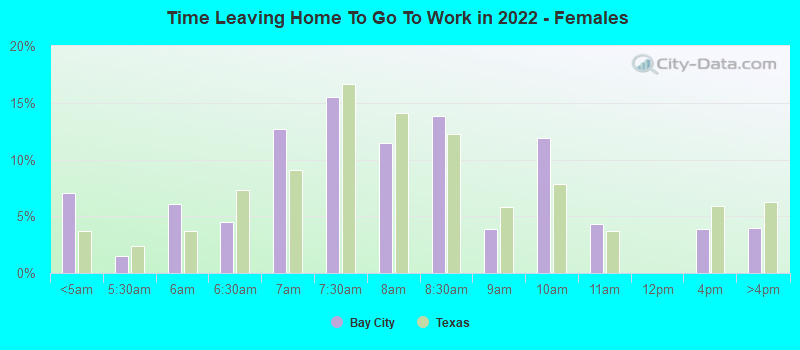
12:00 a.m. to 4:59 a.m. - Females:
| Bay City: | 7.0% (208) |
| Texas: | 3.7% (200,980) |
5:00 a.m. to 5:29 a.m. - Females:
| Bay City: | 1.5% (43) |
| Texas: | 2.4% (130,965) |
5:30 a.m. to 5:59 a.m. - Females:
| Bay City: | 6.1% (180) |
| Texas: | 3.7% (201,165) |
6:00 a.m. to 6:29 a.m. - Females:
| Bay City: | 4.5% (132) |
| Texas: | 7.4% (403,902) |
6:30 a.m. to 6:59 a.m. - Females:
| Bay City: | 12.7% (376) |
| Texas: | 9.1% (500,516) |
7:00 a.m. to 7:29 a.m. - Females:
| Bay City: | 15.5% (458) |
| Texas: | 16.7% (914,879) |
7:30 a.m. to 7:59 a.m. - Females:
| Bay City: | 11.5% (339) |
| Texas: | 14.1% (773,199) |
8:00 a.m. to 8:29 a.m. - Females:
| Bay City: | 13.8% (410) |
| Texas: | 12.2% (671,134) |
8:30 a.m. to 8:59 a.m. - Females:
| Bay City: | 3.9% (115) |
| Texas: | 5.8% (317,812) |
9:00 a.m. to 9:59 a.m. - Females:
| Bay City: | 11.9% (352) |
| Texas: | 7.8% (428,296) |
10:00 a.m. to 10:59 a.m. - Females:
| Bay City: | 4.3% (128) |
| Texas: | 3.7% (203,885) |
12:00 p.m. to 3:59 p.m. - Females:
| Bay City: | 3.8% (114) |
| Texas: | 5.9% (322,799) |
4:00 p.m. to 11:59 p.m. - Females:
| Bay City: | 3.9% (116) |
| Texas: | 6.2% (341,122) |
Travel time to work
Percentage of workers working in this county: 80.6%
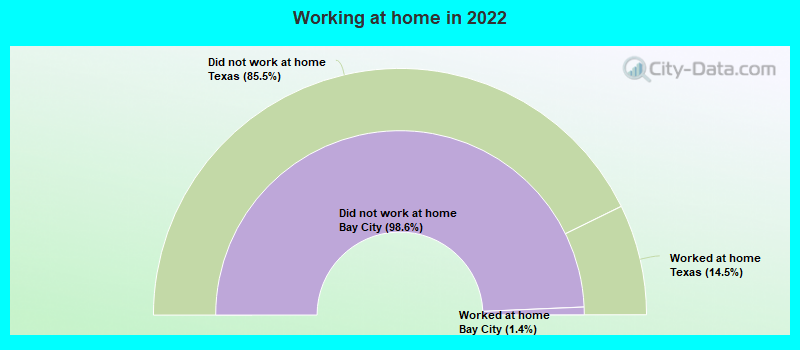
Number of people working at home: 73 (1.0% of all workers)
Daytime population change due to commuting: -842 (-4.5%)
Workers who live and work in this city: 3,866 (52.9%)
Number of people working at home: 73 (1.0% of all workers)
Daytime population change due to commuting: -842 (-4.5%)
Workers who live and work in this city: 3,866 (52.9%)
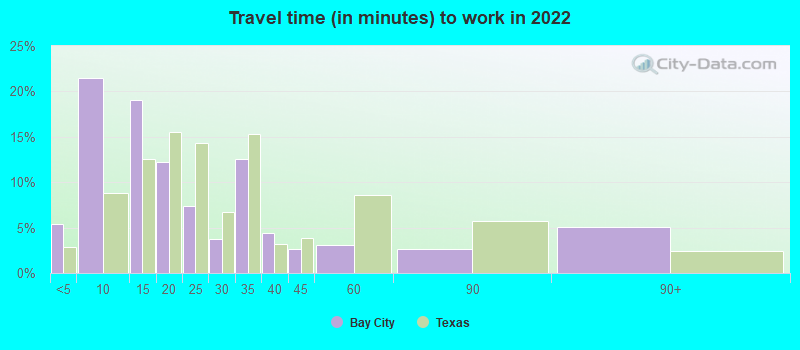
Less than 5 minutes:
| Bay City: | 5.4% (374) |
| Texas: | 2.8% (350,462) |
5 to 9 minutes:
| Bay City: | 21.5% (1,489) |
| Texas: | 8.8% (1,087,762) |
10 to 14 minutes:
| Bay City: | 19.1% (1,319) |
| Texas: | 12.6% (1,550,271) |
15 to 19 minutes:
| Bay City: | 12.2% (841) |
| Texas: | 15.6% (1,918,353) |
20 to 24 minutes:
| Bay City: | 7.4% (511) |
| Texas: | 14.4% (1,772,079) |
25 to 29 minutes:
| Bay City: | 3.7% (256) |
| Texas: | 6.7% (827,833) |
30 to 34 minutes:
| Bay City: | 12.6% (870) |
| Texas: | 15.3% (1,887,878) |
35 to 39 minutes:
| Bay City: | 4.4% (308) |
| Texas: | 3.2% (394,170) |
40 to 44 minutes:
| Bay City: | 2.7% (186) |
| Texas: | 3.9% (476,118) |
45 to 59 minutes:
| Bay City: | 3.1% (216) |
| Texas: | 8.6% (1,058,376) |
60 to 89 minutes:
| Bay City: | 2.6% (179) |
| Texas: | 5.7% (706,002) |
90 or more minutes:
| Bay City: | 5.1% (350) |
| Texas: | 2.4% (299,884) |
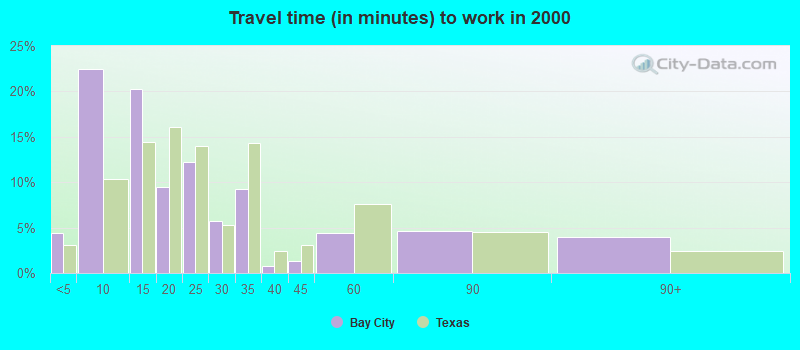
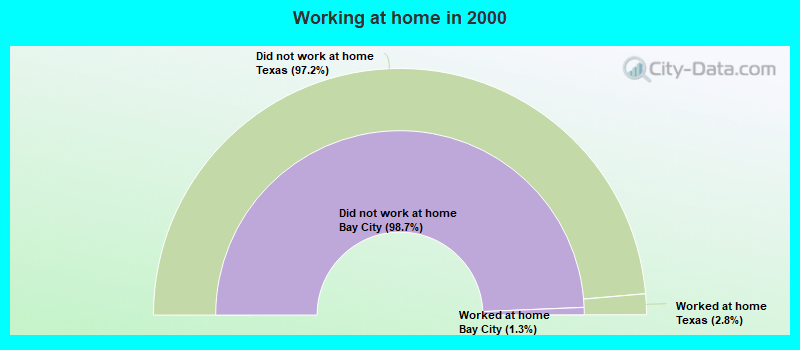
Less than 5 minutes:
| Bay City: | 4.4% (323) |
| Texas: | 3.0% (277,642) |
5 to 9 minutes:
| Bay City: | 22.5% (1,643) |
| Texas: | 10.3% (942,891) |
10 to 14 minutes:
| Bay City: | 20.2% (1,477) |
| Texas: | 14.4% (1,317,555) |
15 to 19 minutes:
| Bay City: | 9.4% (690) |
| Texas: | 16.0% (1,467,945) |
20 to 24 minutes:
| Bay City: | 12.2% (889) |
| Texas: | 13.9% (1,276,781) |
25 to 29 minutes:
| Bay City: | 5.8% (422) |
| Texas: | 5.3% (482,838) |
30 to 34 minutes:
| Bay City: | 9.3% (676) |
| Texas: | 14.3% (1,309,699) |
35 to 39 minutes:
| Bay City: | 0.7% (54) |
| Texas: | 2.4% (219,873) |
40 to 44 minutes:
| Bay City: | 1.3% (93) |
| Texas: | 3.1% (280,916) |
45 to 59 minutes:
| Bay City: | 4.4% (321) |
| Texas: | 7.6% (692,006) |
60 to 89 minutes:
| Bay City: | 4.6% (337) |
| Texas: | 4.6% (418,905) |
90 or more minutes:
| Bay City: | 3.9% (286) |
| Texas: | 2.4% (218,800) |
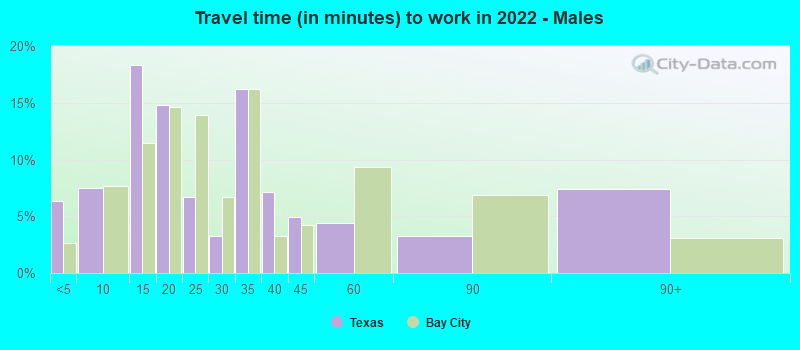
Less than 5 minutes - Males:
| Bay City: | 6.3% (243) |
| Texas: | 2.7% (181,937) |
5 to 9 minutes - Males:
| Bay City: | 7.5% (289) |
| Texas: | 7.6% (522,166) |
10 to 14 minutes - Males:
| Bay City: | 18.3% (706) |
| Texas: | 11.5% (785,572) |
15 to 19 minutes - Males:
| Bay City: | 14.8% (569) |
| Texas: | 14.6% (1,001,179) |
20 to 24 minutes - Males:
| Bay City: | 6.7% (258) |
| Texas: | 13.9% (950,043) |
25 to 29 minutes - Males:
| Bay City: | 3.3% (125) |
| Texas: | 6.7% (457,259) |
30 to 34 minutes - Males:
| Bay City: | 16.2% (624) |
| Texas: | 16.2% (1,110,357) |
35 to 39 minutes - Males:
| Bay City: | 7.1% (274) |
| Texas: | 3.3% (223,512) |
40 to 44 minutes - Males:
| Bay City: | 4.9% (189) |
| Texas: | 4.2% (289,434) |
45 to 59 minutes - Males:
| Bay City: | 4.4% (169) |
| Texas: | 9.3% (639,122) |
60 to 89 minutes - Males:
| Bay City: | 3.3% (127) |
| Texas: | 6.8% (467,154) |
90 or more minutes - Males:
| Bay City: | 7.4% (285) |
| Texas: | 3.1% (211,313) |
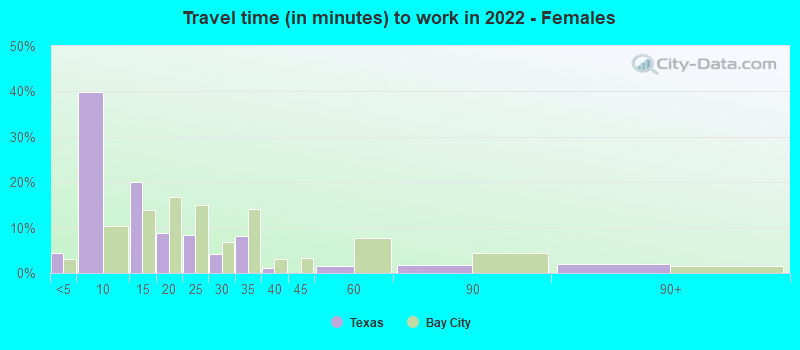
Less than 5 minutes - Females:
| Bay City: | 4.4% (133) |
| Texas: | 3.1% (168,525) |
5 to 9 minutes - Females:
| Bay City: | 39.8% (1,220) |
| Texas: | 10.3% (565,596) |
10 to 14 minutes - Females:
| Bay City: | 20.0% (612) |
| Texas: | 13.9% (764,699) |
15 to 19 minutes - Females:
| Bay City: | 8.9% (272) |
| Texas: | 16.7% (917,174) |
20 to 24 minutes - Females:
| Bay City: | 8.3% (253) |
| Texas: | 15.0% (822,036) |
25 to 29 minutes - Females:
| Bay City: | 4.3% (131) |
| Texas: | 6.7% (370,574) |
30 to 34 minutes - Females:
| Bay City: | 8.0% (246) |
| Texas: | 14.2% (777,521) |
35 to 39 minutes - Females:
| Bay City: | 1.1% (33) |
| Texas: | 3.1% (170,658) |
45 to 59 minutes - Females:
| Bay City: | 1.6% (48) |
| Texas: | 7.6% (419,254) |
60 to 89 minutes - Females:
| Bay City: | 1.7% (52) |
| Texas: | 4.4% (238,848) |
90 or more minutes - Females:
| Bay City: | 2.0% (62) |
| Texas: | 1.6% (88,571) |
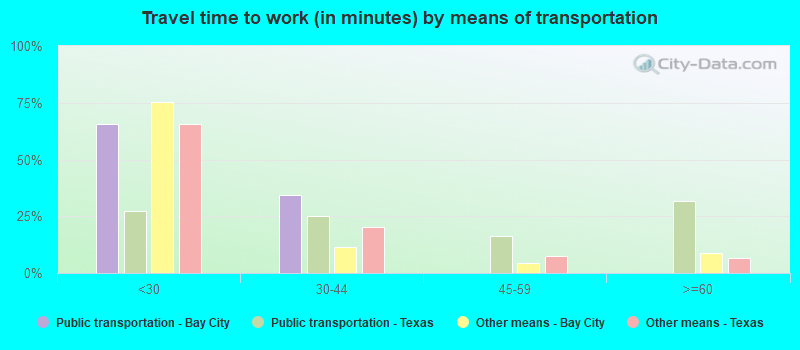
Means of transportation to work
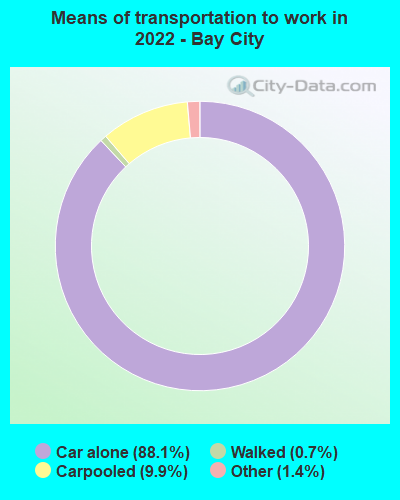

Drove car alone:
| Bay City: | 88.1% (6,341) |
| Texas: | 83.3% (4,557,023) |
Carpooled:
| Bay City: | 9.9% (711) |
| Texas: | 11.7% (674,818) |
Walked:
| Bay City: | 0.7% (47) |
| Texas: | 1.7% (99,911) |
Other means:
| Bay City: | 1.4% (100) |
| Texas: | 2.0% (95,481) |
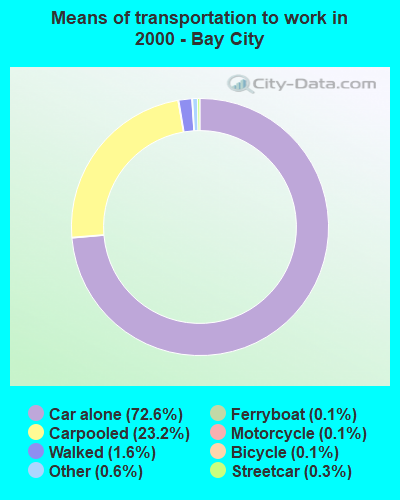

Drove car alone:
| Bay City: | 72.6% (5,307) |
| Texas: | 77.7% (7,115,590) |
Carpooled:
| Bay City: | 23.2% (1,693) |
| Texas: | 14.5% (1,326,012) |
Streetcar or trolley car:
| Bay City: | 0.3% (19) |
| Texas: | 0.0% (1,669) |
Ferryboat:
| Bay City: | 0.1% (8) |
| Texas: | 0.0% (738) |
Taxicab:
| Bay City: | 0.1% (5) |
| Texas: | 0.1% (6,102) |
Motorcycle:
| Bay City: | 0.1% (10) |
| Texas: | 0.1% (12,068) |
Bicycle:
| Bay City: | 0.1% (10) |
| Texas: | 0.2% (21,551) |
Walked:
| Bay City: | 1.6% (117) |
| Texas: | 1.9% (173,670) |
Other means:
| Bay City: | 0.6% (42) |
| Texas: | 0.9% (86,692) |
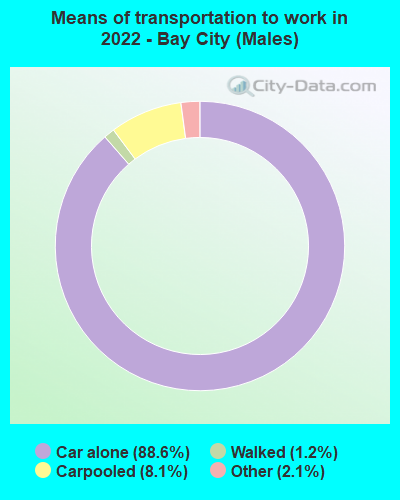

Drove car alone - Males:
| Bay City: | 88.6% (3,542) |
| Texas: | 83.6% (4,557,023) |
Carpooled - Males:
| Bay City: | 8.1% (323) |
| Texas: | 11.2% (674,818) |
Walked - Males:
| Bay City: | 1.2% (47) |
| Texas: | 1.7% (99,911) |
Other means - Males:
| Bay City: | 2.1% (84) |
| Texas: | 2.2% (95,481) |
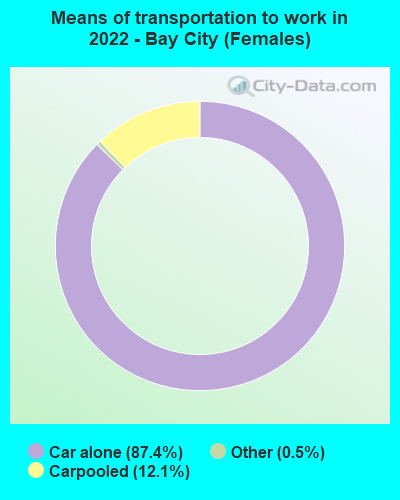

Drove car alone - Females:
| Bay City: | 87.4% (2,798) |
| Texas: | 83.0% (4,557,023) |
Carpooled - Females:
| Bay City: | 12.1% (389) |
| Texas: | 12.3% (674,818) |
Other means - Females:
| Bay City: | 0.5% (16) |
| Texas: | 1.7% (95,481) |
Private vehicle occupancy
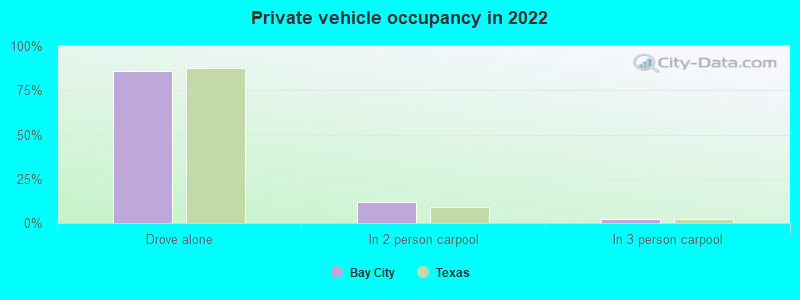
Drove alone:
| Bay City: | 85.8% (5,725) |
| Texas: | 87.6% (10,283,021) |
In 2 person carpool:
| Bay City: | 11.8% (784) |
| Texas: | 9.0% (1,052,595) |
In 3 person carpool:
| Bay City: | 2.4% (162) |
| Texas: | 2.1% (244,139) |
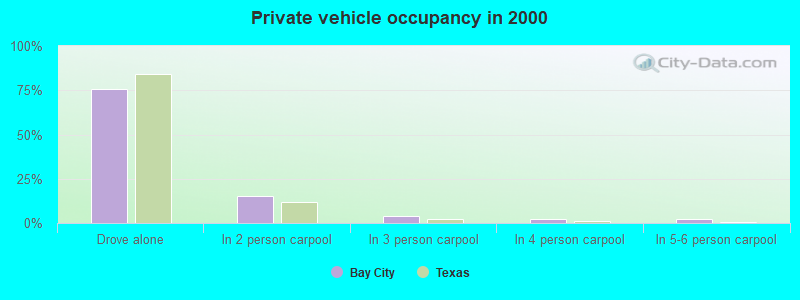
Drove alone:
| Bay City: | 75.8% (5,307) |
| Texas: | 84.3% (7,115,590) |
In 2 person carpool:
| Bay City: | 15.5% (1,086) |
| Texas: | 11.6% (982,994) |
In 3 person carpool:
| Bay City: | 3.9% (276) |
| Texas: | 2.4% (201,602) |
In 4 person carpool:
| Bay City: | 2.1% (145) |
| Texas: | 1.0% (83,518) |
In 5-6 person carpool:
| Bay City: | 2.0% (142) |
| Texas: | 0.5% (40,662) |
In 7+ person carpool:
| Bay City: | 0.6% (44) |
| Texas: | 0.2% (17,236) |
Class of workers
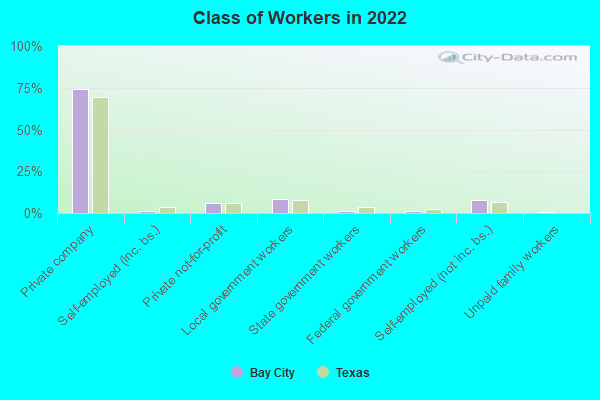
Employee of private company:
| Bay City: | 74.3% (5,363) |
| Texas: | 69.6% (10,139,666) |
Self-employed in own incorporated business:
| Bay City: | 1.0% (71) |
| Texas: | 3.5% (516,446) |
Private not-for-profit wage and salary workers:
| Bay City: | 5.8% (420) |
| Texas: | 6.0% (870,454) |
Local government workers:
| Bay City: | 8.7% (627) |
| Texas: | 7.6% (1,109,799) |
State government workers:
| Bay City: | 0.9% (66) |
| Texas: | 3.8% (558,618) |
Federal government workers:
| Bay City: | 1.0% (71) |
| Texas: | 2.5% (357,298) |
Self-employed workers in own not incorporated business:
| Bay City: | 7.6% (552) |
| Texas: | 6.8% (998,270) |
Unpaid family workers:
| Bay City: | 0.7% (51) |
| Texas: | 0.2% (27,882) |
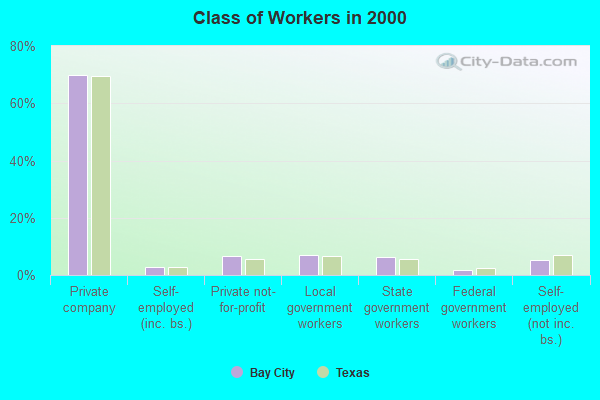
Employee of private company:
| Bay City: | 69.8% (5,204) |
| Texas: | 69.6% (6,425,274) |
Self-employed in own incorporated business:
| Bay City: | 2.8% (207) |
| Texas: | 2.7% (250,864) |
Private not-for-profit wage and salary workers:
| Bay City: | 6.5% (483) |
| Texas: | 5.7% (526,631) |
Local government workers:
| Bay City: | 7.1% (532) |
| Texas: | 6.6% (608,479) |
State government workers:
| Bay City: | 6.4% (478) |
| Texas: | 5.4% (501,082) |
Federal government workers:
| Bay City: | 1.8% (134) |
| Texas: | 2.6% (237,177) |
Self-employed workers in own not incorporated business:
| Bay City: | 5.3% (395) |
| Texas: | 7.1% (653,527) |
Unpaid family workers:
| Bay City: | 0.3% (20) |
| Texas: | 0.3% (31,338) |
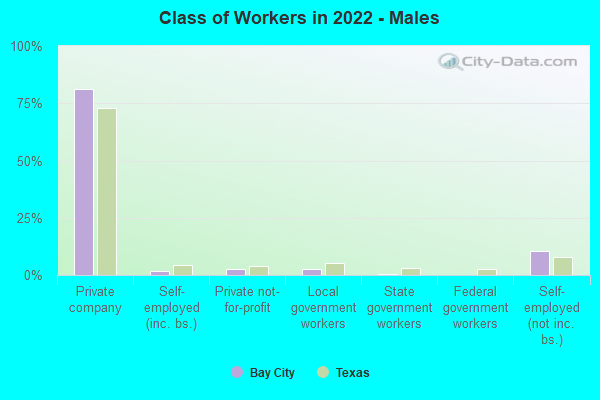
Employee of private company - Males:
| Bay City: | 81.2% (3,299) |
| Texas: | 73.1% (5,788,450) |
Self-employed in own incorporated business - Males:
| Bay City: | 1.8% (71) |
| Texas: | 4.2% (332,655) |
Private not-for-profit wage and salary workers - Males:
| Bay City: | 2.7% (109) |
| Texas: | 4.1% (323,476) |
Local government workers - Males:
| Bay City: | 2.7% (108) |
| Texas: | 5.1% (405,467) |
State government workers - Males:
| Bay City: | 0.3% (14) |
| Texas: | 3.0% (236,706) |
Self-employed workers in own not incorporated business - Males:
| Bay City: | 10.7% (434) |
| Texas: | 7.7% (609,246) |
Unpaid family workers - Males:
| Bay City: | 0.7% (28) |
| Texas: | 0.2% (12,606) |
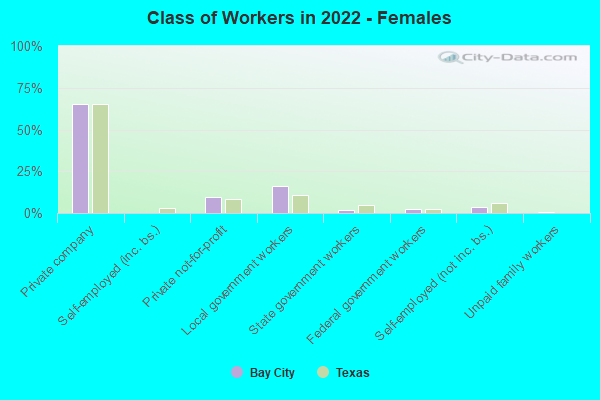
Employee of private company - Females:
| Bay City: | 65.3% (2,064) |
| Texas: | 65.4% (4,351,216) |
Private not-for-profit wage and salary workers - Females:
| Bay City: | 9.9% (311) |
| Texas: | 8.2% (546,978) |
Local government workers - Females:
| Bay City: | 16.4% (519) |
| Texas: | 10.6% (704,332) |
State government workers - Females:
| Bay City: | 1.7% (52) |
| Texas: | 4.8% (321,912) |
Federal government workers - Females:
| Bay City: | 2.3% (71) |
| Texas: | 2.2% (145,669) |
Self-employed workers in own not incorporated business - Females:
| Bay City: | 3.7% (118) |
| Texas: | 5.8% (389,024) |
Unpaid family workers - Females:
| Bay City: | 0.7% (23) |
| Texas: | 0.2% (15,276) |