Work and Jobs in Cherry Valley, California (CA) Detailed Stats
Occupations, Industries, Unemployment, Workers, Commute
Settings
X


Recent posts about work in Cherry Valley, California on our local forum with over 2,400,000 registered users:
 | Are there jobs in the IE? (17 replies) |
| Will LA eventually get so dense, that OC and The IE become too far/impossible to commute from by car? (95 replies) |
| Need info on Cherry Valley, CA area (11 replies) |
| Michigan to Palm Springs area (10 replies) |
| What is your favorite Inland Empire city? (72 replies) |
| From South Minneapolis to South California... But what city? (6 replies) |
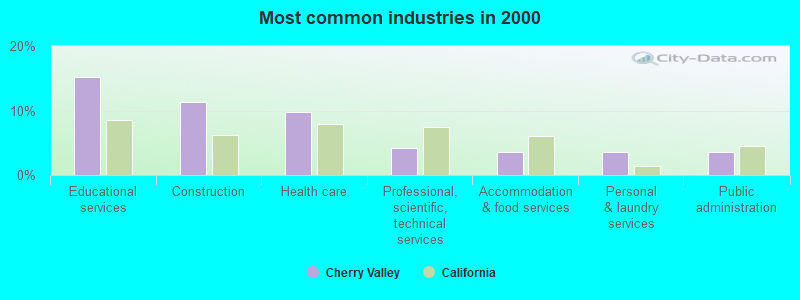
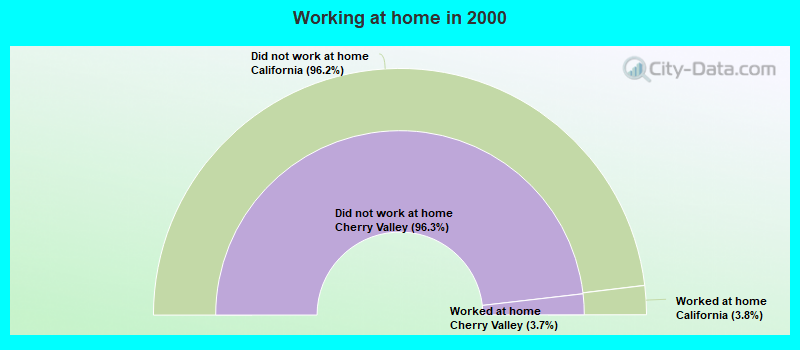
The most common industries in Cherry Valley are: Educational services (15.3% of civilian employees), Construction (11.3% of civilian employees), Health care (9.8% of civilian employees). 65.4% of workers work in Riverside County and 10.4% of all workers work at home. 62.6% of workers are employees of private companies, which is 6.2% less than the rate of 66.5% across the entire state of California.
Whole page based on the data from 2000 / 2022 when the population of Cherry Valley, California was 5,891 / 7,792
Whole page based on the data from 2000 / 2022 when the population of Cherry Valley, California was 5,891 / 7,792
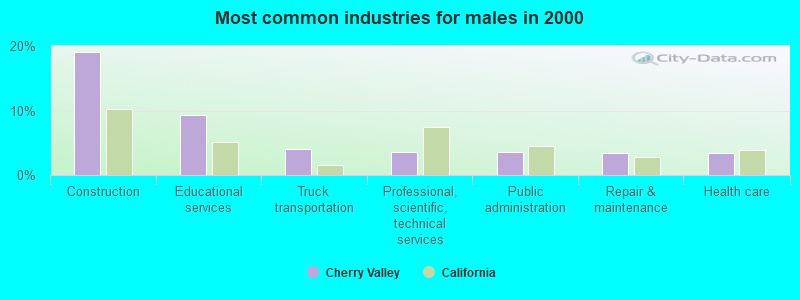
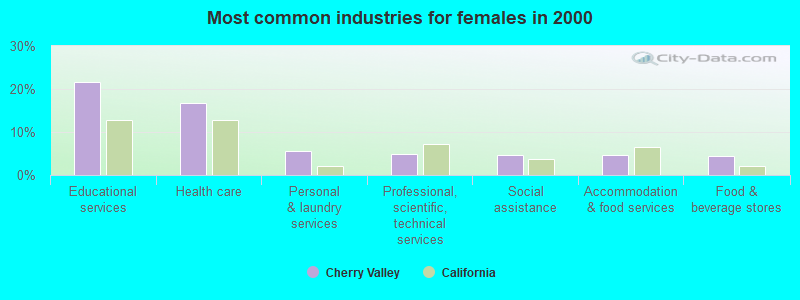
Most common industries
Most common industries | |||
|---|---|---|---|
Industry | All | Males | Females |
| Educational services | 15.3% (339) | 9.3% (107) | 21.7% (232) |
| Construction | 11.3% (250) | 19.1% (220) | 2.8% (30) |
| Health care | 9.8% (218) | 3.4% (39) | 16.8% (179) |
| Professional, scientific, and technical services | 4.2% (94) | 3.6% (42) | 4.9% (52) |
| Accommodation and food services | 3.6% (79) | 2.5% (29) | 4.7% (50) |
| Personal and laundry services | 3.6% (79) | 1.7% (20) | 5.5% (59) |
| Public administration | 3.5% (78) | 3.6% (42) | 3.4% (36) |
| Social assistance | 3.3% (74) | 2.1% (24) | 4.7% (50) |
| Food and beverage stores | 3.3% (73) | 2.3% (27) | 4.3% (46) |
| Finance and insurance | 3.1% (69) | 2.5% (29) | 3.7% (40) |
| Real estate and rental and leasing | 2.6% (57) | 2.0% (23) | 3.2% (34) |
| Repair and maintenance | 2.3% (51) | 3.5% (40) | 1.0% (11) |
| Computer and electronic products | 2.3% (50) | 2.9% (33) | 1.6% (17) |
| Other transportation, and support activities, and couriers | 2.1% (47) | 2.6% (30) | 1.6% (17) |
| Truck transportation | 2.1% (46) | 4.0% (46) | 0.0% (0) |
| Arts, entertainment, and recreation | 1.9% (43) | 3.0% (35) | 0.7% (8) |
| Motor vehicle and parts dealers | 1.9% (42) | 2.9% (34) | 0.7% (8) |
| Religious, grantmaking, civic, professional, and similar organizations | 1.7% (38) | 2.0% (23) | 1.4% (15) |
| Used merchandise, gift, novelty, and souvenir, and other miscellaneous stores | 1.7% (37) | 1.8% (21) | 1.5% (16) |
| Administrative and support and waste management services | 1.6% (35) | 3.0% (35) | 0.0% (0) |
| Department and other general merchandise stores | 1.5% (34) | 0.9% (10) | 2.2% (24) |
| Metal and metal products | 1.5% (33) | 2.9% (33) | 0.0% (0) |
| Farm supplies merchant wholesalers | 1.5% (33) | 1.9% (22) | 1.0% (11) |
| Broadcasting and telecommunications | 1.4% (32) | 1.4% (16) | 1.5% (16) |
| Agriculture, forestry, fishing and hunting | 1.4% (31) | 2.0% (23) | 0.7% (8) |
| Furniture and home furnishings, and household appliance stores | 1.2% (27) | 0.8% (9) | 1.7% (18) |
| Machinery | 1.0% (22) | 1.9% (22) | 0.0% (0) |
| Furniture and related product manufacturing | 0.9% (21) | 1.0% (12) | 0.8% (9) |
| Plastics and rubber products | 0.8% (18) | 1.0% (11) | 0.7% (7) |
| Transportation equipment | 0.8% (18) | 1.6% (18) | 0.0% (0) |
| Printing and related support activities | 0.7% (16) | 0.5% (6) | 0.9% (10) |
| Other direct selling establishments | 0.7% (16) | 0.0% (0) | 1.5% (16) |
| Publishing, and motion picture and sound recording industries | 0.7% (16) | 0.7% (8) | 0.7% (8) |
| Utilities | 0.7% (15) | 1.3% (15) | 0.0% (0) |
| Wood products | 0.6% (13) | 1.1% (13) | 0.0% (0) |
| Building material and garden equipment and supplies dealers | 0.6% (13) | 1.1% (13) | 0.0% (0) |
| Radio, TV, and computer stores | 0.5% (10) | 0.0% (0) | 0.9% (10) |
| Management of companies and enterprises | 0.5% (10) | 0.0% (0) | 0.9% (10) |
| Miscellaneous manufacturing | 0.5% (10) | 0.9% (10) | 0.0% (0) |
| Clothing and accessories, including shoe, stores | 0.4% (8) | 0.0% (0) | 0.7% (8) |
| Food | 0.3% (7) | 0.6% (7) | 0.0% (0) |
| Air transportation | 0.3% (7) | 0.0% (0) | 0.7% (7) |
| Groceries and related products merchant wholesalers | 0.3% (7) | 0.6% (7) | 0.0% (0) |
| Health and personal care, except drug, stores | 0.3% (6) | 0.0% (0) | 0.6% (6) |
Unemployment in Cherry Valley
- Unemployment by race in 2022
- Unemployment rate for White non-Hispanic residents
- 6.0%Males
- 4.1%Females
- Unemployment rate for Asian residents
- 28.4%Males
- Unemployment rate for other race residents
- 13.9%Males
- 19.2%Females
- Unemployment rate for two or more race residents
- 32.1%Males
- Unemployment rate for Hispanic or Latino residents
- 24.7%Males
- 4.0%Females
- Unemployment by race in 2000
- Unemployment rate for White non-Hispanic residents
- 9.5%Males
- 3.9%Females
- Unemployment rate for Hispanic or Latino residents
- 8.4%Males
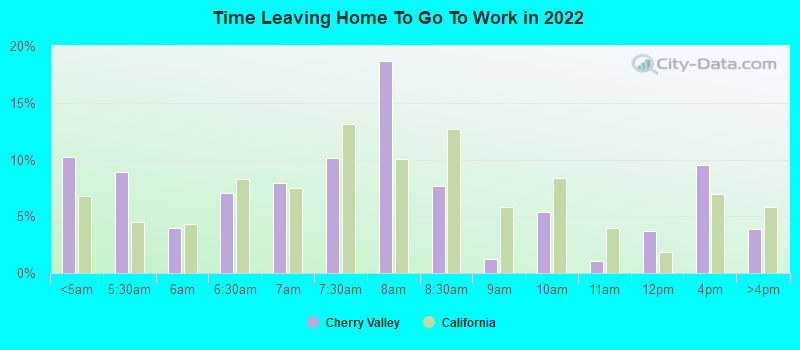
Time leaving home to go to work
12:00 a.m. to 4:59 a.m.:
| Cherry Valley: | 10.2% (283) |
| California: | 6.8% (1,050,902) |
5:00 a.m. to 5:29 a.m.:
| Cherry Valley: | 8.9% (245) |
| California: | 4.5% (692,772) |
5:30 a.m. to 5:59 a.m.:
| Cherry Valley: | 4.0% (110) |
| California: | 4.3% (665,475) |
6:00 a.m. to 6:29 a.m.:
| Cherry Valley: | 7.0% (194) |
| California: | 8.3% (1,273,588) |
6:30 a.m. to 6:59 a.m.:
| Cherry Valley: | 7.9% (218) |
| California: | 7.5% (1,156,338) |
7:00 a.m. to 7:29 a.m.:
| Cherry Valley: | 10.2% (281) |
| California: | 13.2% (2,027,702) |
7:30 a.m. to 7:59 a.m.:
| Cherry Valley: | 18.7% (516) |
| California: | 10.1% (1,550,402) |
8:00 a.m. to 8:29 a.m.:
| Cherry Valley: | 7.6% (211) |
| California: | 12.7% (1,953,986) |
8:30 a.m. to 8:59 a.m.:
| Cherry Valley: | 1.2% (34) |
| California: | 5.8% (890,950) |
9:00 a.m. to 9:59 a.m.:
| Cherry Valley: | 5.4% (148) |
| California: | 8.4% (1,288,499) |
10:00 a.m. to 10:59 a.m.:
| Cherry Valley: | 1.0% (28) |
| California: | 4.0% (613,193) |
11:00 a.m. to 11:59 a.m.:
| Cherry Valley: | 3.7% (101) |
| California: | 1.8% (280,975) |
12:00 p.m. to 3:59 p.m.:
| Cherry Valley: | 9.5% (262) |
| California: | 7.0% (1,075,505) |
4:00 p.m. to 11:59 p.m.:
| Cherry Valley: | 3.9% (107) |
| California: | 5.8% (891,240) |
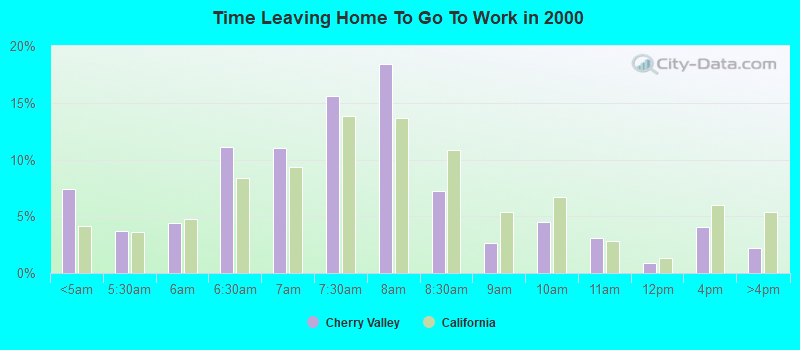
<5am:
| Cherry Valley: | 7.4% (161) |
| California: | 4.2% (606,086) |
5:30am:
| Cherry Valley: | 3.7% (81) |
| California: | 3.6% (523,209) |
6am:
| Cherry Valley: | 4.4% (97) |
| California: | 4.8% (692,256) |
6:30am:
| Cherry Valley: | 11.1% (242) |
| California: | 8.4% (1,216,867) |
7am:
| Cherry Valley: | 11.0% (240) |
| California: | 9.4% (1,362,830) |
7:30am:
| Cherry Valley: | 15.6% (340) |
| California: | 13.8% (2,006,950) |
8am:
| Cherry Valley: | 18.4% (402) |
| California: | 13.7% (1,986,831) |
8:30am:
| Cherry Valley: | 7.2% (158) |
| California: | 10.9% (1,577,815) |
9am:
| Cherry Valley: | 2.7% (58) |
| California: | 5.4% (778,152) |
10am:
| Cherry Valley: | 4.5% (98) |
| California: | 6.7% (972,355) |
11am:
| Cherry Valley: | 3.1% (68) |
| California: | 2.9% (414,479) |
12pm:
| Cherry Valley: | 0.9% (20) |
| California: | 1.3% (189,005) |
4pm:
| Cherry Valley: | 4.0% (88) |
| California: | 6.0% (865,284) |
>4pm:
| Cherry Valley: | 2.2% (49) |
| California: | 5.3% (776,167) |
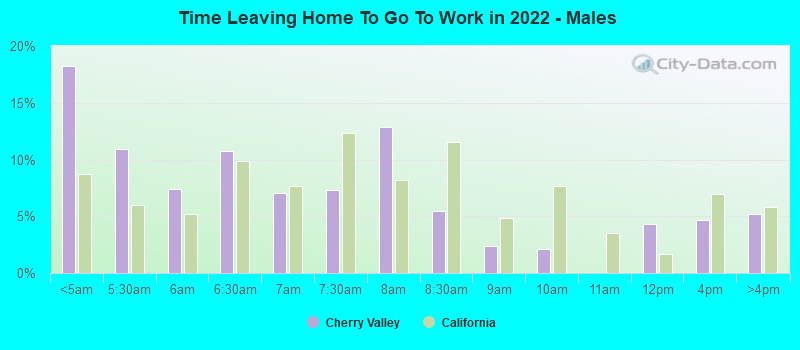
12:00 a.m. to 4:59 a.m. - Males:
| Cherry Valley: | 18.3% (254) |
| California: | 8.7% (747,612) |
5:00 a.m. to 5:29 a.m. - Males:
| Cherry Valley: | 11.0% (153) |
| California: | 6.0% (509,420) |
5:30 a.m. to 5:59 a.m. - Males:
| Cherry Valley: | 7.4% (103) |
| California: | 5.2% (448,269) |
6:00 a.m. to 6:29 a.m. - Males:
| Cherry Valley: | 10.8% (150) |
| California: | 9.8% (842,941) |
6:30 a.m. to 6:59 a.m. - Males:
| Cherry Valley: | 7.1% (99) |
| California: | 7.7% (657,557) |
7:00 a.m. to 7:29 a.m. - Males:
| Cherry Valley: | 7.3% (102) |
| California: | 12.4% (1,058,532) |
7:30 a.m. to 7:59 a.m. - Males:
| Cherry Valley: | 12.9% (179) |
| California: | 8.2% (702,727) |
8:00 a.m. to 8:29 a.m. - Males:
| Cherry Valley: | 5.4% (75) |
| California: | 11.5% (984,538) |
8:30 a.m. to 8:59 a.m. - Males:
| Cherry Valley: | 2.4% (33) |
| California: | 4.8% (414,815) |
9:00 a.m. to 9:59 a.m. - Males:
| Cherry Valley: | 2.1% (30) |
| California: | 7.7% (655,038) |
11:00 a.m. to 11:59 a.m. - Males:
| Cherry Valley: | 4.3% (60) |
| California: | 1.7% (141,620) |
12:00 p.m. to 3:59 p.m. - Males:
| Cherry Valley: | 4.6% (64) |
| California: | 7.0% (594,847) |
4:00 p.m. to 11:59 p.m. - Males:
| Cherry Valley: | 5.2% (72) |
| California: | 5.8% (499,471) |
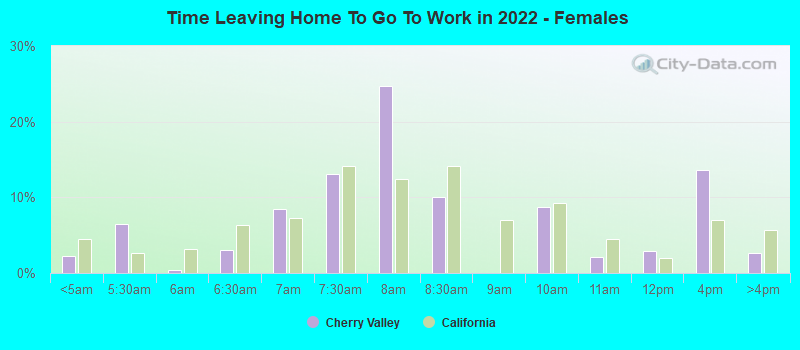
12:00 a.m. to 4:59 a.m. - Females:
| Cherry Valley: | 2.3% (31) |
| California: | 4.4% (303,290) |
5:00 a.m. to 5:29 a.m. - Females:
| Cherry Valley: | 6.4% (88) |
| California: | 2.7% (183,352) |
5:30 a.m. to 5:59 a.m. - Females:
| Cherry Valley: | 0.4% (6) |
| California: | 3.2% (217,206) |
6:00 a.m. to 6:29 a.m. - Females:
| Cherry Valley: | 3.1% (42) |
| California: | 6.3% (430,647) |
6:30 a.m. to 6:59 a.m. - Females:
| Cherry Valley: | 8.5% (116) |
| California: | 7.3% (498,781) |
7:00 a.m. to 7:29 a.m. - Females:
| Cherry Valley: | 13.1% (180) |
| California: | 14.1% (969,170) |
7:30 a.m. to 7:59 a.m. - Females:
| Cherry Valley: | 24.7% (339) |
| California: | 12.4% (847,675) |
8:00 a.m. to 8:29 a.m. - Females:
| Cherry Valley: | 10.1% (138) |
| California: | 14.1% (969,448) |
9:00 a.m. to 9:59 a.m. - Females:
| Cherry Valley: | 8.7% (119) |
| California: | 9.2% (633,461) |
10:00 a.m. to 10:59 a.m. - Females:
| Cherry Valley: | 2.1% (29) |
| California: | 4.5% (311,768) |
11:00 a.m. to 11:59 a.m. - Females:
| Cherry Valley: | 2.9% (40) |
| California: | 2.0% (139,355) |
12:00 p.m. to 3:59 p.m. - Females:
| Cherry Valley: | 13.6% (187) |
| California: | 7.0% (480,658) |
4:00 p.m. to 11:59 p.m. - Females:
| Cherry Valley: | 2.6% (36) |
| California: | 5.7% (391,769) |
Travel time to work
Percentage of workers working in this county: 65.4%
Number of people working at home: 328 (10.4% of all workers)
Number of people working at home: 328 (10.4% of all workers)
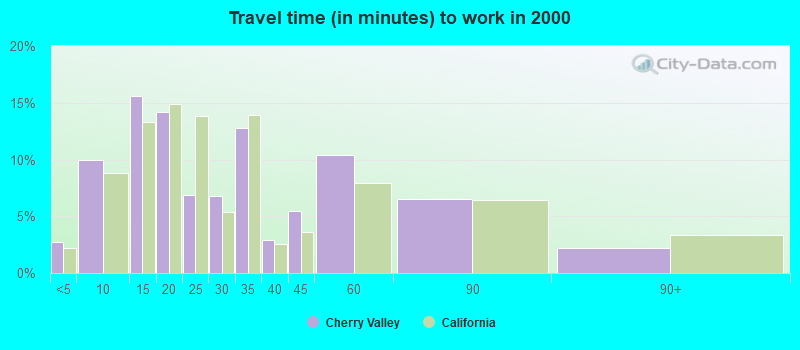
Less than 5 minutes:
| Cherry Valley: | 2.7% (59) |
| California: | 2.2% (324,703) |
5 to 9 minutes:
| Cherry Valley: | 10.0% (218) |
| California: | 8.8% (1,280,443) |
10 to 14 minutes:
| Cherry Valley: | 15.6% (340) |
| California: | 13.3% (1,930,263) |
15 to 19 minutes:
| Cherry Valley: | 14.2% (309) |
| California: | 14.9% (2,157,970) |
20 to 24 minutes:
| Cherry Valley: | 6.8% (149) |
| California: | 13.8% (2,004,060) |
25 to 29 minutes:
| Cherry Valley: | 6.8% (148) |
| California: | 5.4% (782,241) |
30 to 34 minutes:
| Cherry Valley: | 12.8% (279) |
| California: | 13.9% (2,025,657) |
35 to 39 minutes:
| Cherry Valley: | 2.9% (63) |
| California: | 2.5% (366,487) |
40 to 44 minutes:
| Cherry Valley: | 5.5% (119) |
| California: | 3.6% (528,043) |
45 to 59 minutes:
| Cherry Valley: | 10.4% (227) |
| California: | 7.9% (1,151,598) |
60 to 89 minutes:
| Cherry Valley: | 6.5% (142) |
| California: | 6.4% (933,123) |
90 or more minutes:
| Cherry Valley: | 2.2% (49) |
| California: | 3.3% (483,698) |
Means of transportation to work
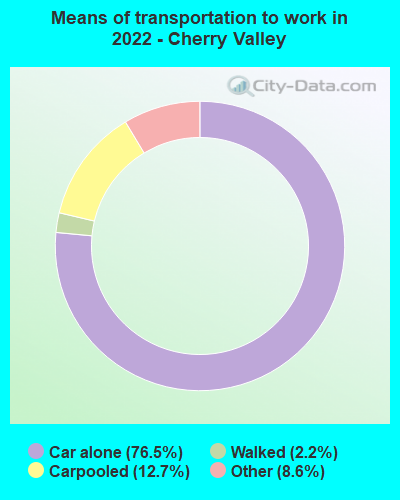

Drove car alone:
| Cherry Valley: | 76.5% (459) |
| California: | 79.1% (5,345,368) |
Carpooled:
| Cherry Valley: | 12.7% (76) |
| California: | 11.9% (878,699) |
Walked:
| Cherry Valley: | 2.2% (13) |
| California: | 2.9% (218,374) |
Other means:
| Cherry Valley: | 8.6% (52) |
| California: | 2.1% (137,489) |
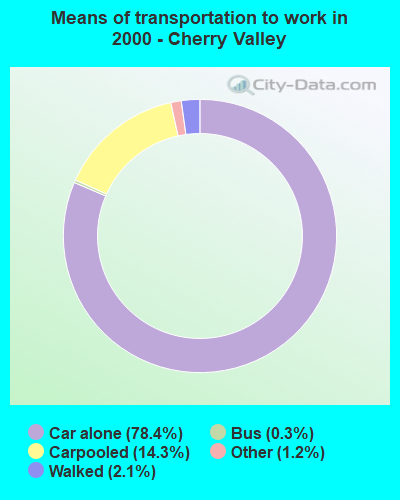

Drove car alone:
| Cherry Valley: | 78.4% (1,710) |
| California: | 71.8% (10,432,462) |
Carpooled:
| Cherry Valley: | 14.3% (313) |
| California: | 14.5% (2,113,313) |
Bus or trolley bus:
| Cherry Valley: | 0.3% (7) |
| California: | 3.8% (549,425) |
Walked:
| Cherry Valley: | 2.1% (46) |
| California: | 2.9% (414,581) |
Other means:
| Cherry Valley: | 1.2% (26) |
| California: | 0.8% (115,064) |
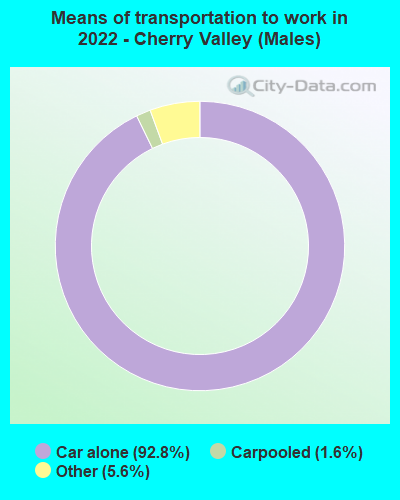

Drove car alone - Males:
| Cherry Valley: | 92.8% (318) |
| California: | 80.0% (5,345,368) |
Carpooled - Males:
| Cherry Valley: | 1.6% (5) |
| California: | 11.1% (878,699) |
Other means - Males:
| Cherry Valley: | 5.6% (19) |
| California: | 2.1% (137,489) |
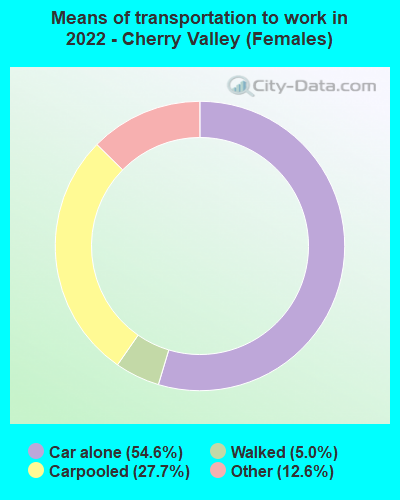

Drove car alone - Females:
| Cherry Valley: | 54.6% (141) |
| California: | 77.9% (5,345,368) |
Carpooled - Females:
| Cherry Valley: | 27.7% (71) |
| California: | 12.8% (878,699) |
Walked - Females:
| Cherry Valley: | 5.0% (13) |
| California: | 3.2% (218,374) |
Other means - Females:
| Cherry Valley: | 12.6% (32) |
| California: | 2.0% (137,489) |
Private vehicle occupancy
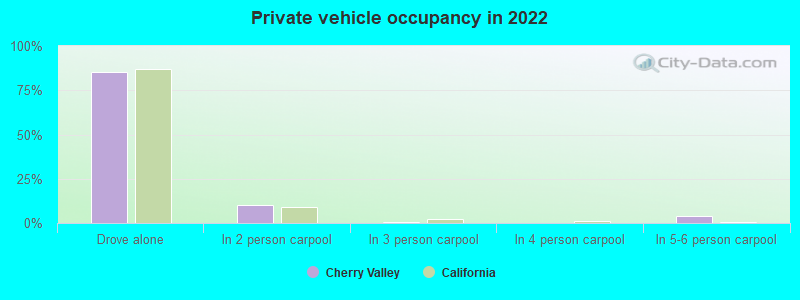
Drove alone:
| Cherry Valley: | 85.1% (2,262) |
| California: | 86.9% (12,187,486) |
In 2 person carpool:
| Cherry Valley: | 10.0% (267) |
| California: | 9.2% (1,295,561) |
In 3 person carpool:
| Cherry Valley: | 0.7% (19) |
| California: | 2.2% (309,969) |
In 5-6 person carpool:
| Cherry Valley: | 4.1% (110) |
| California: | 0.5% (70,825) |
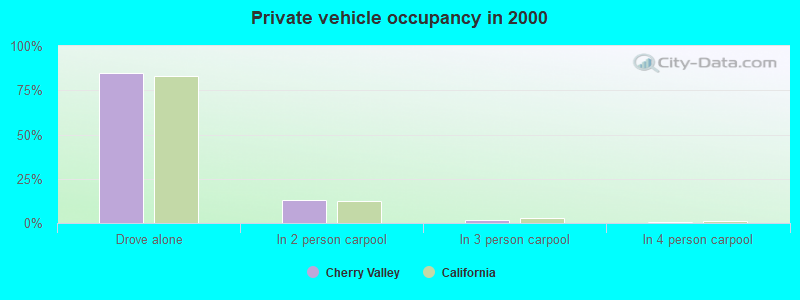
Drove alone:
| Cherry Valley: | 84.5% (1,710) |
| California: | 83.2% (10,432,462) |
In 2 person carpool:
| Cherry Valley: | 13.2% (268) |
| California: | 12.5% (1,564,905) |
In 3 person carpool:
| Cherry Valley: | 1.6% (33) |
| California: | 2.6% (330,732) |
In 4 person carpool:
| Cherry Valley: | 0.6% (12) |
| California: | 1.0% (119,364) |
Class of workers
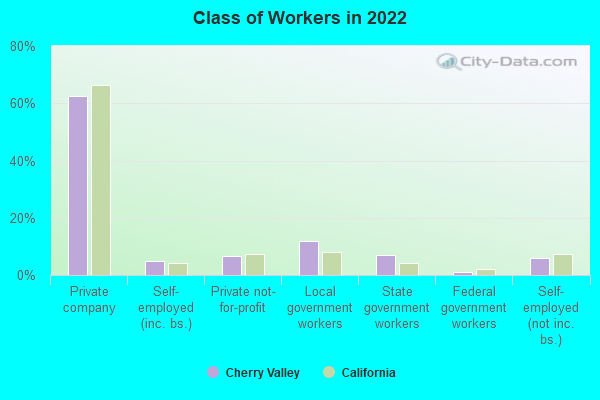
Employee of private company:
| Cherry Valley: | 62.6% (2,055) |
| California: | 66.5% (12,596,030) |
Self-employed in own incorporated business:
| Cherry Valley: | 5.0% (163) |
| California: | 4.1% (784,709) |
Private not-for-profit wage and salary workers:
| Cherry Valley: | 6.5% (212) |
| California: | 7.5% (1,417,407) |
Local government workers:
| Cherry Valley: | 11.8% (388) |
| California: | 8.2% (1,547,056) |
State government workers:
| Cherry Valley: | 7.1% (232) |
| California: | 4.1% (780,915) |
Federal government workers:
| Cherry Valley: | 1.0% (34) |
| California: | 2.0% (369,858) |
Self-employed workers in own not incorporated business:
| Cherry Valley: | 6.0% (197) |
| California: | 7.4% (1,410,735) |
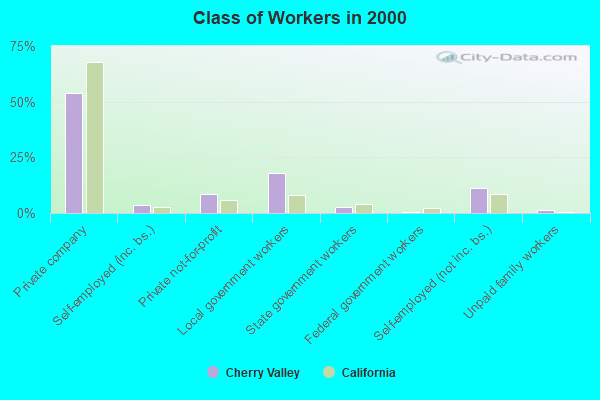
Employee of private company:
| Cherry Valley: | 53.8% (1,196) |
| California: | 68.0% (10,009,465) |
Self-employed in own incorporated business:
| Cherry Valley: | 3.4% (76) |
| California: | 2.7% (402,392) |
Private not-for-profit wage and salary workers:
| Cherry Valley: | 8.6% (191) |
| California: | 5.7% (845,536) |
Local government workers:
| Cherry Valley: | 18.0% (400) |
| California: | 8.3% (1,218,764) |
State government workers:
| Cherry Valley: | 2.9% (64) |
| California: | 4.0% (594,953) |
Federal government workers:
| Cherry Valley: | 0.6% (14) |
| California: | 2.3% (344,354) |
Self-employed workers in own not incorporated business:
| Cherry Valley: | 11.4% (253) |
| California: | 8.5% (1,249,530) |
Unpaid family workers:
| Cherry Valley: | 1.3% (28) |
| California: | 0.4% (53,934) |
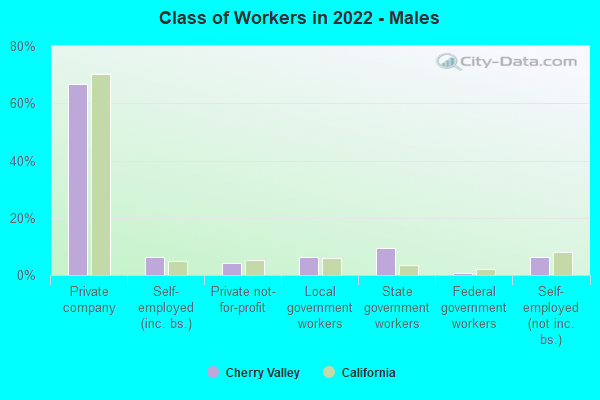
Employee of private company - Males:
| Cherry Valley: | 66.9% (1,127) |
| California: | 70.3% (7,191,252) |
Self-employed in own incorporated business - Males:
| Cherry Valley: | 6.3% (107) |
| California: | 4.9% (504,764) |
Private not-for-profit wage and salary workers - Males:
| Cherry Valley: | 4.3% (73) |
| California: | 5.2% (529,122) |
Local government workers - Males:
| Cherry Valley: | 6.1% (104) |
| California: | 6.0% (610,331) |
State government workers - Males:
| Cherry Valley: | 9.5% (160) |
| California: | 3.4% (343,636) |
Federal government workers - Males:
| Cherry Valley: | 0.7% (12) |
| California: | 2.1% (209,874) |
Self-employed workers in own not incorporated business - Males:
| Cherry Valley: | 6.1% (104) |
| California: | 8.1% (824,359) |
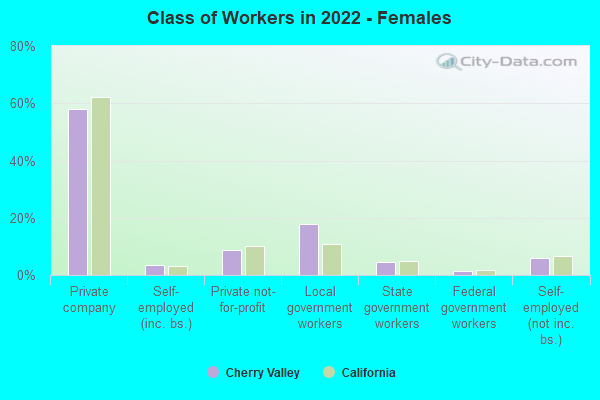
Employee of private company - Females:
| Cherry Valley: | 58.1% (928) |
| California: | 62.0% (5,404,778) |
Self-employed in own incorporated business - Females:
| Cherry Valley: | 3.5% (57) |
| California: | 3.2% (279,945) |
Private not-for-profit wage and salary workers - Females:
| Cherry Valley: | 8.8% (140) |
| California: | 10.2% (888,285) |
Local government workers - Females:
| Cherry Valley: | 17.8% (284) |
| California: | 10.8% (936,725) |
State government workers - Females:
| Cherry Valley: | 4.5% (72) |
| California: | 5.0% (437,279) |
Federal government workers - Females:
| Cherry Valley: | 1.4% (22) |
| California: | 1.8% (159,984) |
Self-employed workers in own not incorporated business - Females:
| Cherry Valley: | 5.9% (94) |
| California: | 6.7% (586,376) |