Cherry Valley, California Submit your own pictures of this place and show them to the world
OSM Map
General Map
Google Map
MSN Map
OSM Map
General Map
Google Map
MSN Map
OSM Map
General Map
Google Map
MSN Map
OSM Map
General Map
Google Map
MSN Map
Please wait while loading the map...
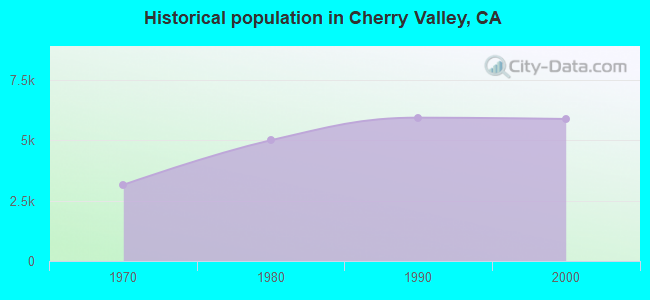
Population in 2010: 6,362. Population change since 2000: +8.0%Males: 3,317 Females: 3,045
March 2022 cost of living index in Cherry Valley: 81.7 (low, U.S. average is 100) Percentage of residents living in poverty in 2022: 9.9%for White Non-Hispanic residents , 8.3% for Black residents , 8.0% for Hispanic or Latino residents , 48.3% for Native Hawaiian and other Pacific Islander residents , 9.6% for other race residents , 10.9% for two or more races residents )
Profiles of local businesses
Business Search - 14 Million verified businesses
Data:
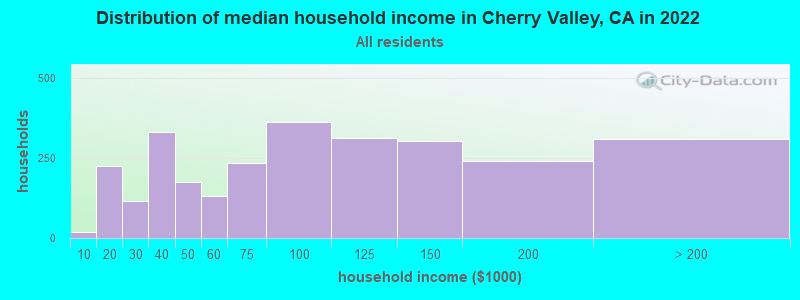
Median household income ($)
Median household income (% change since 2000)
Household income diversity
Ratio of average income to average house value (%)
Ratio of average income to average rent
Median household income ($) - White
Median household income ($) - Black or African American
Median household income ($) - Asian
Median household income ($) - Hispanic or Latino
Median household income ($) - American Indian and Alaska Native
Median household income ($) - Multirace
Median household income ($) - Other Race
Median household income for houses/condos with a mortgage ($)
Median household income for apartments without a mortgage ($)
Races - White alone (%)
Races - White alone (% change since 2000)
Races - Black alone (%)
Races - Black alone (% change since 2000)
Races - American Indian alone (%)
Races - American Indian alone (% change since 2000)
Races - Asian alone (%)
Races - Asian alone (% change since 2000)
Races - Hispanic (%)
Races - Hispanic (% change since 2000)
Races - Native Hawaiian and Other Pacific Islander alone (%)
Races - Native Hawaiian and Other Pacific Islander alone (% change since 2000)
Races - Two or more races (%)
Races - Two or more races (% change since 2000)
Races - Other race alone (%)
Races - Other race alone (% change since 2000)
Racial diversity
Unemployment (%)
Unemployment (% change since 2000)
Unemployment (%) - White
Unemployment (%) - Black or African American
Unemployment (%) - Asian
Unemployment (%) - Hispanic or Latino
Unemployment (%) - American Indian and Alaska Native
Unemployment (%) - Multirace
Unemployment (%) - Other Race
Population density (people per square mile)
Population - Males (%)
Population - Females (%)
Population - Males (%) - White
Population - Males (%) - Black or African American
Population - Males (%) - Asian
Population - Males (%) - Hispanic or Latino
Population - Males (%) - American Indian and Alaska Native
Population - Males (%) - Multirace
Population - Males (%) - Other Race
Population - Females (%) - White
Population - Females (%) - Black or African American
Population - Females (%) - Asian
Population - Females (%) - Hispanic or Latino
Population - Females (%) - American Indian and Alaska Native
Population - Females (%) - Multirace
Population - Females (%) - Other Race
Coronavirus confirmed cases (Apr 28, 2024)
Deaths caused by coronavirus (Apr 28, 2024)
Coronavirus confirmed cases (per 100k population) (Apr 28, 2024)
Deaths caused by coronavirus (per 100k population) (Apr 28, 2024)
Daily increase in number of cases (Apr 28, 2024)
Weekly increase in number of cases (Apr 28, 2024)
Cases doubled (in days) (Apr 28, 2024)
Hospitalized patients (Apr 18, 2022)
Negative test results (Apr 18, 2022)
Total test results (Apr 18, 2022)
COVID Vaccine doses distributed (per 100k population) (Sep 19, 2023)
COVID Vaccine doses administered (per 100k population) (Sep 19, 2023)
COVID Vaccine doses distributed (Sep 19, 2023)
COVID Vaccine doses administered (Sep 19, 2023)
Likely homosexual households (%)
Likely homosexual households (% change since 2000)
Likely homosexual households - Lesbian couples (%)
Likely homosexual households - Lesbian couples (% change since 2000)
Likely homosexual households - Gay men (%)
Likely homosexual households - Gay men (% change since 2000)
Cost of living index
Median gross rent ($)
Median contract rent ($)
Median monthly housing costs ($)
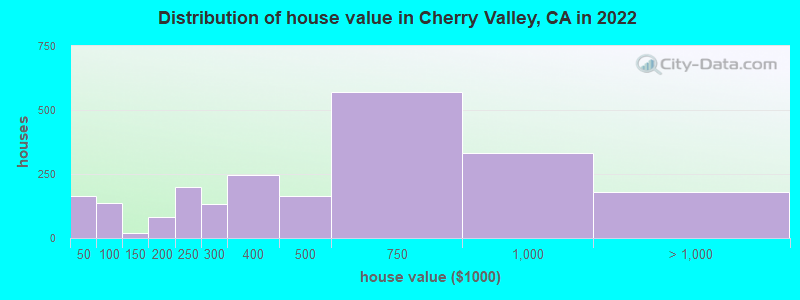
Median house or condo value ($)
Median house or condo value ($ change since 2000)
Mean house or condo value by units in structure - 1, detached ($)
Mean house or condo value by units in structure - 1, attached ($)
Mean house or condo value by units in structure - 2 ($)
Mean house or condo value by units in structure by units in structure - 3 or 4 ($)
Mean house or condo value by units in structure - 5 or more ($)
Mean house or condo value by units in structure - Boat, RV, van, etc. ($)
Mean house or condo value by units in structure - Mobile home ($)
Median house or condo value ($) - White
Median house or condo value ($) - Black or African American
Median house or condo value ($) - Asian
Median house or condo value ($) - Hispanic or Latino
Median house or condo value ($) - American Indian and Alaska Native
Median house or condo value ($) - Multirace
Median house or condo value ($) - Other Race
Median resident age
Resident age diversity
Median resident age - Males
Median resident age - Females
Median resident age - White
Median resident age - Black or African American
Median resident age - Asian
Median resident age - Hispanic or Latino
Median resident age - American Indian and Alaska Native
Median resident age - Multirace
Median resident age - Other Race
Median resident age - Males - White
Median resident age - Males - Black or African American
Median resident age - Males - Asian
Median resident age - Males - Hispanic or Latino
Median resident age - Males - American Indian and Alaska Native
Median resident age - Males - Multirace
Median resident age - Males - Other Race
Median resident age - Females - White
Median resident age - Females - Black or African American
Median resident age - Females - Asian
Median resident age - Females - Hispanic or Latino
Median resident age - Females - American Indian and Alaska Native
Median resident age - Females - Multirace
Median resident age - Females - Other Race
Commute - mean travel time to work (minutes)
Travel time to work - Less than 5 minutes (%)
Travel time to work - Less than 5 minutes (% change since 2000)
Travel time to work - 5 to 9 minutes (%)
Travel time to work - 5 to 9 minutes (% change since 2000)
Travel time to work - 10 to 19 minutes (%)
Travel time to work - 10 to 19 minutes (% change since 2000)
Travel time to work - 20 to 29 minutes (%)
Travel time to work - 20 to 29 minutes (% change since 2000)
Travel time to work - 30 to 39 minutes (%)
Travel time to work - 30 to 39 minutes (% change since 2000)
Travel time to work - 40 to 59 minutes (%)
Travel time to work - 40 to 59 minutes (% change since 2000)
Travel time to work - 60 to 89 minutes (%)
Travel time to work - 60 to 89 minutes (% change since 2000)
Travel time to work - 90 or more minutes (%)
Travel time to work - 90 or more minutes (% change since 2000)
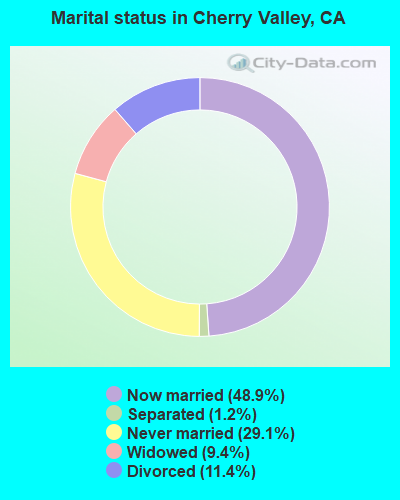
Marital status - Never married (%)
Marital status - Now married (%)
Marital status - Separated (%)
Marital status - Widowed (%)
Marital status - Divorced (%)
Median family income ($)
Median family income (% change since 2000)
Median non-family income ($)
Median non-family income (% change since 2000)
Median per capita income ($)
Median per capita income (% change since 2000)
Median family income ($) - White
Median family income ($) - Black or African American
Median family income ($) - Asian
Median family income ($) - Hispanic or Latino
Median family income ($) - American Indian and Alaska Native
Median family income ($) - Multirace
Median family income ($) - Other Race
Median year house/condo built
Median year apartment built
Year house built - Built 2005 or later (%)
Year house built - Built 2000 to 2004 (%)
Year house built - Built 1990 to 1999 (%)
Year house built - Built 1980 to 1989 (%)
Year house built - Built 1970 to 1979 (%)
Year house built - Built 1960 to 1969 (%)
Year house built - Built 1950 to 1959 (%)
Year house built - Built 1940 to 1949 (%)
Year house built - Built 1939 or earlier (%)
Average household size
Household density (households per square mile)
Average household size - White
Average household size - Black or African American
Average household size - Asian
Average household size - Hispanic or Latino
Average household size - American Indian and Alaska Native
Average household size - Multirace
Average household size - Other Race
Occupied housing units (%)
Vacant housing units (%)
Owner occupied housing units (%)
Renter occupied housing units (%)
Vacancy status - For rent (%)
Vacancy status - For sale only (%)
Vacancy status - Rented or sold, not occupied (%)
Vacancy status - For seasonal, recreational, or occasional use (%)
Vacancy status - For migrant workers (%)
Vacancy status - Other vacant (%)
Residents with income below the poverty level (%)
Residents with income below 50% of the poverty level (%)
Children below poverty level (%)
Poor families by family type - Married-couple family (%)
Poor families by family type - Male, no wife present (%)
Poor families by family type - Female, no husband present (%)
Poverty status for native-born residents (%)
Poverty status for foreign-born residents (%)
Poverty among high school graduates not in families (%)
Poverty among people who did not graduate high school not in families (%)
Residents with income below the poverty level (%) - White
Residents with income below the poverty level (%) - Black or African American
Residents with income below the poverty level (%) - Asian
Residents with income below the poverty level (%) - Hispanic or Latino
Residents with income below the poverty level (%) - American Indian and Alaska Native
Residents with income below the poverty level (%) - Multirace
Residents with income below the poverty level (%) - Other Race
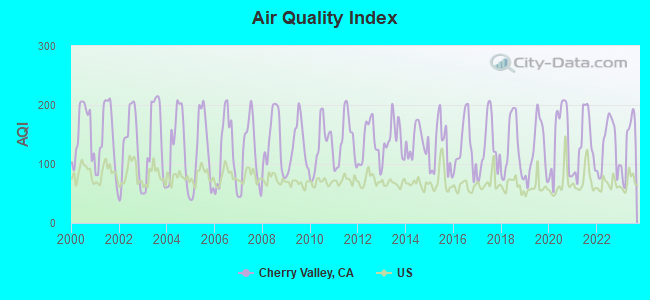
Air pollution - Air Quality Index (AQI)
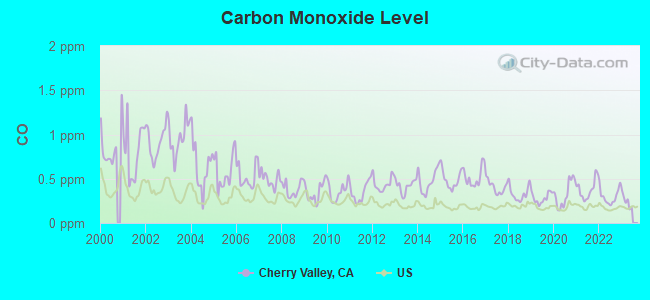
Air pollution - CO
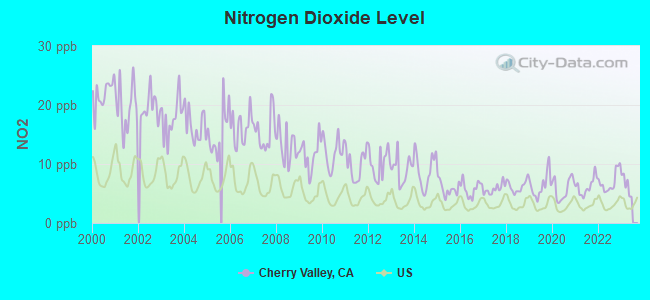
Air pollution - NO2
Air pollution - SO2
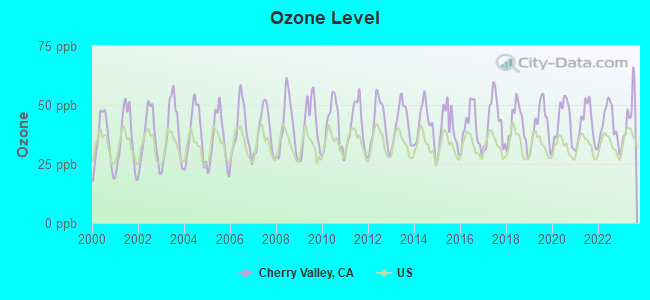
Air pollution - Ozone
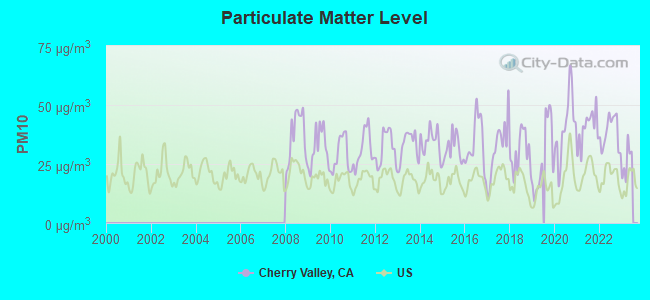
Air pollution - PM10
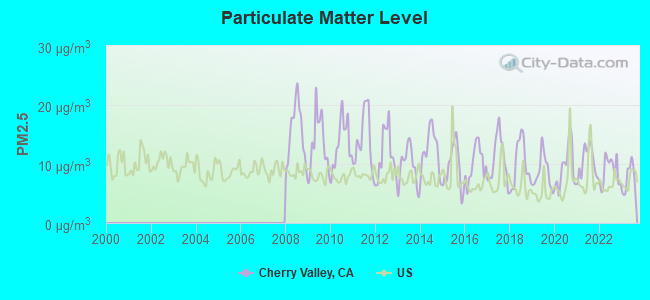
Air pollution - PM25
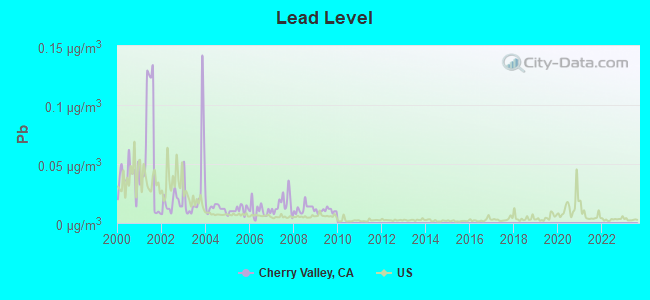
Air pollution - Pb
Crime - Murders per 100,000 population
Crime - Rapes per 100,000 population
Crime - Robberies per 100,000 population
Crime - Assaults per 100,000 population
Crime - Burglaries per 100,000 population
Crime - Thefts per 100,000 population
Crime - Auto thefts per 100,000 population
Crime - Arson per 100,000 population
Crime - City-data.com crime index
Crime - Violent crime index
Crime - Property crime index
Crime - Murders per 100,000 population (5 year average)
Crime - Rapes per 100,000 population (5 year average)
Crime - Robberies per 100,000 population (5 year average)
Crime - Assaults per 100,000 population (5 year average)
Crime - Burglaries per 100,000 population (5 year average)
Crime - Thefts per 100,000 population (5 year average)
Crime - Auto thefts per 100,000 population (5 year average)
Crime - Arson per 100,000 population (5 year average)
Crime - City-data.com crime index (5 year average)
Crime - Violent crime index (5 year average)
Crime - Property crime index (5 year average)
1996 Presidential Elections Results (%) - Democratic Party (Clinton)
1996 Presidential Elections Results (%) - Republican Party (Dole)
1996 Presidential Elections Results (%) - Other
2000 Presidential Elections Results (%) - Democratic Party (Gore)
2000 Presidential Elections Results (%) - Republican Party (Bush)
2000 Presidential Elections Results (%) - Other
2004 Presidential Elections Results (%) - Democratic Party (Kerry)
2004 Presidential Elections Results (%) - Republican Party (Bush)
2004 Presidential Elections Results (%) - Other
2008 Presidential Elections Results (%) - Democratic Party (Obama)
2008 Presidential Elections Results (%) - Republican Party (McCain)
2008 Presidential Elections Results (%) - Other
2012 Presidential Elections Results (%) - Democratic Party (Obama)
2012 Presidential Elections Results (%) - Republican Party (Romney)
2012 Presidential Elections Results (%) - Other
2016 Presidential Elections Results (%) - Democratic Party (Clinton)
2016 Presidential Elections Results (%) - Republican Party (Trump)
2016 Presidential Elections Results (%) - Other
2020 Presidential Elections Results (%) - Democratic Party (Biden)
2020 Presidential Elections Results (%) - Republican Party (Trump)
2020 Presidential Elections Results (%) - Other
Ancestries Reported - Arab (%)
Ancestries Reported - Czech (%)
Ancestries Reported - Danish (%)
Ancestries Reported - Dutch (%)
Ancestries Reported - English (%)
Ancestries Reported - French (%)
Ancestries Reported - French Canadian (%)
Ancestries Reported - German (%)
Ancestries Reported - Greek (%)
Ancestries Reported - Hungarian (%)
Ancestries Reported - Irish (%)
Ancestries Reported - Italian (%)
Ancestries Reported - Lithuanian (%)
Ancestries Reported - Norwegian (%)
Ancestries Reported - Polish (%)
Ancestries Reported - Portuguese (%)
Ancestries Reported - Russian (%)
Ancestries Reported - Scotch-Irish (%)
Ancestries Reported - Scottish (%)
Ancestries Reported - Slovak (%)
Ancestries Reported - Subsaharan African (%)
Ancestries Reported - Swedish (%)
Ancestries Reported - Swiss (%)
Ancestries Reported - Ukrainian (%)
Ancestries Reported - United States (%)
Ancestries Reported - Welsh (%)
Ancestries Reported - West Indian (%)
Ancestries Reported - Other (%)
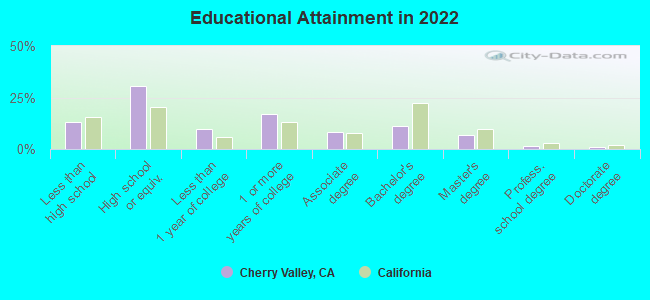
Educational Attainment - No schooling completed (%)
Educational Attainment - Less than high school (%)
Educational Attainment - High school or equivalent (%)
Educational Attainment - Less than 1 year of college (%)
Educational Attainment - 1 or more years of college (%)
Educational Attainment - Associate degree (%)
Educational Attainment - Bachelor's degree (%)
Educational Attainment - Master's degree (%)
Educational Attainment - Professional school degree (%)
Educational Attainment - Doctorate degree (%)
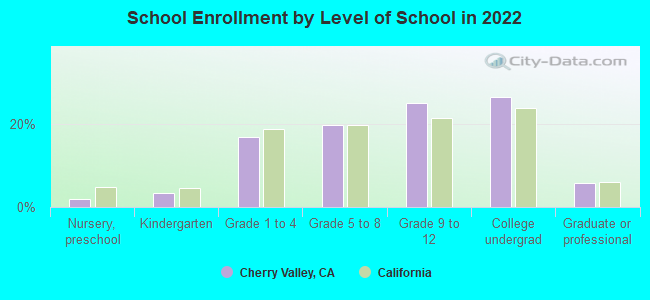
School Enrollment - Nursery, preschool (%)
School Enrollment - Kindergarten (%)
School Enrollment - Grade 1 to 4 (%)
School Enrollment - Grade 5 to 8 (%)
School Enrollment - Grade 9 to 12 (%)
School Enrollment - College undergrad (%)
School Enrollment - Graduate or professional (%)
School Enrollment - Not enrolled in school (%)
School enrollment - Public schools (%)
School enrollment - Private schools (%)
School enrollment - Not enrolled (%)
Median number of rooms in houses and condos
Median number of rooms in apartments
Housing units lacking complete plumbing facilities (%)
Housing units lacking complete kitchen facilities (%)
Density of houses
Urban houses (%)
Rural houses (%)
Households with people 60 years and over (%)
Households with people 65 years and over (%)
Households with people 75 years and over (%)
Households with one or more nonrelatives (%)
Households with no nonrelatives (%)
Population in households (%)
Family households (%)
Nonfamily households (%)
Population in families (%)
Family households with own children (%)
Median number of bedrooms in owner occupied houses
Mean number of bedrooms in owner occupied houses
Median number of bedrooms in renter occupied houses
Mean number of bedrooms in renter occupied houses
Median number of vehichles in owner occupied houses
Mean number of vehichles in owner occupied houses
Median number of vehichles in renter occupied houses
Mean number of vehichles in renter occupied houses
Mortgage status - with mortgage (%)
Mortgage status - with second mortgage (%)
Mortgage status - with home equity loan (%)
Mortgage status - with both second mortgage and home equity loan (%)
Mortgage status - without a mortgage (%)
Average family size
Average family size - White
Average family size - Black or African American
Average family size - Asian
Average family size - Hispanic or Latino
Average family size - American Indian and Alaska Native
Average family size - Multirace
Average family size - Other Race
Geographical mobility - Same house 1 year ago (%)
Geographical mobility - Moved within same county (%)
Geographical mobility - Moved from different county within same state (%)
Geographical mobility - Moved from different state (%)
Geographical mobility - Moved from abroad (%)
Place of birth - Born in state of residence (%)
Place of birth - Born in other state (%)
Place of birth - Native, outside of US (%)
Place of birth - Foreign born (%)
Housing units in structures - 1, detached (%)
Housing units in structures - 1, attached (%)
Housing units in structures - 2 (%)
Housing units in structures - 3 or 4 (%)
Housing units in structures - 5 to 9 (%)
Housing units in structures - 10 to 19 (%)
Housing units in structures - 20 to 49 (%)
Housing units in structures - 50 or more (%)
Housing units in structures - Mobile home (%)
Housing units in structures - Boat, RV, van, etc. (%)
House/condo owner moved in on average (years ago)
Renter moved in on average (years ago)
Year householder moved into unit - Moved in 1999 to March 2000 (%)
Year householder moved into unit - Moved in 1995 to 1998 (%)
Year householder moved into unit - Moved in 1990 to 1994 (%)
Year householder moved into unit - Moved in 1980 to 1989 (%)
Year householder moved into unit - Moved in 1970 to 1979 (%)
Year householder moved into unit - Moved in 1969 or earlier (%)
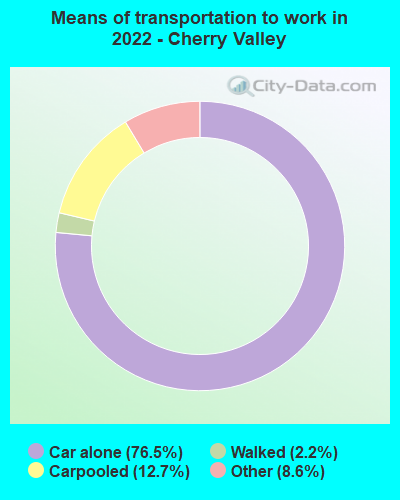
Means of transportation to work - Drove car alone (%)
Means of transportation to work - Carpooled (%)
Means of transportation to work - Public transportation (%)
Means of transportation to work - Bus or trolley bus (%)
Means of transportation to work - Streetcar or trolley car (%)
Means of transportation to work - Subway or elevated (%)
Means of transportation to work - Railroad (%)
Means of transportation to work - Ferryboat (%)
Means of transportation to work - Taxicab (%)
Means of transportation to work - Motorcycle (%)
Means of transportation to work - Bicycle (%)
Means of transportation to work - Walked (%)
Means of transportation to work - Other means (%)
Working at home (%)
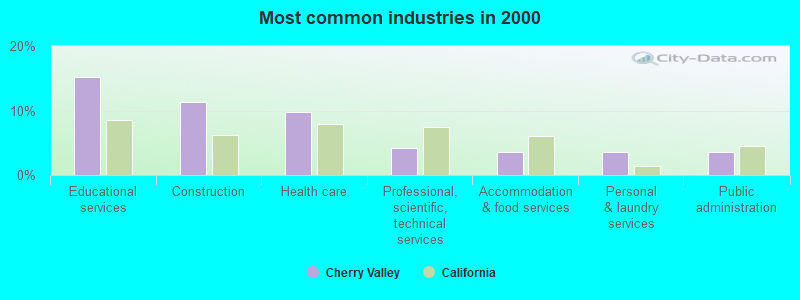
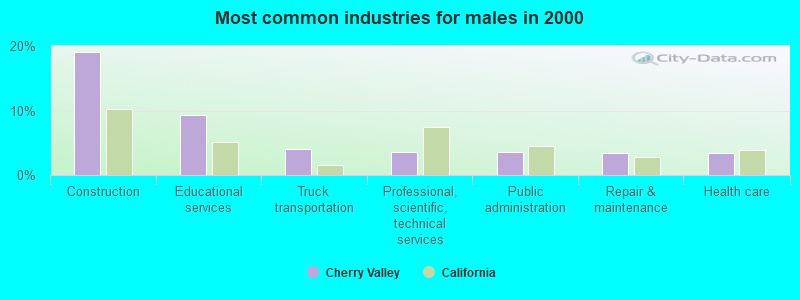
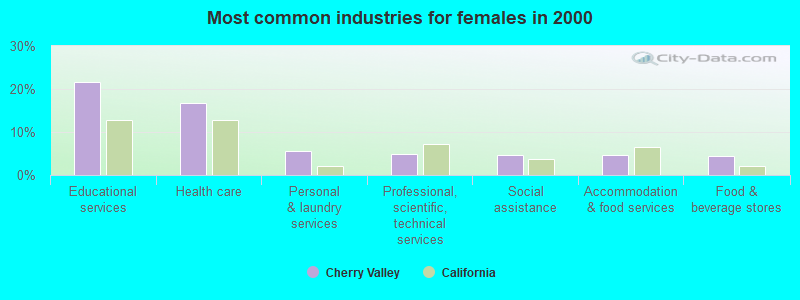
Industry diversity
Most Common Industries - Agriculture, forestry, fishing and hunting, and mining (%)
Most Common Industries - Agriculture, forestry, fishing and hunting (%)
Most Common Industries - Mining, quarrying, and oil and gas extraction (%)
Most Common Industries - Construction (%)
Most Common Industries - Manufacturing (%)
Most Common Industries - Wholesale trade (%)
Most Common Industries - Retail trade (%)
Most Common Industries - Transportation and warehousing, and utilities (%)
Most Common Industries - Transportation and warehousing (%)
Most Common Industries - Utilities (%)
Most Common Industries - Information (%)
Most Common Industries - Finance and insurance, and real estate and rental and leasing (%)
Most Common Industries - Finance and insurance (%)
Most Common Industries - Real estate and rental and leasing (%)
Most Common Industries - Professional, scientific, and management, and administrative and waste management services (%)
Most Common Industries - Professional, scientific, and technical services (%)
Most Common Industries - Management of companies and enterprises (%)
Most Common Industries - Administrative and support and waste management services (%)
Most Common Industries - Educational services, and health care and social assistance (%)
Most Common Industries - Educational services (%)
Most Common Industries - Health care and social assistance (%)
Most Common Industries - Arts, entertainment, and recreation, and accommodation and food services (%)
Most Common Industries - Arts, entertainment, and recreation (%)
Most Common Industries - Accommodation and food services (%)
Most Common Industries - Other services, except public administration (%)
Most Common Industries - Public administration (%)
Occupation diversity
Most Common Occupations - Management, business, science, and arts occupations (%)
Most Common Occupations - Management, business, and financial occupations (%)
Most Common Occupations - Management occupations (%)
Most Common Occupations - Business and financial operations occupations (%)
Most Common Occupations - Computer, engineering, and science occupations (%)
Most Common Occupations - Computer and mathematical occupations (%)
Most Common Occupations - Architecture and engineering occupations (%)
Most Common Occupations - Life, physical, and social science occupations (%)
Most Common Occupations - Education, legal, community service, arts, and media occupations (%)
Most Common Occupations - Community and social service occupations (%)
Most Common Occupations - Legal occupations (%)
Most Common Occupations - Education, training, and library occupations (%)
Most Common Occupations - Arts, design, entertainment, sports, and media occupations (%)
Most Common Occupations - Healthcare practitioners and technical occupations (%)
Most Common Occupations - Health diagnosing and treating practitioners and other technical occupations (%)
Most Common Occupations - Health technologists and technicians (%)
Most Common Occupations - Service occupations (%)
Most Common Occupations - Healthcare support occupations (%)
Most Common Occupations - Protective service occupations (%)
Most Common Occupations - Fire fighting and prevention, and other protective service workers including supervisors (%)
Most Common Occupations - Law enforcement workers including supervisors (%)
Most Common Occupations - Food preparation and serving related occupations (%)
Most Common Occupations - Building and grounds cleaning and maintenance occupations (%)
Most Common Occupations - Personal care and service occupations (%)
Most Common Occupations - Sales and office occupations (%)
Most Common Occupations - Sales and related occupations (%)
Most Common Occupations - Office and administrative support occupations (%)
Most Common Occupations - Natural resources, construction, and maintenance occupations (%)
Most Common Occupations - Farming, fishing, and forestry occupations (%)
Most Common Occupations - Construction and extraction occupations (%)
Most Common Occupations - Installation, maintenance, and repair occupations (%)
Most Common Occupations - Production, transportation, and material moving occupations (%)
Most Common Occupations - Production occupations (%)
Most Common Occupations - Transportation occupations (%)
Most Common Occupations - Material moving occupations (%)
People in Group quarters - Institutionalized population (%)
People in Group quarters - Correctional institutions (%)
People in Group quarters - Federal prisons and detention centers (%)
People in Group quarters - Halfway houses (%)
People in Group quarters - Local jails and other confinement facilities (including police lockups) (%)
People in Group quarters - Military disciplinary barracks (%)
People in Group quarters - State prisons (%)
People in Group quarters - Other types of correctional institutions (%)
People in Group quarters - Nursing homes (%)
People in Group quarters - Hospitals/wards, hospices, and schools for the handicapped (%)
People in Group quarters - Hospitals/wards and hospices for chronically ill (%)
People in Group quarters - Hospices or homes for chronically ill (%)
People in Group quarters - Military hospitals or wards for chronically ill (%)
People in Group quarters - Other hospitals or wards for chronically ill (%)
People in Group quarters - Hospitals or wards for drug/alcohol abuse (%)
People in Group quarters - Mental (Psychiatric) hospitals or wards (%)
People in Group quarters - Schools, hospitals, or wards for the mentally retarded (%)
People in Group quarters - Schools, hospitals, or wards for the physically handicapped (%)
People in Group quarters - Institutions for the deaf (%)
People in Group quarters - Institutions for the blind (%)
People in Group quarters - Orthopedic wards and institutions for the physically handicapped (%)
People in Group quarters - Wards in general hospitals for patients who have no usual home elsewhere (%)
People in Group quarters - Wards in military hospitals for patients who have no usual home elsewhere (%)
People in Group quarters - Juvenile institutions (%)
People in Group quarters - Long-term care (%)
People in Group quarters - Homes for abused, dependent, and neglected children (%)
People in Group quarters - Residential treatment centers for emotionally disturbed children (%)
People in Group quarters - Training schools for juvenile delinquents (%)
People in Group quarters - Short-term care, detention or diagnostic centers for delinquent children (%)
People in Group quarters - Type of juvenile institution unknown (%)
People in Group quarters - Noninstitutionalized population (%)
People in Group quarters - College dormitories (includes college quarters off campus) (%)
People in Group quarters - Military quarters (%)
People in Group quarters - On base (%)
People in Group quarters - Barracks, unaccompanied personnel housing (UPH), (Enlisted/Officer), ;and similar group living quarters for military personnel (%)
People in Group quarters - Transient quarters for temporary residents (%)
People in Group quarters - Military ships (%)
People in Group quarters - Group homes (%)
People in Group quarters - Homes or halfway houses for drug/alcohol abuse (%)
People in Group quarters - Homes for the mentally ill (%)
People in Group quarters - Homes for the mentally retarded (%)
People in Group quarters - Homes for the physically handicapped (%)
People in Group quarters - Other group homes (%)
People in Group quarters - Religious group quarters (%)
People in Group quarters - Dormitories (%)
People in Group quarters - Agriculture workers' dormitories on farms (%)
People in Group quarters - Job Corps and vocational training facilities (%)
People in Group quarters - Other workers' dormitories (%)
People in Group quarters - Crews of maritime vessels (%)
People in Group quarters - Other nonhousehold living situations (%)
People in Group quarters - Other noninstitutional group quarters (%)
Residents speaking English at home (%)
Residents speaking English at home - Born in the United States (%)
Residents speaking English at home - Native, born elsewhere (%)
Residents speaking English at home - Foreign born (%)
Residents speaking Spanish at home (%)
Residents speaking Spanish at home - Born in the United States (%)
Residents speaking Spanish at home - Native, born elsewhere (%)
Residents speaking Spanish at home - Foreign born (%)
Residents speaking other language at home (%)
Residents speaking other language at home - Born in the United States (%)
Residents speaking other language at home - Native, born elsewhere (%)
Residents speaking other language at home - Foreign born (%)
Class of Workers - Employee of private company (%)
Class of Workers - Self-employed in own incorporated business (%)
Class of Workers - Private not-for-profit wage and salary workers (%)
Class of Workers - Local government workers (%)
Class of Workers - State government workers (%)
Class of Workers - Federal government workers (%)
Class of Workers - Self-employed workers in own not incorporated business and Unpaid family workers (%)
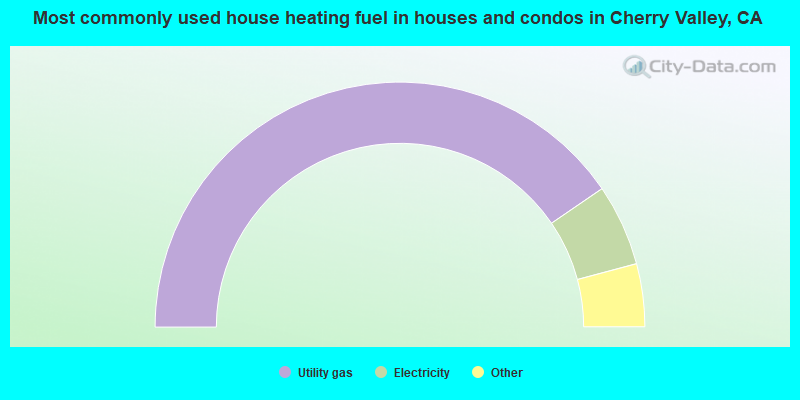
House heating fuel used in houses and condos - Utility gas (%)
House heating fuel used in houses and condos - Bottled, tank, or LP gas (%)
House heating fuel used in houses and condos - Electricity (%)
House heating fuel used in houses and condos - Fuel oil, kerosene, etc. (%)
House heating fuel used in houses and condos - Coal or coke (%)
House heating fuel used in houses and condos - Wood (%)
House heating fuel used in houses and condos - Solar energy (%)
House heating fuel used in houses and condos - Other fuel (%)
House heating fuel used in houses and condos - No fuel used (%)
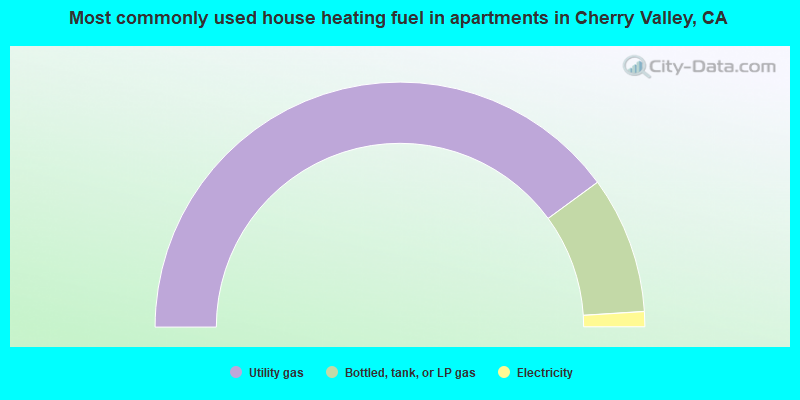
House heating fuel used in apartments - Utility gas (%)
House heating fuel used in apartments - Bottled, tank, or LP gas (%)
House heating fuel used in apartments - Electricity (%)
House heating fuel used in apartments - Fuel oil, kerosene, etc. (%)
House heating fuel used in apartments - Coal or coke (%)
House heating fuel used in apartments - Wood (%)
House heating fuel used in apartments - Solar energy (%)
House heating fuel used in apartments - Other fuel (%)
House heating fuel used in apartments - No fuel used (%)
Armed forces status - In Armed Forces (%)
Armed forces status - Civilian (%)
Armed forces status - Civilian - Veteran (%)
Armed forces status - Civilian - Nonveteran (%)
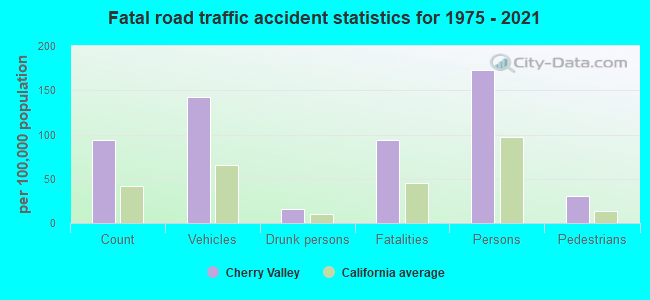
Fatal accidents locations in years 2005-2021
Fatal accidents locations in 2005
Fatal accidents locations in 2006
Fatal accidents locations in 2007
Fatal accidents locations in 2008
Fatal accidents locations in 2009
Fatal accidents locations in 2010
Fatal accidents locations in 2011
Fatal accidents locations in 2012
Fatal accidents locations in 2013
Fatal accidents locations in 2014
Fatal accidents locations in 2015
Fatal accidents locations in 2016
Fatal accidents locations in 2017
Fatal accidents locations in 2018
Fatal accidents locations in 2019
Fatal accidents locations in 2020
Fatal accidents locations in 2021
Alcohol use - People drinking some alcohol every month (%)
Alcohol use - People not drinking at all (%)
Alcohol use - Average days/month drinking alcohol
Alcohol use - Average drinks/week
Alcohol use - Average days/year people drink much
Audiometry - Average condition of hearing (%)
Audiometry - People that can hear a whisper from across a quiet room (%)
Audiometry - People that can hear normal voice from across a quiet room (%)
Audiometry - Ears ringing, roaring, buzzing (%)
Audiometry - Had a job exposure to loud noise (%)
Audiometry - Had off-work exposure to loud noise (%)
Blood Pressure & Cholesterol - Has high blood pressure (%)
Blood Pressure & Cholesterol - Checking blood pressure at home (%)
Blood Pressure & Cholesterol - Frequently checking blood cholesterol (%)
Blood Pressure & Cholesterol - Has high cholesterol level (%)
Consumer Behavior - Money monthly spent on food at supermarket/grocery store
Consumer Behavior - Money monthly spent on food at other stores
Consumer Behavior - Money monthly spent on eating out
Consumer Behavior - Money monthly spent on carryout/delivered foods
Consumer Behavior - Income spent on food at supermarket/grocery store (%)
Consumer Behavior - Income spent on food at other stores (%)
Consumer Behavior - Income spent on eating out (%)
Consumer Behavior - Income spent on carryout/delivered foods (%)
Current Health Status - General health condition (%)
Current Health Status - Blood donors (%)
Current Health Status - Has blood ever tested for HIV virus (%)
Current Health Status - Left-handed people (%)
Dermatology - People using sunscreen (%)
Diabetes - Diabetics (%)
Diabetes - Had a blood test for high blood sugar (%)
Diabetes - People taking insulin (%)
Diet Behavior & Nutrition - Diet health (%)
Diet Behavior & Nutrition - Milk product consumption (# of products/month)
Diet Behavior & Nutrition - Meals not home prepared (#/week)
Diet Behavior & Nutrition - Meals from fast food or pizza place (#/week)
Diet Behavior & Nutrition - Ready-to-eat foods (#/month)
Diet Behavior & Nutrition - Frozen meals/pizza (#/month)
Drug Use - People that ever used marijuana or hashish (%)
Drug Use - Ever used hard drugs (%)
Drug Use - Ever used any form of cocaine (%)
Drug Use - Ever used heroin (%)
Drug Use - Ever used methamphetamine (%)
Health Insurance - People covered by health insurance (%)
Kidney Conditions-Urology - Avg. # of times urinating at night
Medical Conditions - People with asthma (%)
Medical Conditions - People with anemia (%)
Medical Conditions - People with psoriasis (%)
Medical Conditions - People with overweight (%)
Medical Conditions - Elderly people having difficulties in thinking or remembering (%)
Medical Conditions - People who ever received blood transfusion (%)
Medical Conditions - People having trouble seeing even with glass/contacts (%)
Medical Conditions - People with arthritis (%)
Medical Conditions - People with gout (%)
Medical Conditions - People with congestive heart failure (%)
Medical Conditions - People with coronary heart disease (%)
Medical Conditions - People with angina pectoris (%)
Medical Conditions - People who ever had heart attack (%)
Medical Conditions - People who ever had stroke (%)
Medical Conditions - People with emphysema (%)
Medical Conditions - People with thyroid problem (%)
Medical Conditions - People with chronic bronchitis (%)
Medical Conditions - People with any liver condition (%)
Medical Conditions - People who ever had cancer or malignancy (%)
Mental Health - People who have little interest in doing things (%)
Mental Health - People feeling down, depressed, or hopeless (%)
Mental Health - People who have trouble sleeping or sleeping too much (%)
Mental Health - People feeling tired or having little energy (%)
Mental Health - People with poor appetite or overeating (%)
Mental Health - People feeling bad about themself (%)
Mental Health - People who have trouble concentrating on things (%)
Mental Health - People moving or speaking slowly or too fast (%)
Mental Health - People having thoughts they would be better off dead (%)
Oral Health - Average years since last visit a dentist
Oral Health - People embarrassed because of mouth (%)
Oral Health - People with gum disease (%)
Oral Health - General health of teeth and gums (%)
Oral Health - Average days a week using dental floss/device
Oral Health - Average days a week using mouthwash for dental problem
Oral Health - Average number of teeth
Pesticide Use - Households using pesticides to control insects (%)
Pesticide Use - Households using pesticides to kill weeds (%)
Physical Activity - People doing vigorous-intensity work activities (%)
Physical Activity - People doing moderate-intensity work activities (%)
Physical Activity - People walking or bicycling (%)
Physical Activity - People doing vigorous-intensity recreational activities (%)
Physical Activity - People doing moderate-intensity recreational activities (%)
Physical Activity - Average hours a day doing sedentary activities
Physical Activity - Average hours a day watching TV or videos
Physical Activity - Average hours a day using computer
Physical Functioning - People having limitations keeping them from working (%)
Physical Functioning - People limited in amount of work they can do (%)
Physical Functioning - People that need special equipment to walk (%)
Physical Functioning - People experiencing confusion/memory problems (%)
Physical Functioning - People requiring special healthcare equipment (%)
Prescription Medications - Average number of prescription medicines taking
Preventive Aspirin Use - Adults 40+ taking low-dose aspirin (%)
Reproductive Health - Vaginal deliveries (%)
Reproductive Health - Cesarean deliveries (%)
Reproductive Health - Deliveries resulted in a live birth (%)
Reproductive Health - Pregnancies resulted in a delivery (%)
Reproductive Health - Women breastfeeding newborns (%)
Reproductive Health - Women that had a hysterectomy (%)
Reproductive Health - Women that had both ovaries removed (%)
Reproductive Health - Women that have ever taken birth control pills (%)
Reproductive Health - Women taking birth control pills (%)
Reproductive Health - Women that have ever used Depo-Provera or injectables (%)
Reproductive Health - Women that have ever used female hormones (%)
Sexual Behavior - People 18+ that ever had sex (vaginal, anal, or oral) (%)
Sexual Behavior - Males 18+ that ever had vaginal sex with a woman (%)
Sexual Behavior - Males 18+ that ever performed oral sex on a woman (%)
Sexual Behavior - Males 18+ that ever had anal sex with a woman (%)
Sexual Behavior - Males 18+ that ever had any sex with a man (%)
Sexual Behavior - Females 18+ that ever had vaginal sex with a man (%)
Sexual Behavior - Females 18+ that ever performed oral sex on a man (%)
Sexual Behavior - Females 18+ that ever had anal sex with a man (%)
Sexual Behavior - Females 18+ that ever had any kind of sex with a woman (%)
Sexual Behavior - Average age people first had sex
Sexual Behavior - Average number of female sex partners in lifetime (males 18+)
Sexual Behavior - Average number of female vaginal sex partners in lifetime (males 18+)
Sexual Behavior - Average age people first performed oral sex on a woman (18+)
Sexual Behavior - Average number of woman performed oral sex on in lifetime (18+)
Sexual Behavior - Average number of male sex partners in lifetime (males 18+)
Sexual Behavior - Average number of male anal sex partners in lifetime (males 18+)
Sexual Behavior - Average age people first performed oral sex on a man (18+)
Sexual Behavior - Average number of male oral sex partners in lifetime (18+)
Sexual Behavior - People using protection when performing oral sex (%)
Sexual Behavior - Average number of times people have vaginal or anal sex a year
Sexual Behavior - People having sex without condom (%)
Sexual Behavior - Average number of male sex partners in lifetime (females 18+)
Sexual Behavior - Average number of male vaginal sex partners in lifetime (females 18+)
Sexual Behavior - Average number of female sex partners in lifetime (females 18+)
Sexual Behavior - Circumcised males 18+ (%)
Sleep Disorders - Average hours sleeping at night
Sleep Disorders - People that has trouble sleeping (%)
Smoking-Cigarette Use - People smoking cigarettes (%)
Taste & Smell - People 40+ having problems with smell (%)
Taste & Smell - People 40+ having problems with taste (%)
Taste & Smell - People 40+ that ever had wisdom teeth removed (%)
Taste & Smell - People 40+ that ever had tonsils teeth removed (%)
Taste & Smell - People 40+ that ever had a loss of consciousness because of a head injury (%)
Taste & Smell - People 40+ that ever had a broken nose or other serious injury to face or skull (%)
Taste & Smell - People 40+ that ever had two or more sinus infections (%)
Weight - Average height (inches)
Weight - Average weight (pounds)
Weight - Average BMI
Weight - People that are obese (%)
Weight - People that ever were obese (%)
Weight - People trying to lose weight (%)
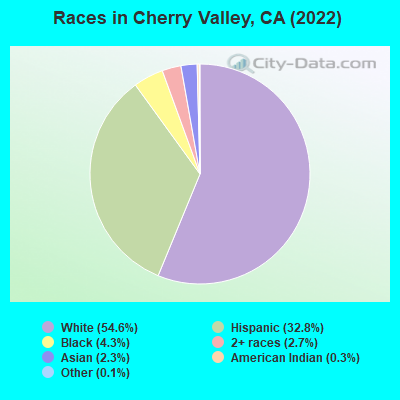
4,252 54.6% White alone 2,555 32.8% Hispanic 333 4.3% Black alone 214 2.7% Two or more races 181 2.3% Asian alone 22 0.3% American Indian alone 9 0.1% Other race alone
Latest news from Cherry Valley, CA collected exclusively by city-data.com from local newspapers, TV, and radio stations
Ancestries: American (8.5%), German (7.6%), English (6.3%), Irish (6.2%), Italian (2.3%), Norwegian (1.9%).
Current Local Time:
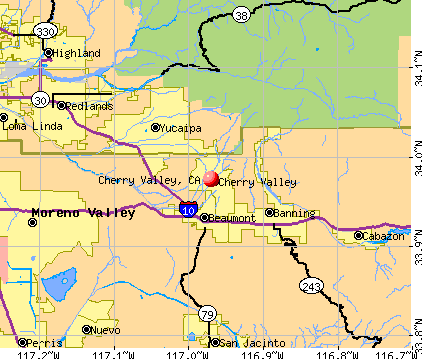
Land area: 8.24 square miles.
Population density: 772 people per square mile (low).
963 residents are foreign born (5.9% Latin America , 2.5% Asia , 2.1% Europe ).
This place:
12.4%California:
26.5%
Median real estate property taxes paid for housing units with mortgages in 2022: $2,611 (0.5%)Median real estate property taxes paid for housing units with no mortgage in 2022: $2,245 (0.7%)
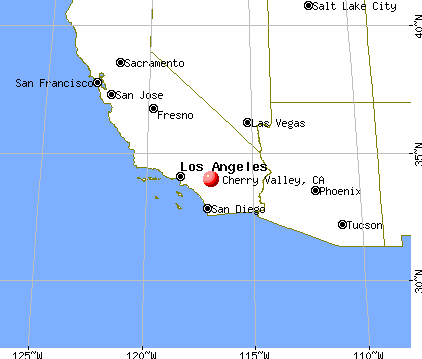
Nearest city with pop. 50,000+: San Gorgonio Pass, CA
Nearest city with pop. 200,000+: Riverside, CA
Nearest city with pop. 1,000,000+: Los Angeles, CA
Nearest cities:
Latitude: 33.97 N, Longitude: 116.97 W
Area code commonly used in this area: 909
Unemployment in December 2023:
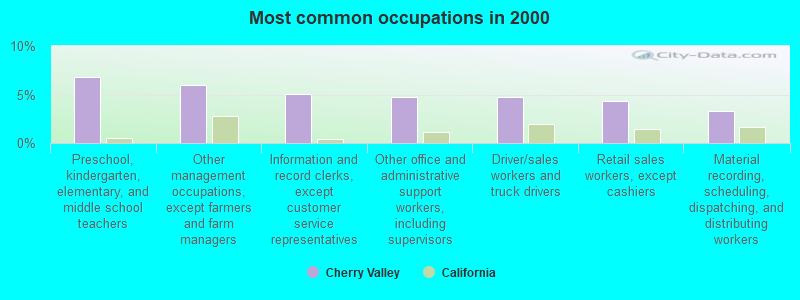
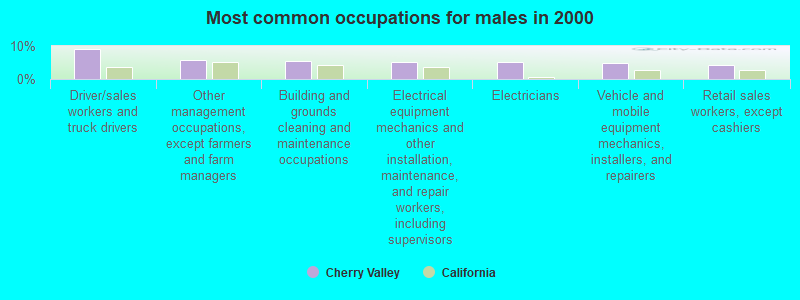
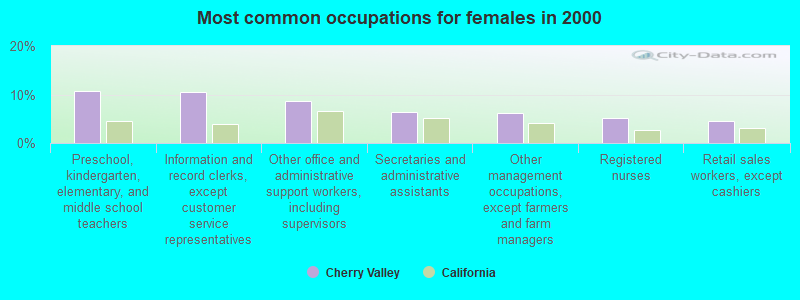
Most common occupations in Cherry Valley, CA (%)
Both Males Females
Preschool, kindergarten, elementary, and middle school teachers (6.8%)
Other management occupations, except farmers and farm managers (6.0%)
Information and record clerks, except customer service representatives (5.0%)
Other office and administrative support workers, including supervisors (4.8%)
Driver/sales workers and truck drivers (4.8%)
Retail sales workers, except cashiers (4.4%)
Material recording, scheduling, dispatching, and distributing workers (3.3%)
Driver/sales workers and truck drivers (9.2%)
Other management occupations, except farmers and farm managers (5.7%)
Building and grounds cleaning and maintenance occupations (5.5%)
Electrical equipment mechanics and other installation, maintenance, and repair workers, including supervisors (5.3%)
Electricians (5.1%)
Vehicle and mobile equipment mechanics, installers, and repairers (4.8%)
Retail sales workers, except cashiers (4.2%)
Preschool, kindergarten, elementary, and middle school teachers (10.8%)
Information and record clerks, except customer service representatives (10.5%)
Other office and administrative support workers, including supervisors (8.6%)
Secretaries and administrative assistants (6.5%)
Other management occupations, except farmers and farm managers (6.3%)
Registered nurses (5.1%)
Retail sales workers, except cashiers (4.5%)
Earthquake activity:
Cherry Valley-area historical earthquake activity is significantly above California state average. It is 7258% greater than the overall U.S. average. On 6/28/1992 at 11:57:34, a magnitude 7.6 (6.2 MB, 7.6 MS, 7.3 MW, Depth: 0.7 mi, Class: Major, Intensity: VIII - XII) earthquake occurred 29.0 miles away from the city center, causing 3 deaths ( 1 shaking deaths, 2 other deaths) and 400 injuries, causing $100,000,000 total damage and $40,000,000 insured lossesOn 10/16/1999 at 09:46:44, a magnitude 7.4 (6.3 MB, 7.4 MS, 7.2 MW, 7.3 ML) earthquake occurred 48.3 miles away from Cherry Valley center On 7/21/1952 at 11:52:14, a magnitude 7.7 (7.7 UK) earthquake occurred 135.7 miles away from Cherry Valley center, causing $50,000,000 total damage On 5/19/1940 at 04:36:40, a magnitude 7.2 (7.2 UK) earthquake occurred 90.0 miles away from Cherry Valley center, causing $33,000,000 total damage On 6/28/1992 at 15:05:30, a magnitude 6.9 (6.3 MB, 6.7 MS, 6.5 MW, 6.9 ME, Depth: 3.1 mi, Class: Strong, Intensity: VII - IX) earthquake occurred 23.4 miles away from Cherry Valley center On 4/21/1918 at 22:32:30, a magnitude 6.8 (6.8 UK) earthquake occurred 29.2 miles away from Cherry Valley center Magnitude types: body-wave magnitude (MB), energy magnitude (ME), local magnitude (ML), surface-wave magnitude (MS), moment magnitude (MW) Natural disasters: The number of natural disasters in Riverside County (46) is a lot greater than the US average (15).Major Disasters (Presidential) Declared: 27Emergencies Declared: 1Fires: 22, Floods: 20, Storms: 8, Winter Storms: 8, Landslides: 6, Mudslides: 5, Heavy Rains: 2, Earthquake: 1, Flash Flood: 1, Freeze: 1, Hurricane: 1, Tornado: 1, Tropical Storm: 1, Other: 1 (Note: some incidents may be assigned to more than one category). Hospitals and medical centers in Cherry Valley: MIRAVILLA CARE CENTER (9246 AVENIDA MIRAVILLA)
SUNSET HAVEN CONVALESCENT HOSPITAL (9246 AVENIDA MIRAVILLA)
Other hospitals and medical centers near Cherry Valley: BEAUMONT CARE CENTER (Nursing Home, about 2 miles away; BEAUMONT, CA)
INDEPENDENT OPTIONS, INC/DONNA (Hospital, about 3 miles away; BEAUMONT, CA)
INDEPENDENT OPTIONS, INC /ORANGE HOUSE (Hospital, about 3 miles away; BEAUMONT, CA)
SAN GORGONIO MEMORIAL HOSPITAL (about 4 miles away; BANNING, CA)
RAI-EAST SIXTH STREET-BEAUMONT (Dialysis Facility, about 4 miles away; BEAUMONT, CA)
CHERRY VALLEY HEALTHCARE (Nursing Home, about 4 miles away; BANNING, CA)
BANNING DIALYSIS (Dialysis Facility, about 4 miles away; BANNING, CA)
Amtrak stations near Cherry Valley: 4 miles: BEAUMONT (550 BEAUMONT AVE.) - Bus Station Services: fully wheelchair accessible, public restrooms, full-service food facilities, free short-term parking.
16 miles: HEMET (COCOS REST., 3246 FLORIDA AVE.) - Bus Station 19 miles: MORENO VALLEY (ARCO MINI MART, 2624 E. ALESSANDRO BLVD.) - Bus Station Services: public payphones.
Colleges/universities with over 2000 students nearest to Cherry Valley:
Crafton Hills College (about 9 miles; Yucaipa, CA ; Full-time enrollment: 3,222)
Mt San Jacinto Community College District (about 12 miles; San Jacinto, CA ; FT enrollment: 8,426)
University of Redlands (about 13 miles; Redlands, CA ; FT enrollment: 4,854)
Moreno Valley College (about 15 miles; Moreno Valley, CA ; FT enrollment: 4,650)
Loma Linda University (about 18 miles; Loma Linda, CA ; FT enrollment: 2,839)
The Art Institute of California-Argosy University Inland Empire (about 19 miles; San Bernardino, CA ; FT enrollment: 2,238)
University of California-Riverside (about 21 miles; Riverside, CA ; FT enrollment: 20,647)
Private school in Cherry Valley: CHERRY VALLEY BRETHREN SCHOOLS Students: 102, Location: 39205 VINELAND ST, Grades: PK-KG)
Riverside County has a predicted average indoor radon screening level between 2 and 4 pCi/L (pico curies per liter) - Moderate Potential Drinking water stations with addresses in Cherry Valley and their reported violations in the past:
CHERRY VALLEY WATER COMPANY (Population served: 200, Groundwater):
Past monitoring violations:
Initial Tap Sampling for Pb and Cu - In JUL-01-1993, Contaminant: Lead and Copper Rule. Follow-up actions: Fed Compliance achieved (SEP-30-2005)
Average household size: This place:
2.4 peopleCalifornia:
2.9 people
Percentage of family households: This place:
65.4%Whole state:
68.7%
Percentage of households with unmarried partners: This place:
5.0%Whole state:
7.2%
Likely homosexual households (counted as self-reported same-sex unmarried-partner households)
Lesbian couples: 0.4% of all households Gay men: 0.2% of all households
People in group quarters in Cherry Valley in 2010:
74 people in emergency and transitional shelters (with sleeping facilities) for people experiencing homelessness
56 people in nursing facilities/skilled-nursing facilities
15 people in workers' group living quarters and job corps centers
9 people in group homes intended for adults
5 people in residential treatment centers for juveniles (non-correctional)
People in group quarters in Cherry Valley in 2000:
50 people in nursing homes
13 people in homes for the mentally retarded
8 people in other group homes
7 people in other noninstitutional group quarters
For population 15 years and over in Cherry Valley:
Never married: 29.1%Now married: 48.9%Separated: 1.2%Widowed: 9.4%Divorced: 11.4% For population 25 years and over in Cherry Valley:
High school or higher: 87.1%Bachelor's degree or higher: 20.2%Graduate or professional degree: 9.4%Unemployed: 6.2%Mean travel time to work (commute): 32.6 minutes
Education Gini index (Inequality in education) Here:
12.3California average:
15.5
Religion statistics for Cherry Valley, CA (based on Riverside County data)
Religion Adherents Congregations Catholic 602,765 51 Evangelical Protestant 240,306 741 Other 77,581 194 Mainline Protestant 29,535 103 Black Protestant 19,170 40 Orthodox 3,647 11 None 1,216,637 -
Source: Clifford Grammich, Kirk Hadaway, Richard Houseal, Dale E.Jones, Alexei Krindatch, Richie Stanley and Richard H.Taylor. 2012. 2010 U.S.Religion Census: Religious Congregations & Membership Study. Association of Statisticians of American Religious Bodies. Jones, Dale E., et al. 2002. Congregations and Membership in the United States 2000. Nashville, TN: Glenmary Research Center. Graphs represent county-level data
Food Environment Statistics: Number of grocery stores : 330Here :
1.60 / 10,000 pop.California :
2.14 / 10,000 pop.
Number of supercenters and club stores : 11Riverside County :
0.05 / 10,000 pop.California :
0.04 / 10,000 pop.
Number of convenience stores (no gas) : 91This county :
0.44 / 10,000 pop.California :
0.62 / 10,000 pop.
Number of convenience stores (with gas) : 311Riverside County :
1.51 / 10,000 pop.California :
1.49 / 10,000 pop.
Number of full-service restaurants : 1,125This county :
5.45 / 10,000 pop.State :
7.42 / 10,000 pop.
Adult diabetes rate : Riverside County :
7.7%State :
7.3%
Adult obesity rate : This county :
24.5%State :
21.3%
Low-income preschool obesity rate : This county :
15.2%California :
17.9%
Health and Nutrition: Healthy diet rate : Here:
51.8%California:
49.4%
Average overall health of teeth and gums : This city:
47.9%State:
48.0%
People feeling badly about themselves : Cherry Valley:
19.6%California:
20.2%
People not drinking alcohol at all : Cherry Valley:
11.9%California:
11.2%
Average hours sleeping at night : This city:
6.9California:
6.8
Overweight people : Cherry Valley:
36.7%California:
31.5%
General health condition : Here:
55.1%California:
56.4%
Average condition of hearing : Cherry Valley:
74.8%California:
80.9%
More about Health and Nutrition of Cherry Valley, CA Residents
7.19% of this county's 2021 resident taxpayers lived in other counties in 2020 ($71,521 average adjusted gross income )
Here:
7.19%California average:
5.19%
0.03% of residents moved from foreign countries ($210 average AGI )Riverside County:
0.03%California average:
0.03%
Top counties from which taxpayers relocated into this county between 2020 and 2021:
6.28% of this county's 2020 resident taxpayers moved to other counties in 2021 ($64,593 average adjusted gross income )
Here:
6.28%California average:
6.14%
0.02% of residents moved to foreign countries ($200 average AGI )Riverside County:
0.02%California average:
0.02%
Top counties to which taxpayers relocated from this county between 2020 and 2021: Businesses in Cherry Valley, CA
Strongest AM radio stations in Cherry Valley:
KPLS (830 AM; 50 kW; ORANGE, CA; Owner: CRN LICENSES, LLC)
KMET (1490 AM; 1 kW; BANNING, CA; Owner: SUNSET BROADCASTING, INC.)
KHPY (1670 AM; 10 kW; MORENO VALLEY, CA; Owner: DELBERT L. VAN VOORHIS)
KLAC (570 AM; 50 kW; LOS ANGELES, CA; Owner: AMFM RADIO LICENSES, L.L.C.)
KFI (640 AM; 50 kW; LOS ANGELES, CA; Owner: CAPSTAR TX LIMITED PARTNERSHIP)
KCAL (1410 AM; 5 kW; REDLANDS, CA; Owner: LAZER BROADCASTING CORPORATION)
KTNQ (1020 AM; 50 kW; LOS ANGELES, CA; Owner: KTNQ-AM LICENSE CORP.)
KXTA (1150 AM; 50 kW; LOS ANGELES, CA; Owner: CITICASTERS LICENSES, L.P.)
KDIS (1110 AM; 50 kW; PASADENA, CA; Owner: ABC,INC.)
KKDD (1290 AM; 5 kW; SAN BERNARDINO, CA; Owner: AMFM RADIO LICENSES, L.L.C.)
KFMB (760 AM; 50 kW; SAN DIEGO, CA; Owner: MIDWEST TELEVISION, INC.)
KFWB (980 AM; 50 kW; LOS ANGELES, CA; Owner: INFINITY BROADCASTING OPERATIONS, INC.)
KNWQ (1140 AM; 10 kW; PALM SPRINGS, CA; Owner: MCC RADIO, LLC)
Strongest FM radio stations in Cherry Valley:
KLRD (90.1 FM; YUCAIPA, CA; Owner: EDUCATIONAL MEDIA FOUNDATION)
KAEH (100.9 FM; BEAUMONT, CA; Owner: MOON BROADCASTING RIVERSIDE, LLC)
K201AR (88.1 FM; BANNING, CA; Owner: KSGN, INC.)
K232CX (94.3 FM; DESERT HOT SPRINGS, CA; Owner: MCC RADIO, LLC)
KUOR-FM (89.1 FM; REDLANDS, CA; Owner: UNIVERSITY OF REDLANDS)
KWRP (96.1 FM; SAN JACINTO, CA; Owner: MAGIC BROADCASTING, INC.)
KPLM-FM2 (106.1 FM; SAN JACINTO, CA; Owner: RM BROADCASTING L.L.C.)
KCXX (103.9 FM; LAKE ARROWHEAD, CA; Owner: ALL-PRO BROADCASTING, INC.)
KATY-FM (101.3 FM; IDYLLWILD, CA; Owner: ALL PRO BROADCASTING, INC.)
KOLA (99.9 FM; SAN BERNARDINO, CA; Owner: INLAND EMPIRE BROADCASTING CORP.)
KVCR (91.9 FM; SAN BERNARDINO, CA; Owner: SAN BERNARDINO COMMUNITY COLLEGE DISTRICT)
KUCR (88.3 FM; RIVERSIDE, CA; Owner: THE REGENTS OF THE UNIV. OF CA)
KGGI (99.1 FM; RIVERSIDE, CA; Owner: AMFM RADIO LICENSES, L.L.C.)
KLYY (97.5 FM; RIVERSIDE, CA; Owner: ENTRAVISION HOLDINGS, LLC)
K201CD (88.1 FM; VICTORVILLE, CA; Owner: SAN BERNARDINO COMMNTY COLLEGE DIST.)
KXSB (101.7 FM; BIG BEAR LAKE, CA; Owner: LAZER BROADCASTING CORPORATION)
KRTM (88.9 FM; TEMECULA, CA; Owner: PENFOLD COMMUNICATIONS, INC.)
K295AI (106.9 FM; MUSCOY, CA; Owner: ASSOCIATION FOR COMMUNITY EDUCATION, INC.)
KWVE (107.9 FM; SAN CLEMENTE, CA; Owner: CALVARY CHAPEL OF COSTA MESA)
KXRS (105.7 FM; HEMET, CA; Owner: LAZER BROADCASTING CORPORATION)
TV broadcast stations around Cherry Valley:
KTRO-LP (Channel 50; LANCASTER, CA; Owner: ROBERT D. ADELMAN)
KHIZ (Channel 64; BARSTOW, CA; Owner: SUNBELT TELEVISION, INC.)
KESQ-TV (Channel 42; PALM SPRINGS, CA; Owner: GULF-CALIFORNIA BROADCAST COMPANY)
KVCR-TV (Channel 24; SAN BERNARDINO, CA; Owner: SAN BERNARDINO COMMUNITY COLLEGE DISTRICT)
Cherry Valley fatal accident statistics for 1975 - 2021
Cherry Valley fatal accident list:
Apr 3, 2021 02:55 PM, Dutton St, Jonathan Ave, Lat: 33.974256, Lon: -116.959539, Vehicles: 2, Persons: 3, Fatalities: 1Lat: 33.969681, Lon: -116.977239, Vehicles: 1, Persons: 1, Pedestrians: 1, Fatalities: 1Lat: 34.001556, Lon: -116.962694, Vehicles: 1, Persons: 1, Fatalities: 1, Drunk persons involved: 1Lat: 33.959289, Lon: -116.946931, Vehicles: 1, Persons: 2, Pedestrians: 1, Fatalities: 1Lat: 33.975961, Lon: -116.973444, Vehicles: 2, Persons: 2, Fatalities: 1Lat: 33.968728, Lon: -116.973011, Vehicles: 2, Persons: 2, Fatalities: 1
National Bridge Inventory (NBI) Statistics 3 Number of bridges13ft / 4.1m Total length9,759 Total average daily traffic96 Total average daily truck traffic14,458 Total future (year 2038) average daily traffic
FCC Registered Antenna Towers: 5
DONALD G McCOY, 2.25 Km N Of Cherry Valley, Riverside Co., Ca (Lat: 33.993361 Lon: -116.977806), Type: 122.8, Overall height: 121.9 m, Registrant: Bromo Communications, Inc., Gil@bromocom.Com, , (191)747 Atlan-ta, Phone: (404) 266-2257 Richard Byrne, 38989 Cherry Valley Boulevard-1 (Lat: 33.967361 Lon: -116.981694), Type: 24.0, Overall height: 20.8 m, Registrant: Towerco Assets LLC, Afry@towerco.Com, , Cary, Phone: (919) 653-5710 Richard Byrne, 38989 Cherry Valley Boulevard-1 (Lat: 33.967361 Lon: -116.981694), Type: 24.0, Overall height: 20.8 m, Registrant: Towerco Assets LLC, Afry@towerco.Com, , Cary, Phone: (919) 653-5710 Edward G Roach, 38989 Cherry Valley Boulevard-1 (Lat: 33.967361 Lon: -116.981694), Type: 24.0, Structure height: 06065 m, Overall height: 20.8 m, Registrant: Sba 2012 Tc Assets, LLC, Eroach@sbasite.Com, , Boca -Raton, Phone: (561) 995-7670 Edward G Roach, 38989 Cherry Valley Boulevard-1 (Lat: 33.967361 Lon: -116.981694), Type: 24.0, Structure height: 06065 m, Overall height: 20.8 m, Registrant: Sba 2012 Tc Assets, LLC, Eroach@sbasite.Com, , Boca -Raton, Phone: (561) 995-7670 FCC Registered Broadcast Land Mobile Towers: 2
CHERRY VALLEY, 10055 Avenida Miravilla (Lat: 33.975306 Lon: -116.974111), Type: Pipe, Structure height: 7.6 m, Overall height: 10.7 m, Call Sign: KVR82, Assigned Frequencies: 159.285 MHz, 159.360 MHz, Grant Date: 01/20/2023, Expiration Date: 04/19/2033, Registrant: State Of California, 601 Sequoia Pacific Blvd, Sacramento, CA 95811-0231, Phone: (916) 894-5102, Fax: (916) 894-5392, Email:
Lat: 33.969000 Lon: -116.976889, Call Sign: WRUU962, Assigned Frequencies: 460.550 MHz, 465.550 MHz, Grant Date: 10/06/2022, Expiration Date: 10/06/2032, Certifier: Nancy Law, Registrant: Bearcom, Dallas, TX 75355, Phone: (800) 458-9887, Email:
FCC Registered Microwave Towers: 2
IE84267A, Brookside Ave (Lat: 33.961694 Lon: -116.998972), Type: Ltower, Structure height: 22.9 m, Call Sign: WRUA369, Assigned Frequencies: 21825.0 MHz, 21875.0 MHz, 21825.0 MHz, 21875.0 MHz, 21825.0 MHz, 21875.0 MHz, 21825.0 MHz, 21875.0 MHz, 21825.0 MHz, 21875.0 MHz... (+12 more), Grant Date: 08/04/2022, Expiration Date: 08/04/2032, Cancellation Date: 01/31/2024, Certifier: Jenny Knopf, Registrant: T-Mobile Usa, Inc., 12920 Se 38th Street, Bellevue, WA 98006, Phone: (425) 383-8401, Email:
IE04267A, 38989 Cherry Valley Blvd (Lat: 33.967611 Lon: -116.981694), Type: Mtower, Structure height: 25.3 m, Call Sign: WRUA392, Assigned Frequencies: 23025.0 MHz, 23075.0 MHz, 23025.0 MHz, 23075.0 MHz, 23025.0 MHz, 23075.0 MHz, 23025.0 MHz, 23075.0 MHz, 23025.0 MHz, 23075.0 MHz... (+12 more), Grant Date: 08/04/2022, Expiration Date: 08/04/2032, Cancellation Date: 02/01/2024, Certifier: Jenny Knopf, Registrant: T-Mobile Usa, Inc., 12920 Se 38th Street, Bellevue, WA 98006, Phone: (425) 383-8401, Email:
FCC Registered Amateur Radio Licenses: 76 (
See the full list of FCC Registered Amateur Radio Licenses in Cherry Valley )
FAA Registered Aircraft: 13 (
See the full list of FAA Registered Aircraft in Cherry Valley )
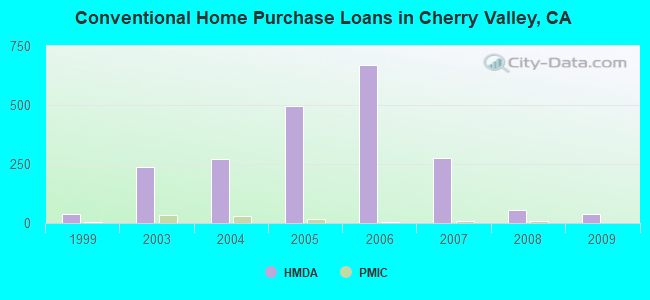
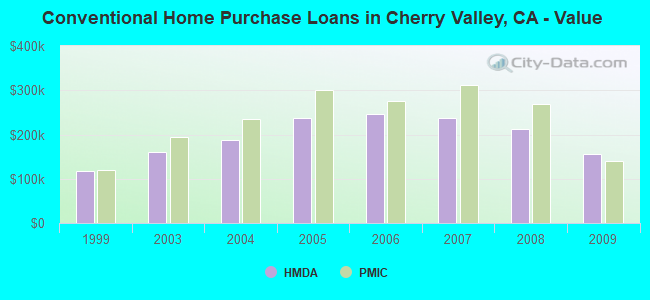
Home Mortgage Disclosure Act Aggregated Statistics For Year 2009(Based on 3 partial tracts) A) FHA, FSA/RHS & VA B) Conventional C) Refinancings D) Home Improvement Loans F) Non-occupant Loans on G) Loans On Manufactured Number Average Value Number Average Value Number Average Value Number Average Value Number Average Value Number Average Value
LOANS ORIGINATED 82 $203,223 38 $157,016 94 $204,259 3 $174,963 12 $139,472 7 $122,970 APPLICATIONS APPROVED, NOT ACCEPTED 5 $240,286 5 $173,742 14 $213,004 1 $6,910 3 $177,467 0 $0 APPLICATIONS DENIED 12 $220,398 9 $165,784 41 $215,700 4 $86,100 2 $239,285 4 $64,995 APPLICATIONS WITHDRAWN 13 $213,078 8 $137,200 30 $211,499 1 $215,790 4 $139,722 0 $0 FILES CLOSED FOR INCOMPLETENESS 2 $214,585 0 $0 6 $252,570 1 $62,030 2 $210,340 1 $88,490
Aggregated Statistics For Year 2008(Based on 3 partial tracts) A) FHA, FSA/RHS & VA B) Conventional C) Refinancings D) Home Improvement Loans F) Non-occupant Loans on G) Loans On Manufactured Number Average Value Number Average Value Number Average Value Number Average Value Number Average Value Number Average Value
LOANS ORIGINATED 73 $249,528 57 $212,218 66 $227,797 8 $111,761 14 $184,132 5 $109,076 APPLICATIONS APPROVED, NOT ACCEPTED 7 $249,437 15 $214,303 19 $246,628 0 $0 4 $213,358 5 $83,912 APPLICATIONS DENIED 13 $241,768 20 $215,026 83 $258,375 14 $114,057 10 $247,468 9 $76,571 APPLICATIONS WITHDRAWN 7 $260,991 11 $201,375 27 $234,079 4 $177,490 5 $172,322 0 $0 FILES CLOSED FOR INCOMPLETENESS 0 $0 3 $252,447 5 $223,744 1 $78,120 1 $340,680 0 $0
Aggregated Statistics For Year 2007(Based on 3 partial tracts) A) FHA, FSA/RHS & VA B) Conventional C) Refinancings D) Home Improvement Loans F) Non-occupant Loans on G) Loans On Manufactured Number Average Value Number Average Value Number Average Value Number Average Value Number Average Value Number Average Value
LOANS ORIGINATED 21 $299,194 274 $237,916 213 $261,926 43 $130,236 36 $238,649 11 $153,616 APPLICATIONS APPROVED, NOT ACCEPTED 1 $408,480 63 $237,479 68 $273,567 12 $113,149 7 $270,977 5 $98,922 APPLICATIONS DENIED 9 $300,630 100 $276,330 189 $296,264 41 $144,737 17 $286,244 13 $112,086 APPLICATIONS WITHDRAWN 2 $303,715 82 $219,731 86 $298,189 9 $223,478 9 $276,827 2 $93,855 FILES CLOSED FOR INCOMPLETENESS 0 $0 12 $252,095 22 $304,636 2 $158,915 5 $259,220 0 $0
Aggregated Statistics For Year 2006(Based on 3 partial tracts) A) FHA, FSA/RHS & VA B) Conventional C) Refinancings D) Home Improvement Loans F) Non-occupant Loans on G) Loans On Manufactured Number Average Value Number Average Value Number Average Value Number Average Value Number Average Value Number Average Value
LOANS ORIGINATED 5 $347,368 668 $246,901 272 $263,168 70 $116,900 76 $249,669 15 $136,855 APPLICATIONS APPROVED, NOT ACCEPTED 0 $0 154 $250,066 69 $277,171 18 $95,942 14 $230,911 4 $91,790 APPLICATIONS DENIED 1 $218,790 149 $262,966 156 $302,016 46 $130,278 24 $305,224 12 $91,251 APPLICATIONS WITHDRAWN 1 $409,890 171 $256,020 116 $283,099 14 $177,863 25 $250,779 3 $117,250 FILES CLOSED FOR INCOMPLETENESS 0 $0 17 $272,030 32 $307,753 1 $39,730 4 $317,882 0 $0
Aggregated Statistics For Year 2005(Based on 3 partial tracts) A) FHA, FSA/RHS & VA B) Conventional C) Refinancings D) Home Improvement Loans F) Non-occupant Loans on G) Loans On Manufactured Number Average Value Number Average Value Number Average Value Number Average Value Number Average Value Number Average Value
LOANS ORIGINATED 3 $224,693 497 $236,255 294 $250,365 57 $127,556 77 $225,421 18 $131,022 APPLICATIONS APPROVED, NOT ACCEPTED 0 $0 126 $246,775 53 $259,794 7 $82,784 14 $223,457 6 $89,215 APPLICATIONS DENIED 1 $224,220 112 $243,861 118 $263,365 34 $92,518 14 $281,571 11 $111,189 APPLICATIONS WITHDRAWN 1 $303,980 99 $233,713 99 $243,881 12 $195,846 16 $219,319 6 $141,892 FILES CLOSED FOR INCOMPLETENESS 0 $0 15 $276,775 32 $245,286 1 $73,510 2 $217,780 0 $0
Aggregated Statistics For Year 2004(Based on 3 partial tracts) A) FHA, FSA/RHS & VA B) Conventional C) Refinancings D) Home Improvement Loans E) Loans on Dwellings For 5+ Families F) Non-occupant Loans on G) Loans On Manufactured Number Average Value Number Average Value Number Average Value Number Average Value Number Average Value Number Average Value Number Average Value
LOANS ORIGINATED 10 $201,697 271 $188,220 289 $197,601 52 $115,154 1 $225,130 47 $189,816 16 $97,488 APPLICATIONS APPROVED, NOT ACCEPTED 2 $167,410 57 $200,751 53 $198,338 9 $82,102 0 $0 9 $238,159 7 $117,433 APPLICATIONS DENIED 1 $155,920 49 $210,742 92 $195,071 28 $78,810 0 $0 10 $214,980 7 $102,754 APPLICATIONS WITHDRAWN 2 $163,210 61 $192,061 91 $191,768 12 $127,077 0 $0 12 $192,304 2 $95,610 FILES CLOSED FOR INCOMPLETENESS 1 $139,530 11 $210,019 26 $199,998 2 $78,740 0 $0 2 $147,805 0 $0
Aggregated Statistics For Year 2003(Based on 3 partial tracts) A) FHA, FSA/RHS & VA B) Conventional C) Refinancings D) Home Improvement Loans F) Non-occupant Loans on Number Average Value Number Average Value Number Average Value Number Average Value Number Average Value
LOANS ORIGINATED 30 $174,563 236 $159,975 297 $151,016 12 $54,863 27 $165,222 APPLICATIONS APPROVED, NOT ACCEPTED 2 $150,170 27 $142,544 48 $158,350 3 $40,667 4 $133,278 APPLICATIONS DENIED 4 $179,692 45 $149,639 84 $158,325 9 $67,533 6 $113,908 APPLICATIONS WITHDRAWN 5 $203,954 49 $169,245 77 $151,067 3 $76,930 5 $136,802 FILES CLOSED FOR INCOMPLETENESS 2 $130,680 3 $240,493 15 $180,655 3 $54,110 0 $0
Aggregated Statistics For Year 1999(Based on 1 partial tract) A) FHA, FSA/RHS & VA B) Conventional C) Refinancings D) Home Improvement Loans E) Loans on Dwellings For 5+ Families F) Non-occupant Loans on Number Average Value Number Average Value Number Average Value Number Average Value Number Average Value Number Average Value
LOANS ORIGINATED 25 $102,459 37 $117,357 51 $108,978 7 $29,551 1 $66,830 7 $86,884 APPLICATIONS APPROVED, NOT ACCEPTED 1 $82,740 6 $96,887 10 $95,366 2 $39,250 0 $0 1 $123,050 APPLICATIONS DENIED 4 $102,632 15 $69,965 31 $103,502 6 $26,285 0 $0 2 $206,855 APPLICATIONS WITHDRAWN 2 $78,500 13 $109,099 15 $98,489 0 $0 0 $0 1 $98,650 FILES CLOSED FOR INCOMPLETENESS 1 $90,880 2 $82,035 7 $109,211 0 $0 0 $0 1 $25,460
Detailed HMDA statistics for the following Tracts:
0438.07
, 0438.08 , 0438.09
Private Mortgage Insurance Companies Aggregated Statistics For Year 2009(Based on 2 partial tracts) A) Conventional B) Refinancings Number Average Value Number Average Value
LOANS ORIGINATED 2 $139,615 1 $192,360 APPLICATIONS APPROVED, NOT ACCEPTED 1 $135,030 1 $466,920 APPLICATIONS DENIED 0 $0 0 $0 APPLICATIONS WITHDRAWN 0 $0 0 $0 FILES CLOSED FOR INCOMPLETENESS 0 $0 0 $0
Aggregated Statistics For Year 2008(Based on 3 partial tracts) A) Conventional B) Refinancings C) Non-occupant Loans on Number Average Value Number Average Value Number Average Value
LOANS ORIGINATED 7 $269,164 3 $350,400 1 $207,670 APPLICATIONS APPROVED, NOT ACCEPTED 6 $273,107 10 $328,037 2 $257,425 APPLICATIONS DENIED 0 $0 1 $136,000 0 $0 APPLICATIONS WITHDRAWN 0 $0 1 $199,100 0 $0 FILES CLOSED FOR INCOMPLETENESS 0 $0 0 $0 0 $0
Aggregated Statistics For Year 2007(Based on 3 partial tracts) A) Conventional B) Refinancings C) Non-occupant Loans on D) Loans On Manufactured Number Average Value Number Average Value Number Average Value Number Average Value
LOANS ORIGINATED 9 $312,188 13 $370,868 0 $0 1 $174,660 APPLICATIONS APPROVED, NOT ACCEPTED 2 $286,190 5 $360,150 1 $291,580 0 $0 APPLICATIONS DENIED 1 $363,580 1 $256,760 0 $0 0 $0 APPLICATIONS WITHDRAWN 0 $0 0 $0 0 $0 0 $0 FILES CLOSED FOR INCOMPLETENESS 0 $0 0 $0 0 $0 0 $0
Aggregated Statistics For Year 2006(Based on 3 partial tracts) A) Conventional B) Refinancings C) Non-occupant Loans on D) Loans On Manufactured Number Average Value Number Average Value Number Average Value Number Average Value
LOANS ORIGINATED 5 $276,232 6 $346,690 1 $204,910 1 $117,020 APPLICATIONS APPROVED, NOT ACCEPTED 1 $523,650 2 $434,970 0 $0 0 $0 APPLICATIONS DENIED 0 $0 0 $0 0 $0 0 $0 APPLICATIONS WITHDRAWN 0 $0 0 $0 0 $0 0 $0 FILES CLOSED FOR INCOMPLETENESS 0 $0 0 $0 0 $0 0 $0
Aggregated Statistics For Year 2005(Based on 3 partial tracts) A) Conventional B) Refinancings C) Non-occupant Loans on Number Average Value Number Average Value Number Average Value
LOANS ORIGINATED 17 $299,879 6 $298,327 5 $274,820 APPLICATIONS APPROVED, NOT ACCEPTED 3 $310,107 2 $278,955 0 $0 APPLICATIONS DENIED 0 $0 0 $0 0 $0 APPLICATIONS WITHDRAWN 1 $213,970 0 $0 1 $139,120 FILES CLOSED FOR INCOMPLETENESS 0 $0 0 $0 0 $0
Aggregated Statistics For Year 2004(Based on 3 partial tracts) A) Conventional B) Refinancings C) Non-occupant Loans on Number Average Value Number Average Value Number Average Value
LOANS ORIGINATED 31 $236,145 9 $218,366 4 $246,470 APPLICATIONS APPROVED, NOT ACCEPTED 11 $210,916 3 $236,000 2 $202,880 APPLICATIONS DENIED 0 $0 0 $0 0 $0 APPLICATIONS WITHDRAWN 1 $193,980 0 $0 0 $0 FILES CLOSED FOR INCOMPLETENESS 0 $0 0 $0 0 $0
Aggregated Statistics For Year 2003(Based on 3 partial tracts) A) Conventional B) Refinancings C) Non-occupant Loans on Number Average Value Number Average Value Number Average Value
LOANS ORIGINATED 33 $195,347 25 $162,939 1 $201,150 APPLICATIONS APPROVED, NOT ACCEPTED 3 $185,267 2 $209,100 0 $0 APPLICATIONS DENIED 0 $0 0 $0 0 $0 APPLICATIONS WITHDRAWN 0 $0 1 $222,370 0 $0 FILES CLOSED FOR INCOMPLETENESS 0 $0 0 $0 0 $0
Aggregated Statistics For Year 1999(Based on 1 partial tract) A) Conventional B) Refinancings C) Non-occupant Loans on Number Average Value Number Average Value Number Average Value
LOANS ORIGINATED 6 $120,813 5 $134,792 1 $109,970 APPLICATIONS APPROVED, NOT ACCEPTED 1 $161,600 2 $138,080 0 $0 APPLICATIONS DENIED 2 $85,395 1 $91,940 0 $0 APPLICATIONS WITHDRAWN 0 $0 0 $0 0 $0 FILES CLOSED FOR INCOMPLETENESS 0 $0 0 $0 0 $0
Detailed PMIC statistics for the following Tracts:
0438.07
, 0438.08 , 0438.09 Cherry Valley compared to California state average:
Median house value below state average. Unemployed percentage below state average. Median age significantly above state average. Foreign-born population percentage below state average. Renting percentage below state average. Length of stay since moving in above state average. Cherry Valley on our top lists :
#65 on the list of "Top 101 cities with largest percentage of females in industries: real estate and rental and leasing (population 5,000+)"
#3 on the list of "Top 101 counties with the highest lead air pollution readings in 2012 (µg/m3 )"
#4 on the list of "Top 101 counties with the highest ground withdrawal of fresh water for public supply"
#11 on the list of "Top 101 counties with the most Catholic adherents"
#11 on the list of "Top 101 counties with the highest total withdrawal of fresh water for public supply"
#12 on the list of "Top 101 counties with the highest carbon monoxide air pollution readings in 2012 (ppm)"
Top Patent Applicants
Steve Williams (14)
Steve E. Williams (1)
Carla Gober (1)
Coby Webb (1)
Harry Hillar Kulde (1)
Total of 18 patent applications in 2008-2024.


 Recent articles from our blog. Our writers, many of them Ph.D. graduates or candidates, create easy-to-read articles on a wide variety of topics.

 (4.5 miles