Estimated zip code population in 2022: 54,777 Zip code population in 2010: 52,606 Zip code population in 2000: 41,566
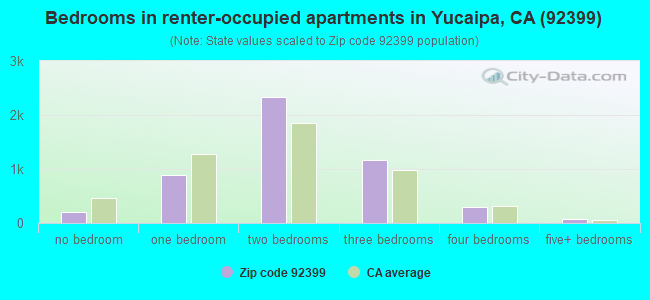
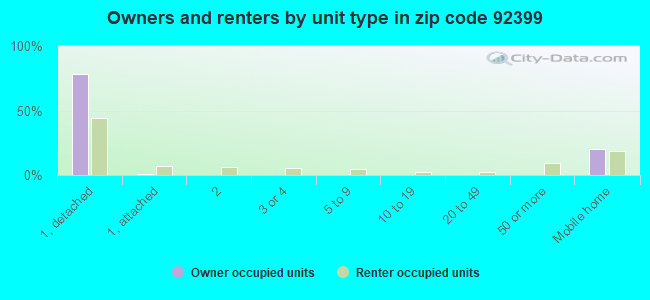
Houses and condos: 20,300 Renter-occupied apartments: 4,980
% of renters here:
26%
State:
44%
March 2022 cost of living index in zip code 92399: 81.6 (low, U.S. average is 100)
Land area: 53.0 sq. mi. Water area: 0.0 sq. mi.
Population density: 1,033 people per square mile
(low).
OSM Map
General Map
Google Map
MSN Map
OSM Map
General Map
Google Map
MSN Map
OSM Map
General Map
Google Map
MSN Map
OSM Map
General Map
Google Map
MSN Map
Please wait while loading the map...
Real estate property taxes paid for housing units in 2022:
This zip code:
0.8% ($3,587)
California:
0.7% ($4,831)
Median real estate property taxes paid for housing units with mortgages in 2022: $4,098 (0.8%) Median real estate property taxes paid for housing units with no mortgage in 2022: $1,931 (0.8%)
Averages for the 2020 tax year for zip code 92399, filed in 2021:
Average Adjusted Gross Income (AGI) in 2020: $72,621 (Individual Income Tax Returns)
Here:
$72,621
State:
$95,910
Salary/wage: $63,050 (reported on 80.6% of returns)
Here:
$63,050
State:
$77,331
(% of AGI for various income ranges: 1133.7% for AGIs below $25k, 3638.3% for AGIs $25k-50k, 6969.0% for AGIs $50k-75k, 10215.7% for AGIs $75k-100k, 20110.1% for AGIs $100k-200k, 62640.2% for AGIs over 200k)
Taxable interest for individuals: $946 (reported on 36.4% of returns)
This zip code:
$946
California:
$2,294
(% of AGI for various income ranges: 11.3% for AGIs below $25k, 17.1% for AGIs $25k-50k, 32.5% for AGIs $50k-75k, 65.5% for AGIs $75k-100k, 96.0% for AGIs $100k-200k, 774.4% for AGIs over 200k)
Ordinary dividends: $3,536 (reported on 12.7% of returns)
Here:
$3,536
State:
$10,949
(% of AGI for various income ranges: 16.9% for AGIs below $25k, 21.8% for AGIs $25k-50k, 43.8% for AGIs $50k-75k, 53.8% for AGIs $75k-100k, 160.5% for AGIs $100k-200k, 897.2% for AGIs over 200k)
Net capital gain/loss in AGI: +$17,579 (reported on 13.1% of returns)
Here:
+$17,579
State:
+$49,306
(% of AGI for various income ranges: 3.7% for AGIs below $25k, 17.4% for AGIs $25k-50k, 46.5% for AGIs $50k-75k, 84.7% for AGIs $75k-100k, 349.7% for AGIs $100k-200k, 10896.3% for AGIs over 200k)
Profit/loss from business: +$12,369 (reported on 16.5% of returns)
Here:
+$12,369
State:
+$15,671
(% of AGI for various income ranges: 123.8% for AGIs below $25k, 168.1% for AGIs $25k-50k, 254.3% for AGIs $50k-75k, 329.0% for AGIs $75k-100k, 520.8% for AGIs $100k-200k, 3312.6% for AGIs over 200k)
Taxable individual retirement arrangement distribution: $19,980 (reported on 6.6% of returns)
92399:
$19,980
California:
$23,505
(% of AGI for various income ranges: 41.6% for AGIs below $25k, 81.5% for AGIs $25k-50k, 127.2% for AGIs $50k-75k, 334.8% for AGIs $75k-100k, 524.7% for AGIs $100k-200k, 1687.7% for AGIs over 200k)
Self-employed (Keogh) retirement plans: $31,050 (reported on 0.3% of returns)
92399:
$31,050
California:
$30,163
(% of AGI for various income ranges: 21.9% for AGIs $100k-200k, 457.0% for AGIs over 200k)
Total itemized deductions: $32,769 (reported on 16.7% of returns)
Here:
$32,769
State:
$39,517
(% of AGI for various income ranges: 65.8% for AGIs below $25k, 190.6% for AGIs $25k-50k, 589.1% for AGIs $50k-75k, 1200.3% for AGIs $75k-100k, 2309.9% for AGIs $100k-200k, 9160.0% for AGIs over 200k)
Charity contributions: $8,335 (reported on 14.3% of returns)
Here:
$8,335
State:
$12,598
(% of AGI for various income ranges: 4.2% for AGIs below $25k, 23.6% for AGIs $25k-50k, 89.1% for AGIs $50k-75k, 161.3% for AGIs $75k-100k, 492.1% for AGIs $100k-200k, 2966.7% for AGIs over 200k)
Taxes paid: $8,741 (reported on 16.6% of returns)
92399:
$8,741
State:
$8,807
(% of AGI for various income ranges: 12.3% for AGIs below $25k, 41.2% for AGIs $25k-50k, 156.6% for AGIs $50k-75k, 367.7% for AGIs $75k-100k, 701.1% for AGIs $100k-200k, 1926.7% for AGIs over 200k)
Earned income credit: $2,105 (reported on 14.5% of returns)
Here:
$2,105
State:
$2,074
(% of AGI for various income ranges: 83.0% for AGIs below $25k, 75.1% for AGIs $25k-50k, 1.5% for AGIs $50k-75k)
Percentage of individuals using paid preparers for their 2020 taxes: 93.7%
Here:
94%
State:
92%
(% for various income ranges: 92.6% for AGIs below $25k, 94.3% for AGIs $25k-50k, 93.6% for AGIs $50k-75k, 93.6% for AGIs $75k-100k, 94.7% for AGIs $100k-200k, 95.7% for AGIs over 200k)
Averages for the 2012 tax year for zip code 92399, filed in 2013:
Average Adjusted Gross Income (AGI) in 2012: $57,719 (Individual Income Tax Returns)
Here:
$57,719
State:
$72,726
Salary/wage: $52,650 (reported on 81.8% of returns)
Here:
$52,650
State:
$59,079
(% of AGI for various income ranges: 69.2% for AGIs below $25k, 77.1% for AGIs $25k-50k, 77.3% for AGIs $50k-75k, 77.3% for AGIs $75k-100k, 80.1% for AGIs $100k-200k, 58.9% for AGIs over 200k)
Taxable interest for individuals: $1,070 (reported on 37.7% of returns)
This zip code:
$1,070
California:
$2,146
(% of AGI for various income ranges: 1.0% for AGIs below $25k, 0.6% for AGIs $25k-50k, 0.8% for AGIs $50k-75k, 0.5% for AGIs $75k-100k, 0.5% for AGIs $100k-200k, 1.1% for AGIs over 200k)
Ordinary dividends: $2,864 (reported on 13.3% of returns)
Here:
$2,864
State:
$9,308
(% of AGI for various income ranges: 0.9% for AGIs below $25k, 0.5% for AGIs $25k-50k, 0.5% for AGIs $50k-75k, 0.5% for AGIs $75k-100k, 0.5% for AGIs $100k-200k, 1.3% for AGIs over 200k)
Net capital gain/loss in AGI: +$4,108 (reported on 11.2% of returns)
Here:
+$4,108
State:
+$30,460
(% of AGI for various income ranges: 0.3% for AGIs $75k-100k, 0.4% for AGIs $100k-200k, 4.0% for AGIs over 200k)
Profit/loss from business: +$12,376 (reported on 17.4% of returns)
Here:
+$12,376
State:
+$17,064
(% of AGI for various income ranges: 10.3% for AGIs below $25k, 4.6% for AGIs $25k-50k, 2.7% for AGIs $50k-75k, 2.6% for AGIs $75k-100k, 2.2% for AGIs $100k-200k, 4.7% for AGIs over 200k)
Taxable individual retirement arrangement distribution: $15,210 (reported on 7.9% of returns)
92399:
$15,210
California:
$19,557
(% of AGI for various income ranges: 2.5% for AGIs below $25k, 2.2% for AGIs $25k-50k, 2.2% for AGIs $50k-75k, 2.6% for AGIs $75k-100k, 1.9% for AGIs $100k-200k, 1.5% for AGIs over 200k)
Self-employment retirement plans: $19,350 (reported on 0.5% of returns)
92399:
$19,350
California:
$24,530
(% of AGI for various income ranges: 0.1% for AGIs $50k-75k, 0.8% for AGIs over 200k)
Total itemized deductions: $26,770 (26% of AGI, reported on 40.5% of returns)
Here:
$26,770
State:
$34,004
Here:
26.4% of AGI
State:
22.7% of AGI
(% of AGI for various income ranges: 10.5% for AGIs below $25k, 13.2% for AGIs $25k-50k, 19.1% for AGIs $50k-75k, 20.5% for AGIs $75k-100k, 21.8% for AGIs $100k-200k, 19.4% for AGIs over 200k)
Charity contributions: $4,004 (reported on 34.7% of returns)
Here:
$4,004
State:
$4,659
(% of AGI for various income ranges: 0.9% for AGIs below $25k, 1.5% for AGIs $25k-50k, 2.3% for AGIs $50k-75k, 2.5% for AGIs $75k-100k, 2.9% for AGIs $100k-200k, 3.1% for AGIs over 200k)
Taxes paid: $8,741 (reported on 40.4% of returns)
92399:
$8,741
State:
$14,448
(% of AGI for various income ranges: 2.0% for AGIs below $25k, 2.9% for AGIs $25k-50k, 5.0% for AGIs $50k-75k, 6.0% for AGIs $75k-100k, 7.6% for AGIs $100k-200k, 9.0% for AGIs over 200k)
Earned income credit: $2,256 (reported on 19.0% of returns)
Here:
$2,256
State:
$2,286
(% of AGI for various income ranges: 6.8% for AGIs below $25k, 1.4% for AGIs $25k-50k)
Percentage of individuals using paid preparers for their 2012 taxes: 63.9%
Here:
64%
State:
64%
(% for various income ranges: 57.0% for AGIs below $25k, 62.5% for AGIs $25k-50k, 69.2% for AGIs $50k-75k, 68.2% for AGIs $75k-100k, 72.9% for AGIs $100k-200k, 80.3% for AGIs over 200k)
Averages for the 2004 tax year for zip code 92399, filed in 2005:
Average Adjusted Gross Income (AGI) in 2004: $51,607 (Individual Income Tax Returns)
Here:
$51,607
State:
$58,600
Salary/wage: $46,913 (reported on 83.5% of returns)
Here:
$46,913
State:
$49,455
(% of AGI for various income ranges: 132.1% for AGIs below $10k, 72.1% for AGIs $10k-25k, 80.1% for AGIs $25k-50k, 81.7% for AGIs $50k-75k, 85.4% for AGIs $75k-100k, 67.1% for AGIs over 100k)
Taxable interest for individuals: $1,270 (reported on 46.6% of returns)
This zip code:
$1,270
California:
$2,365
(% of AGI for various income ranges: 8.8% for AGIs below $10k, 2.2% for AGIs $10k-25k, 1.1% for AGIs $25k-50k, 0.9% for AGIs $50k-75k, 0.8% for AGIs $75k-100k, 1.0% for AGIs over 100k)
Taxable dividends: $1,672 (reported on 17.5% of returns)
Here:
$1,672
State:
$4,746
(% of AGI for various income ranges: 4.1% for AGIs below $10k, 1.1% for AGIs $10k-25k, 0.6% for AGIs $25k-50k, 0.4% for AGIs $50k-75k, 0.4% for AGIs $75k-100k, 0.5% for AGIs over 100k)
Net capital gain/loss: +$9,615 (reported on 15.7% of returns)
Here:
+$9,615
State:
+$23,418
(% of AGI for various income ranges: 3.0% for AGIs below $10k, 0.2% for AGIs $10k-25k, 0.5% for AGIs $25k-50k, 0.9% for AGIs $50k-75k, 1.0% for AGIs $75k-100k, 6.0% for AGIs over 100k)
Profit/loss from business: +$14,013 (reported on 17.1% of returns)
Here:
+$14,013
State:
+$16,826
(% of AGI for various income ranges: 3.7% for AGIs below $10k, 7.3% for AGIs $10k-25k, 5.2% for AGIs $25k-50k, 4.2% for AGIs $50k-75k, 2.9% for AGIs $75k-100k, 4.9% for AGIs over 100k)
IRA payment deduction: $3,392 (reported on 2.8% of returns)
92399:
$3,392
California:
$3,192
(% of AGI for various income ranges: 0.5% for AGIs below $10k, 0.2% for AGIs $10k-25k, 0.3% for AGIs $25k-50k, 0.2% for AGIs $50k-75k, 0.2% for AGIs $75k-100k, 0.1% for AGIs over 100k)
Self-employed pension: $17,250 (reported on 0.8% of returns)
Here:
$17,250
California:
$17,688
(% of AGI for various income ranges: 0.1% for AGIs $25k-50k, 0.1% for AGIs $50k-75k, 0.1% for AGIs $75k-100k, 0.5% for AGIs over 100k)
Total itemized deductions: $24,254 (28% of AGI, reported on 45.0% of returns)
Here:
$24,254
State:
$28,113
Here:
28.3% of AGI
State:
25.3% of AGI
(% of AGI for various income ranges: 17.7% for AGIs below $10k, 13.1% for AGIs $10k-25k, 18.0% for AGIs $25k-50k, 24.4% for AGIs $50k-75k, 25.9% for AGIs $75k-100k, 20.7% for AGIs over 100k)
Charity contributions deductions: $3,500 (4% of AGI, reported on 40.7% of returns)
Here:
$3,500
State:
$3,923
Here:
3.9% of AGI
State:
3.3% of AGI
(% of AGI for various income ranges: 1.2% for AGIs below $10k, 1.5% for AGIs $10k-25k, 2.0% for AGIs $25k-50k, 3.0% for AGIs $50k-75k, 3.2% for AGIs $75k-100k, 3.0% for AGIs over 100k)
Total tax: $7,445 (reported on 76.3% of returns)
92399:
$7,445
State:
$10,761
(% of AGI for various income ranges: 4.4% for AGIs below $10k, 4.2% for AGIs $10k-25k, 6.2% for AGIs $25k-50k, 7.8% for AGIs $50k-75k, 8.6% for AGIs $75k-100k, 16.6% for AGIs over 100k)
Earned income credit: $1,670 (reported on 14.5% of returns)
Here:
$1,670
State:
$1,763
Percentage of individuals using paid preparers for their 2004 taxes: 67.8%
Here:
68%
State:
66%
(% for various income ranges: 56.0% for AGIs below $10k, 65.3% for AGIs $10k-25k, 69.3% for AGIs $25k-50k, 71.5% for AGIs $50k-75k, 74.4% for AGIs $75k-100k, 77.1% for AGIs over 100k)
Likely homosexual households (counted as self-reported same-sex unmarried-partner households)
Lesbian couples: 0.2% of all households
Gay men: 0.0% of all households
Household received Food Stamps/SNAP in the past 12 months: 2,255 Household did not receive Food Stamps/SNAP in the past 12 months: 16,961
Women who had a birth in the past 12 months: 710 (563 now married, 145 unmarried) Women who did not have a birth in the past 12 months: 10,791 (4,873 now married, 5,893 unmarried)
Housing units in zip code 92399 with a mortgage: 8,944 (423 second mortgage, 16 home equity loan, 381 both second mortgage and home equity loan) Houses without a mortgage: 131
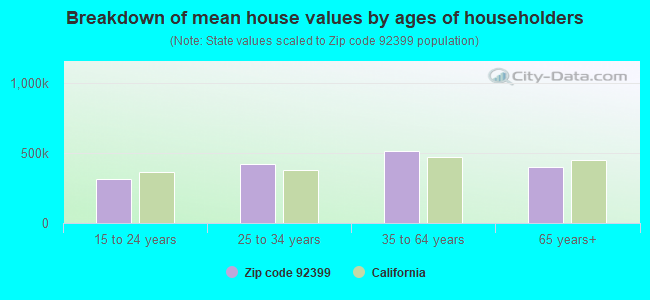
Median monthly owner costs for units with a mortgage: $2,201 Median monthly owner costs for units without a mortgage: $595
Residents with income below the poverty level in 2022:
This zip code:
8.5%
Whole state:
12.2%
Residents with income below 50% of the poverty level in 2022:
This zip code:
5.2%
Whole state:
6.2%
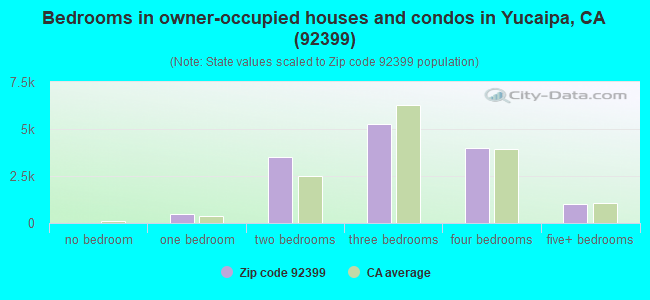
Median number of rooms in houses and condos:
Here:
6.1
State:
6.0
Median number of rooms in apartments:
Here:
4.6
State:
3.9
Notable locations in this zip code not listed on our city pages
Notable locations in zip code 92399: Jackson Ranch (A), Mill Creek Ranger Station (B), Oak Glen Ranger Station (C), Mile High Ranch (D), Oak Glen Forest Station (E), California Department of Forestry and Fire Protection Station 18 - Crafton Hills (F), California Department of Forestry and Fire Protection Station 13 - Yucaipa City Fire Department (G), San Bernardino County Fire Department Station 555 Oak Glen (H), California Department of Forestry and Fire Protection Oak Glenn Conservation Camp (I), Yucaipa City Hall (J), Yucaipa Branch San Bernardino County Library (K), Mousley Museum of Natural History (L). Display/hide their locations on the map
Churches in zip code 92399 include: Abundant Life Fellowship Church (A), Apostolic Tabernacle (B), Calvary Christian Center (C), Church of God (D), Church of the Nazarene (E), Community Church of Yucaipa (F), First Baptist Church of Yucaipa (G), Faith Lutheran Church (H), First Church of Christ Scientist (I). Display/hide their locations on the map
9,738 married couples with children.
2,155 single-parent households (790 men, 1,365 women).
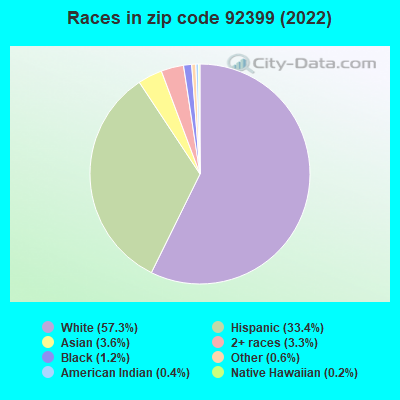
77.8% of residents of 92399 zip code speak English at home.
17.7% of residents speak Spanish at home (75% very well, 12% well, 8% not well, 4% not at all).
2.5% of residents speak other Indo-European language at home (92% very well, 3% well, 4% not well).
1.6% of residents speak Asian or Pacific Island language at home (57% very well, 34% well, 9% not well).
0.1% of residents speak other language at home (100% very well).
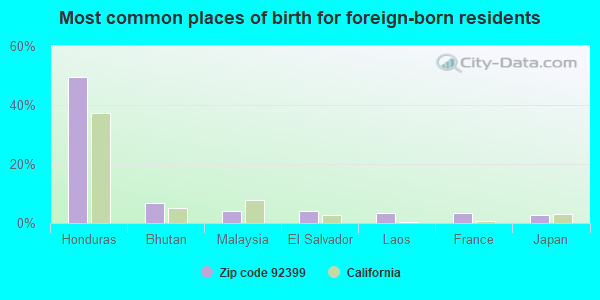
Foreign born population: 5,531 (10.1%) (65.9% of them are naturalized citizens)
This zip code:
10.1%
Whole state:
26.7%
50%Honduras
7%Bhutan
4%Malaysia
4%El Salvador
3%Laos
3%France
3%Japan
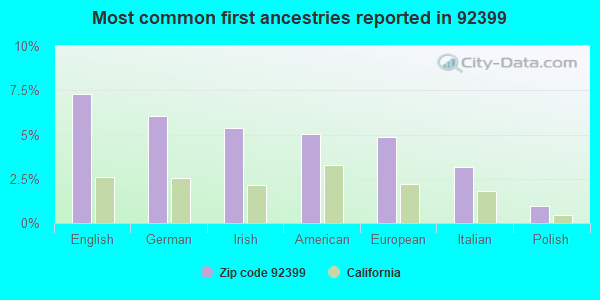
7%English
6%German
5%Irish
5%American
5%European
3%Italian
1%Polish
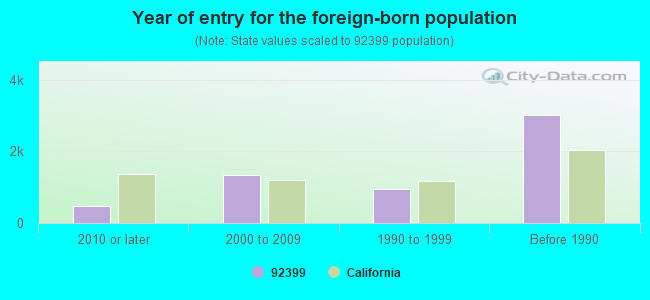
Year of entry for the foreign-born population
4852010 or later
1,3362000 to 2009
9371990 to 1999
3,019Before 1990
Major facilities with environmental interests located in this zip code:
EQUILON ENTERPRISES (34429 YUCAIPA BLVD in YUCAIPA, CA) . Federal Facility
STATE MASTER (California - Hazardous Waste Tracking) - HAZARDOU WASTE PROGRAM Large Quantity Generators, more that 1000 kg of hazardous waste/month (Resource Conservation and Recovery Act (tracking hazardous waste)) Organizations: SHELL OIL PRODUCTS US (CONTACT/OPERATOR)
, EQUILON ENTERPRISES LLC DBA SHELL OIL PR (CONTACT/OWNER)
Alternative names: SHELL OIL CO
CALIFORNIA DEPT OF FORESTRY (41100 PINE BENCH RD in YUCAIPA, CA)
STATE MASTER (California - Hazardous Waste Tracking) - HAZARDOU WASTE PROGRAM Small Quantity Generators, between 100 kg and 1000 kg of hazardous waste/month (Resource Conservation and Recovery Act (tracking hazardous waste)) - notification COMMUNITY WATER SYSTEM (SDWIS) Organizations: STATE OF CALIFORNIA (CONTACT/OWNER)
Alternative names: CDF - OAK GLEN CONSERVATION CAMP, KBF - OAK GLEN CONSERVATION CAMP
NASH CLEANERS (35140 YUCAIPA in YUCAIPA, CA)
STATE MASTER (California - Hazardous Waste Tracking) - HAZARDOU WASTE PROGRAM Small Quantity Generators, between 100 kg and 1000 kg of hazardous waste/month (Resource Conservation and Recovery Act (tracking hazardous waste))
GREEN VALLEY HIGH (CONT.) (35912 AVE. H in YUCAIPA, CA)
(National Center for Education Statistics) - STATE ID-3633351 Organizations: YUCAIPA-CALIMESA JT. UNIFIED (SCHOOL DISTRICT)
CALIMESA ELEMENTARY (13523 SECOND ST. in YUCAIPA, CA)
(National Center for Education Statistics) - STATE ID-6037402 Organizations: YUCAIPA-CALIMESA JT. UNIFIED (SCHOOL DISTRICT)
CANYON MIDDLE (35948 SUSAN STREET in YUCAIPA, CA)
(National Center for Education Statistics) - STATE ID-3631025 Organizations: YUCAIPA-CALIMESA JT. UNIFIED (SCHOOL DISTRICT)
ACACIA AUTO BODY (35018 ACACIA in YUCAIPA, CA)
Small Quantity Generators, between 100 kg and 1000 kg of hazardous waste/month (Resource Conservation and Recovery Act (tracking hazardous waste)) - notification Organizations: GREG JONES (CONTACT/OWNER)
AG COMMODITIES EXPRESS (13600 CALIMESA BLVD in YUCAIPA, CA)
TRANSPORTER (Resource Conservation and Recovery Act (tracking hazardous waste)) Organizations: STEVEN ARNETT (CONTACT/OWNER)
INLAND POWER SWEEPING (31710 DUNLAP BLVD in YUCAIPA, CA)
TRANSPORTER (Resource Conservation and Recovery Act (tracking hazardous waste)) Business NAICS classification: ALL OTHER MISCELLANEOUS WASTE MANAGEMENT SERVICES. Organizations: KERRY A RIEGER & DENNIS C RIEGER (CONTACT/OWNER)
A 1 TRANSMISSION (35018 ACACIA BLVD UNIT B in YUCAIPA, CA)
Small Quantity Generators, between 100 kg and 1000 kg of hazardous waste/month (Resource Conservation and Recovery Act (tracking hazardous waste)) - notification Organizations: KELLY ZIMMERMAN (CONTACT/OWNER)
A 1 TRANSMISSIONS (35618 ACCACIA in YUCAIPA, CA)
Small Quantity Generators, between 100 kg and 1000 kg of hazardous waste/month (Resource Conservation and Recovery Act (tracking hazardous waste)) - notification Organizations: KELLY ZIMMERMAN (CONTACT/OWNER)
G. BARRY J. GLASER (P.O. BOX 1322 in YUCAIPA, CA)
COMPLIANCE ACTIVITY (Tracking inspections of insecticide, fungicide, and rodenticide, and toxic substances)
KELLEY EQUIP SALES INC (32313 DUNLAP BLVD in YUCAIPA, CA)
Small Quantity Generators, between 100 kg and 1000 kg of hazardous waste/month (Resource Conservation and Recovery Act (tracking hazardous waste))
Housing units lacking complete plumbing facilities: 2.1% Housing units lacking complete kitchen facilities: 4.1%
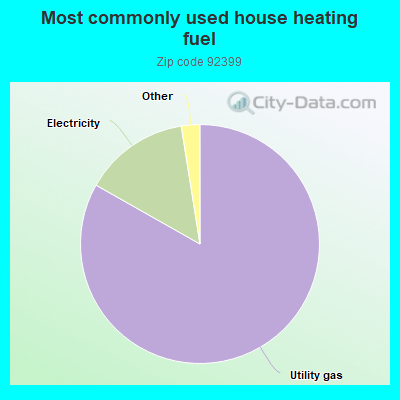
83.2%Utility gas
14.3%Electricity
0.7%Bottled, tank, or LP gas
0.6%Wood
0.5%No fuel used
Population in 1990: 33,298. Population change in the 1990s: +8,268 (+24.8%).
Place of birth for U.S.-born residents:
This state: 39,978
Northeast: 1,767
Midwest: 3,059
South: 2,066
West: 1,871
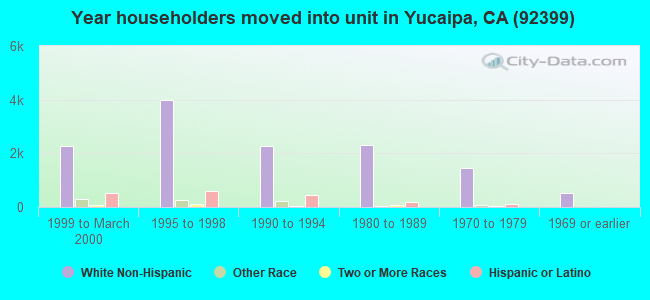
50% of the 92399 zip code residents lived in the same house 5 years ago. Out of people who lived in different houses, 68% lived in this county. Out of people who lived in different counties, 50% lived in California.
92% of the 92399 zip code residents lived in the same house 1 year ago. Out of people who lived in different houses, 58% moved from this county. Out of people who lived in different houses, 33% moved from different county within same state. Out of people who lived in different houses, 9% moved from different state. Out of people who lived in different houses, 0% moved from abroad.
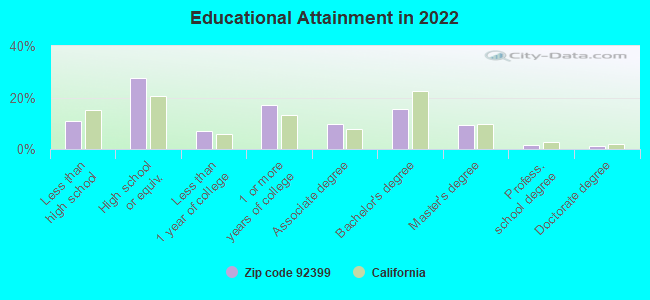
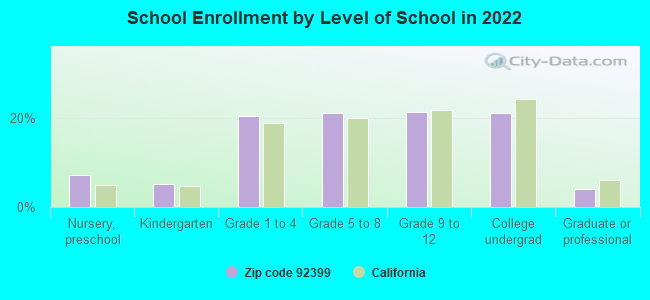
Private vs. public school enrollment:
Students in private schools in grades 1 to 8 (elementary and middle school): 790
Here:
14.2%
California:
10.5%
Students in private schools in grades 9 to 12 (high school): 463
Here:
16.2%
California:
8.5%
Students in private undergraduate colleges: 641
Here:
22.5%
California:
15.9%
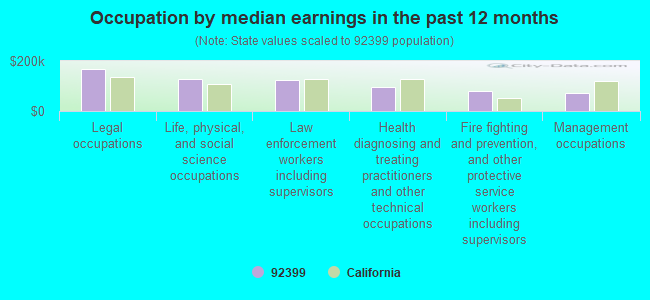
Occupation by median earnings in the past 12 months ($)
168,915Legal occupations
127,006Life, physical, and social science occupations
125,603Law enforcement workers including supervisors
97,679Health diagnosing and treating practitioners and other technical occupations
80,182Fire fighting and prevention, and other protective service workers including supervisors
72,111Management occupations
Companies with federal contracts located in this zip code (YUCAIPA, CA):
DINOFINN INC (34971 AVENUE A; small business) : $9,593,002 in 51 contractsfrom 2000 to 2006
Contracts for Food Items For Resale, Non-Food Items For Resale by Defense Commissary Agency, Department of Defense Signed by year:2000: $107,429; 2001: $0; 2002: $51,812; 2003: $0; 2004: $2,272,751; 2005: $7,130,697; 2006: $30,313.
Biggest contracts:
$1,116,890 with Defense Commissary Agency for Food Items For Resale. Signed on 2005-04-01. Completion date: 2005-08-31.
$811,305 with Defense Commissary Agency for Non-Food Items For Resale. Signed on 2005-10-01. Completion date: 2005-12-31.
$673,170 with Defense Commissary Agency for Food Items For Resale. Signed on 2005-04-01. Completion date: 2005-08-31.
$600,732, same as above.Signed on 2004-10-01. Completion date: 2005-04-01.
FILTER SCIENCE INC (31514 YUCAIPA BLVD; small business) : $823,091 in 6 contractsfrom 2003 to 2006
Contracts for Miscellaneous Special Industry Machinery, Miscellaneous Service and Trade Equipment, Services -- Applied Research and Exploratory Development (R&D), Maintenance, Repair and Rebuilding of Equipment -- Ground Effect Vehicles, Motor Vehicles, Trailers, and Cycles by Army, Air Force Signed by year:2000: $0; 2001: $0; 2002: $0; 2003: $315,750; 2004: $340,000; 2005: $117,341; 2006: $50,000.
Biggest contracts:
$340,000 with Army for Miscellaneous Special Industry Machinery. Signed on 2004-08-03. Completion date: 2005-08-05.
$315,750 with Army for Miscellaneous Service and Trade Equipment. Signed on 2003-09-24. Completion date: 2003-11-18.
$69,615 with Army for Services -- Applied Research and Exploratory Development (R&D). Signed on 2005-12-23. Completion date: 2006-06-30.
$50,000, same as above.Signed on 2006-06-30. Completion date: 2006-10-23.
GLOBAL TEST SOLUTIONS LLC (34428 YUCAIPA BLVD E346) : $211,380 in 7 contractsfrom 2003 to 2006
Contracts for Electrical and Electronic Properties Measuring and Testing Instruments, Time Measuring Instruments by Air Force, Navy Signed by year:2000: $0; 2001: $0; 2002: $0; 2003: $74,300; 2004: $33,535; 2005: $99,710; 2006: $3,835.
Biggest contracts:
$76,700 with Air Force for Electrical and Electronic Properties Measuring and Testing Instruments. Signed on 2005-05-20. Completion date: 2005-08-19.
$74,300, same as above.Signed on 2003-09-15. Completion date: 2003-11-28.
$23,010, same as above.Signed on 2005-10-20. Completion date: 2006-01-31.
$12,645, same as above.Signed on 2004-11-08. Completion date: 2005-01-31.
JONATHAN T EMRAY (35026 YUCAIPA BLVD; small business) : $32,907 in 5 contractsin 2005
Contracts for Hardware, Weapon System, Miscellaneous Power Transmission Equipment, Hardware, Commercial, Generators and Generators Sets, Electrical by Defense Logistics Agency Signed by year:2000: $0; 2001: $0; 2002: $0; 2003: $0; 2004: $0; 2005: $32,907; 2006: $0.
Biggest contracts:
$14,750 with Defense Logistics Agency for Hardware, Weapon System. Signed on 2005-10-20. Completion date: 2006-02-25.
$7,542 with Defense Logistics Agency for Miscellaneous Power Transmission Equipment. Signed on 2005-12-21. Completion date: 2006-03-30.
$4,292 with Defense Logistics Agency for Hardware, Commercial. Signed on 2005-12-02. Completion date: 2006-03-24.
$3,200 with Defense Logistics Agency for Generators and Generators Sets, Electrical. Signed on 2005-10-20. Completion date: 2006-10-25.
PILGRIM PINES CAMP UCC (39570 GLEN RD; small business) : $25,200 in 2 contractsin 2001
$25,200 with Navy for Miscellaneous Items. Signed on 2001-09-20. Completion date: 2002-09-30.
$0, same as above.Signed on 2001-09-20. Completion date: 2002-09-30.
LUTHERAN RETREATS, CAMPS & CON (39136 HARRIS RD) : $20,952 in 4 contractsin 2005
$7,668 with Navy for Other Professional Services. Signed on 2005-07-26. Completion date: 2005-09-16.
$4,428 with Navy for Lodging - Hotel/Motel. Signed on 2005-04-22. Completion date: 2005-04-22.
$4,428, same as above.Signed on 2005-04-22. Completion date: 2005-04-08.
$4,428 with Navy for Other Professional Services. Signed on 2005-05-20. Completion date: 2005-05-20.
Top industries in this zip code by the number of employees in 2005:
Health Care and Social Assistance: Nursing Care Facilities (100-249 employees: 2 establishments, 50-99 employees: 4 establishments)
2005 - 2018 National Fire Incident Reporting System (NFIRS) incidents
Based on the data from the years 2005 - 2018 the average number of fire incidents per year is 105. The highest number of fires - 161 took place in 2008, and the least - 7 in 2005. The data has an increasing trend.
When looking into fire subcategories, the most incidents belonged to: Outside Fires (47.0%), and Structure Fires (23.3%).
Fire incident types reported to NFIRS in Zip Code 92399

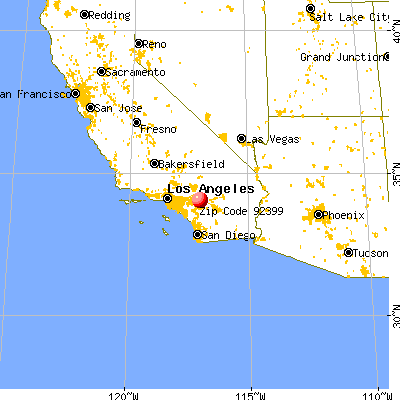


 Nearest zip codes: 92320, 92359, 92223, 92339, 92373, 92374.


 . Federal Facility
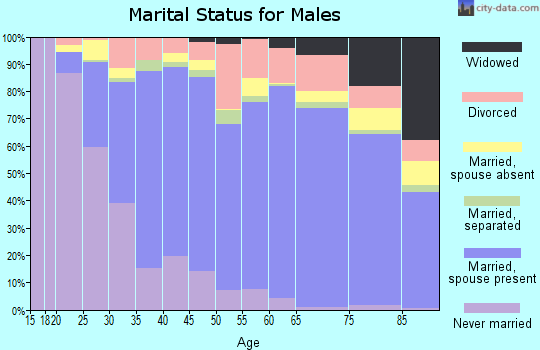

 Based on the data from the years 2005 - 2018 the average number of fire incidents per year is 105. The highest number of fires - 161 took place in 2008, and the least - 7 in 2005. The data has an increasing trend.
 When looking into fire subcategories, the most incidents belonged to: Outside Fires (47.0%), and Structure Fires (23.3%).