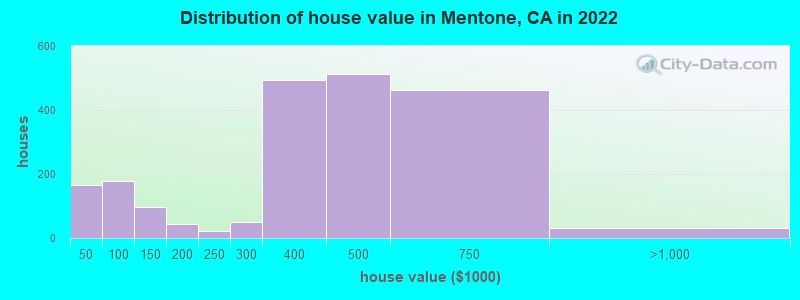
Estimated median house or condo value in 2022: $435,765 (it was $128,200 in 2000)
Mentone:
$435,765
CA:
$715,900
Mean prices in 2022:all housing units: $538,674; detached houses: $572,275; townhouses or other attached units: $512,095; in 2-unit structures: $547,337; in 3-to-4-unit structures: $471,159; in 5-or-more-unit structures: $418,370; mobile homes: $119,083; occupied boats, rvs, vans, etc.: $73,388
Median gross rent in 2022: $1,439.
March 2022 cost of living index in Mentone: 82.3 (low, U.S. average is 100)
Percentage of residents living in poverty in 2022: 12.7%
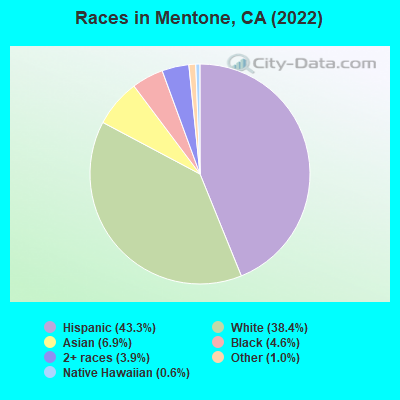
(10.5% for White Non-Hispanic residents, 32.6% for Black residents, 14.5% for Hispanic or Latino residents, 6.6% for other race residents, 13.2% for two or more races residents)
620.6%Native Hawaiian and Other Pacific Islander alone
According to our research of California and other state lists, there were 10 registered sex offenders living in Mentone, California as of April 26, 2024. The ratio of all residents to sex offenders in Mentone is 1,006 to 1. The ratio of registered sex offenders to all residents in this city is lower than the state average.
Recent articles from our blog. Our writers, many of them Ph.D. graduates or candidates, create easy-to-read articles on a wide variety of topics.
Latest news from Mentone, CA collected exclusively by city-data.com from local newspapers, TV, and radio stations
Ancestries: English (5.4%), German (5.2%), American (4.8%), Irish (4.1%), Albanian (1.2%), Dutch (1.0%).
Current Local Time: PST time zone
Elevation: 1660 feet
Land area: 6.23 square miles.
Population density: 1,400 people per square mile (low).
1,221 residents are foreign born (5.9% Latin America, 4.8% Asia).
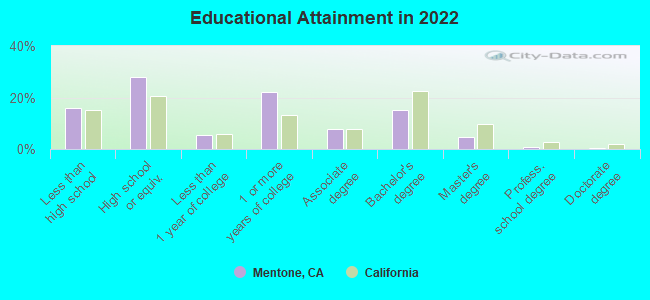
This place:
12.5%
California:
26.5%
Median real estate property taxes paid for housing units with mortgages in 2022: $3,693 (0.8%) Median real estate property taxes paid for housing units with no mortgage in 2022: $1,927 (0.7%)
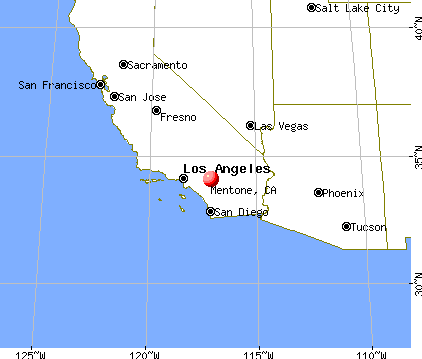
Nearest city with pop. 50,000+: Redlands, CA (3.0 miles , pop. 63,591).
Nearest city with pop. 200,000+: Riverside, CA (17.8 miles , pop. 255,166).
Nearest city with pop. 1,000,000+: Los Angeles, CA (72.0 miles , pop. 3,694,820).
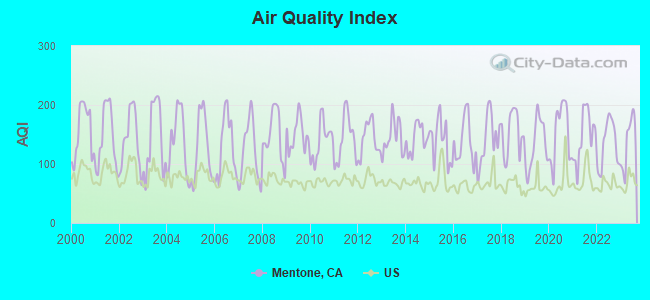
Air Quality Index (AQI) level in 2023 was 138. This is significantly worse than average.
City:
138
U.S.:
73
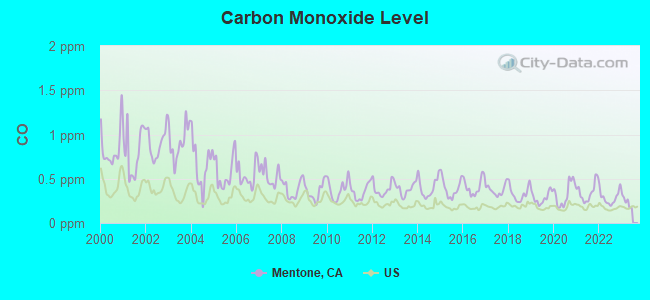
Carbon Monoxide (CO) [ppm] level in 2022 was 0.289. This is about average.Closest monitor was 1.8 miles away from the city center.
City:
0.289
U.S.:
0.251
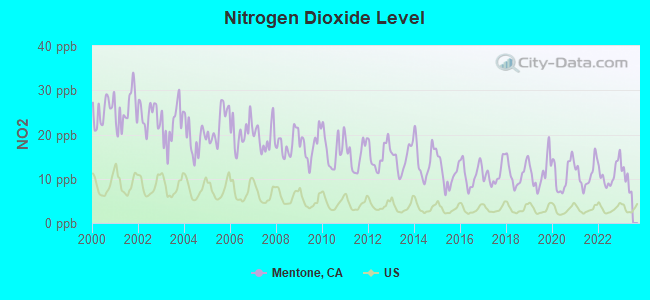
Nitrogen Dioxide (NO2) [ppb] level in 2022 was 11.1. This is significantly worse than average.Closest monitor was 3.8 miles away from the city center.
City:
11.1
U.S.:
5.1
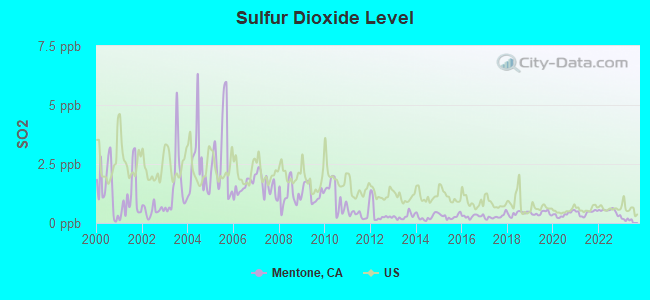
Sulfur Dioxide (SO2) [ppb] level in 2022 was 0.506. This is significantly better than average.Closest monitor was 9.3 miles away from the city center.
City:
0.506
U.S.:
1.515
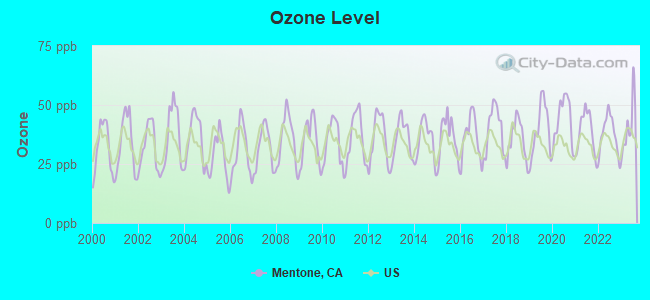
Ozone [ppb] level in 2023 was 41.0. This is worse than average.Closest monitor was 1.6 miles away from the city center.
City:
41.0
U.S.:
33.3
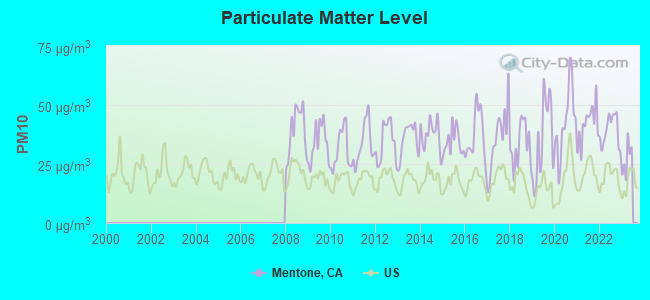
Particulate Matter (PM10) [µg/m3] level in 2022 was 39.2. This is significantly worse than average.Closest monitor was 1.6 miles away from the city center.
City:
39.2
U.S.:
19.2
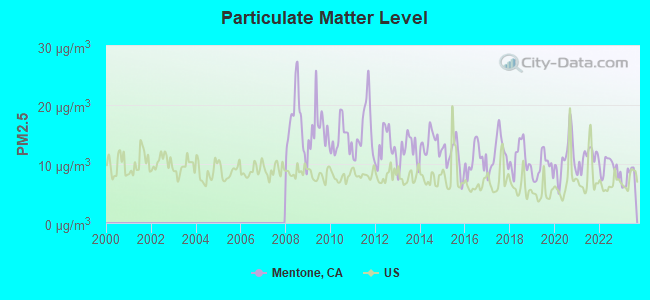
Particulate Matter (PM2.5) [µg/m3] level in 2023 was 7.52. This is about average.Closest monitor was 9.3 miles away from the city center.
City:
7.52
U.S.:
8.11
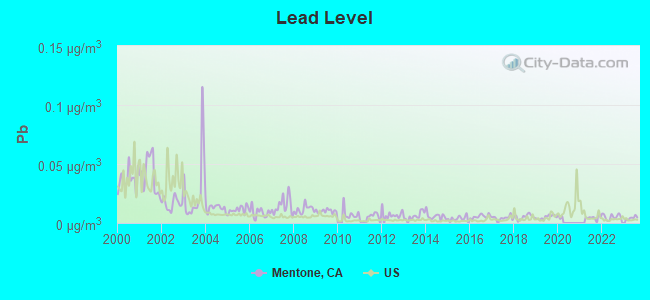
Lead (Pb) [µg/m3] level in 2023 was 0.00426. This is significantly better than average.Closest monitor was 1.8 miles away from the city center.
City:
0.00426
U.S.:
0.00931
Earthquake activity:
Mentone-area historical earthquake activity is significantly above California state average. It is 7339% greater than the overall U.S. average.
On 6/28/1992 at 11:57:34, a magnitude 7.6 (6.2 MB, 7.6 MS, 7.3 MW, Depth: 0.7 mi, Class: Major, Intensity: VIII - XII) earthquake occurred 34.7 miles away from Mentone center, causing 3 deaths (1 shaking deaths, 2 other deaths) and 400 injuries, causing $100,000,000 total damage and $40,000,000 insured losses On 7/21/1952 at 11:52:14, a magnitude 7.7 (7.7 UK) earthquake occurred 125.1 miles away from the city center, causing $50,000,000 total damage On 10/16/1999 at 09:46:44, a magnitude 7.4 (6.3 MB, 7.4 MS, 7.2 MW, 7.3 ML) earthquake occurred 50.0 miles away from the city center On 6/28/1992 at 15:05:30, a magnitude 6.9 (6.3 MB, 6.7 MS, 6.5 MW, 6.9 ME, Depth: 3.1 mi, Class: Strong, Intensity: VII - IX) earthquake occurred 23.3 miles away from Mentone center On 5/19/1940 at 04:36:40, a magnitude 7.2 (7.2 UK) earthquake occurred 100.6 miles away from the city center, causing $33,000,000 total damage On 4/21/1918 at 22:32:30, a magnitude 6.8 (6.8 UK) earthquake occurred 25.3 miles away from Mentone center Magnitude types: body-wave magnitude (MB), energy magnitude (ME), local magnitude (ML), surface-wave magnitude (MS), moment magnitude (MW)
Natural disasters:
The number of natural disasters in San Bernardino County (46) is a lot greater than the US average (15). Major Disasters (Presidential) Declared: 27 Emergencies Declared: 2
Causes of natural disasters: Fires: 24, Floods: 18, Storms: 9, Winter Storms: 6, Landslides: 5, Mudslides: 4, Heavy Rains: 2, Earthquake: 1, Flash Flood: 1, Freeze: 1, Hurricane: 1, Snow: 1, Tornado: 1, Tropical Storm: 1, Wind: 1, Other: 1 (Note: some incidents may be assigned to more than one category).
Hospitals and medical centers in Mentone:
BRASWELL'S IVY RETREAT (2278 NICE STREET)
Other hospitals and medical centers near Mentone:
CAMBRIDGE HOUSE (Hospital, about 2 miles away; REDLANDS, CA)
STILLMAN HOUSE (Hospital, about 2 miles away; REDLANDS, CA)
CHRISTOPHER RANCH II (Hospital, about 2 miles away; REDLANDS, CA)
CHRISTOPHER RANCH (Hospital, about 3 miles away; REDLANDS, CA)
COUNTRY VILLA REDLANDS HEALTHCARE CENTER (Nursing Home, about 3 miles away; REDLANDS, CA)
PLYMOUTH VILLAGE (Nursing Home, about 4 miles away; REDLANDS, CA)
YUCAIPA DIALYSIS CENTER (Dialysis Facility, about 4 miles away; YUCAIPA, CA)
Amtrak stations near Mentone:
12 miles: SAN BERNADINO (SAN BERNARDINO, 1170 W. 3RD ST.) . Services: ticket office, partially wheelchair accessible, public payphones, free short-term parking, free long-term parking.
13 miles: BEAUMONT (550 BEAUMONT AVE.) - Bus Station . Services: fully wheelchair accessible, public restrooms, full-service food facilities, free short-term parking.
15 miles: MORENO VALLEY (ARCO MINI MART, 2624 E. ALESSANDRO BLVD.) - Bus Station . Services: public payphones.
Colleges/universities with over 2000 students nearest to Mentone:
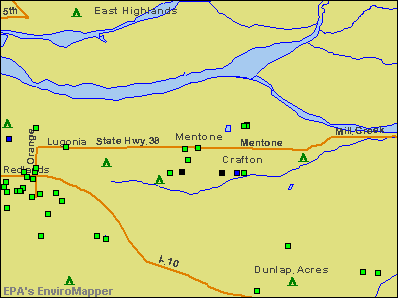
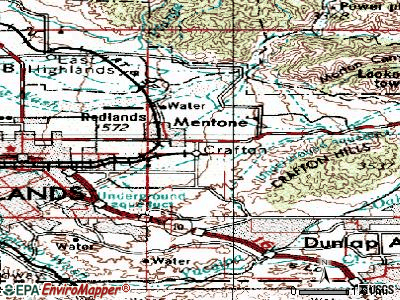
Notable locations in Mentone: San Bernardino County Fire Department Station 9 Mentone (A), Mentone Branch San Bernardino County Library (B). Display/hide their locations on the map
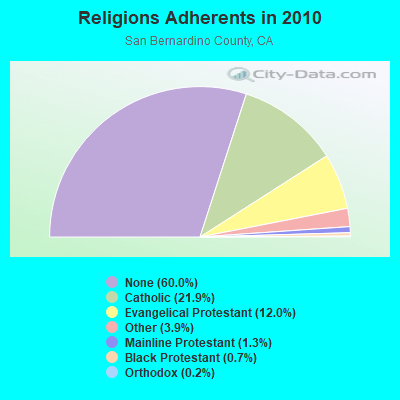
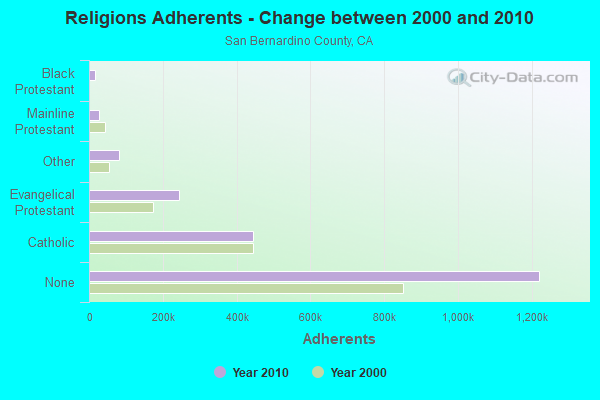
Religion statistics for Mentone, CA (based on San Bernardino County data)
Religion
Adherents
Congregations
Catholic
445,334
55
Evangelical Protestant
243,524
832
Other
80,047
205
Mainline Protestant
26,062
135
Black Protestant
14,969
37
Orthodox
3,868
10
None
1,221,406
-
Source: Clifford Grammich, Kirk Hadaway, Richard Houseal, Dale E.Jones, Alexei Krindatch, Richie Stanley and Richard H.Taylor. 2012. 2010 U.S.Religion Census: Religious Congregations & Membership Study. Association of Statisticians of American Religious Bodies. Jones, Dale E., et al. 2002. Congregations and Membership in the United States 2000. Nashville, TN: Glenmary Research Center. Graphs represent county-level data
FOREST FALLS, Valley Of The Falls Dr. (Lat: 34.086000 Lon: -116.913333), Type: Mast, Structure height: 42.7 m, Call Sign: WREB551, Assigned Frequencies: 6404.79 MHz, 6404.79 MHz, 6404.79 MHz, 6404.79 MHz, Grant Date: 09/11/2019, Expiration Date: 09/11/2029, Certifier: Michael G Rowles, Registrant: San Bernardino County, 670 E. Gilbert Street, San Bernardino, CA 92415, Phone: (909) 388-5563, Email:
MILL CREEK COMM, Mill Creek Communication Site (Lat: 34.088056 Lon: -117.015306), Type: Mast, Structure height: 4.6 m, Overall height: 12.8 m, Call Sign: KMK54, Assigned Frequencies: 6725.00 MHz, Grant Date: 02/13/2018, Expiration Date: 03/04/2028, Cancellation Date: 07/08/2019, Registrant: Southern California Edison Company, General Office #3, 3rd Floor, 2131 Walnut Grove Avenue, Rosemead, CA 91770, Phone: (626) 543-6295, Fax: (626) 543-6472, Email:
FAA Registered Aircraft Manufacturers and Dealers:
1
DIGATI ANTHONY, Po Box 976, Mentone, CA 92359 Certificate: D001321 (Individual), Certificate Issue Date: 02/25/2020, Expiration Date: 02/24/2021
FAA Registered Aircraft:
4
Aircraft: BROWN STEPHEN O FISHER SUPER KOALA (Category: Land, Seats: 2, Weight: Up to 12,499 Pounds), Engine: Reciprocating N-Number: 247SP, N247SP, N-247SP, Serial Number: 33, Certificate Issue Date: 05/23/2000 Registrant (Individual): Stephen O Brown, 1377 Turquoise Ave, Mentone, CA 92359
Aircraft: PIPER PA-30 (Category: Land, Engines: 2, Seats: 6, Weight: Up to 12,499 Pounds, Speed: 139 mph), Engine: LYCOMING IO-320 SERIES (150 HP) (Reciprocating) N-Number: 7777Y, N7777Y, N-7777Y, Serial Number: 30-863, Airworthiness Date: 07/14/1965, Certificate Issue Date: 04/24/2020 Registrant (Individual): Anthony J Digati, Po Box 976, Mentone, CA 92359
Aircraft: SOCATA TBM 700 (Category: Land, Seats: 7, Weight: Up to 12,499 Pounds), Engine: P&W CANADA PT6A-66 SER (850 HP) (Turbo-prop) N-Number: 850TB, N850TB, N-850TB, Serial Number: 346, Year manufactured: 2006, Airworthiness Date: 02/10/2006, Certificate Issue Date: 01/22/2015 Registrant (LLC): Aam Air LLC, 9151 Greenspot Rd, Mentone, CA 92359
Aircraft: CESSNA 206 (Category: Land, Seats: 6, Weight: Up to 12,499 Pounds, Speed: 132 mph), Engine: CONT MOTOR IO 520 SERIES (285 HP) (Reciprocating) N-Number: 929RH, N929RH, N-929RH, Serial Number: 206-0061, Year manufactured: 1964, Airworthiness Date: 11/03/1993, Certificate Issue Date: 09/30/2004 Registrant (Co-Owned): Merlin K Trustee Johnson, Po Box 777, Mentone, CA 92359, Other Owners: Diane J Trustee Johnson
Home Mortgage Disclosure Act Aggregated Statistics For Year 2009 (Based on 1 partial tract)
A) FHA, FSA/RHS & VA Home Purchase Loans
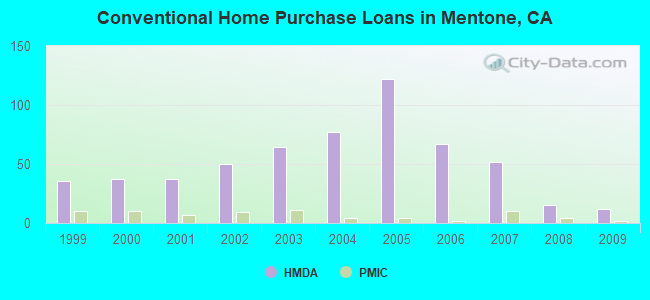
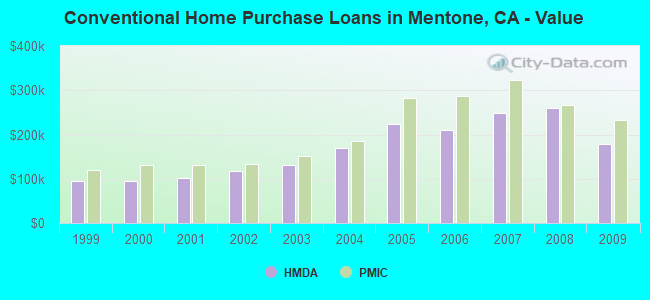
B) Conventional Home Purchase Loans
C) Refinancings
D) Home Improvement Loans
E) Loans on Dwellings For 5+ Families
F) Non-occupant Loans on < 5 Family Dwellings (A B C & D)
G) Loans On Manufactured Home Dwelling (A B C & D)
Number
Average Value
Number
Average Value
Number
Average Value
Number
Average Value
Number
Average Value
Number
Average Value
Number
Average Value
LOANS ORIGINATED
28
$246,258
12
$177,864
32
$224,273
2
$161,045
1
$2,123,400
4
$78,055
1
$109,310
APPLICATIONS APPROVED, NOT ACCEPTED
1
$180,240
2
$234,165
7
$201,603
0
$0
0
$0
1
$149,530
2
$56,120
APPLICATIONS DENIED
4
$235,630
3
$97,617
22
$237,341
4
$56,210
0
$0
2
$151,725
3
$35,463
APPLICATIONS WITHDRAWN
3
$200,227
3
$218,507
11
$258,479
1
$23,760
0
$0
1
$161,600
0
$0
FILES CLOSED FOR INCOMPLETENESS
0
$0
0
$0
3
$154,770
0
$0
0
$0
1
$77,510
0
$0
Aggregated Statistics For Year 2008 (Based on 1 partial tract)
A) FHA, FSA/RHS & VA Home Purchase Loans
B) Conventional Home Purchase Loans
C) Refinancings
D) Home Improvement Loans
F) Non-occupant Loans on < 5 Family Dwellings (A B C & D)
G) Loans On Manufactured Home Dwelling (A B C & D)
Number
Average Value
Number
Average Value
Number
Average Value
Number
Average Value
Number
Average Value
Number
Average Value
LOANS ORIGINATED
14
$265,869
15
$258,796
31
$243,950
5
$92,570
4
$165,160
1
$203,640
APPLICATIONS APPROVED, NOT ACCEPTED
1
$331,600
3
$150,750
7
$230,484
1
$4,750
1
$38,390
2
$75,860
APPLICATIONS DENIED
1
$447,490
4
$170,735
39
$258,742
9
$157,573
3
$168,540
3
$66,417
APPLICATIONS WITHDRAWN
1
$340,740
3
$259,333
14
$205,806
1
$115,160
1
$53,740
0
$0
FILES CLOSED FOR INCOMPLETENESS
1
$214,970
1
$483,320
4
$276,485
1
$76,780
1
$236,910
0
$0
Aggregated Statistics For Year 2007 (Based on 1 partial tract)
A) FHA, FSA/RHS & VA Home Purchase Loans
B) Conventional Home Purchase Loans
C) Refinancings
D) Home Improvement Loans
F) Non-occupant Loans on < 5 Family Dwellings (A B C & D)
G) Loans On Manufactured Home Dwelling (A B C & D)
Number
Average Value
Number
Average Value
Number
Average Value
Number
Average Value
Number
Average Value
Number
Average Value
LOANS ORIGINATED
1
$457,000
52
$249,550
87
$225,458
14
$130,963
9
$211,520
5
$60,178
APPLICATIONS APPROVED, NOT ACCEPTED
0
$0
11
$279,784
16
$226,009
3
$159,037
1
$100,170
4
$70,652
APPLICATIONS DENIED
0
$0
18
$281,654
55
$278,514
13
$158,811
5
$201,154
3
$56,060
APPLICATIONS WITHDRAWN
0
$0
23
$286,328
25
$263,846
3
$153,553
3
$225,453
0
$0
FILES CLOSED FOR INCOMPLETENESS
0
$0
4
$263,415
7
$251,271
1
$154,280
1
$157,210
0
$0
Aggregated Statistics For Year 2006 (Based on 1 partial tract)
B) Conventional Home Purchase Loans
C) Refinancings
D) Home Improvement Loans
F) Non-occupant Loans on < 5 Family Dwellings (A B C & D)
G) Loans On Manufactured Home Dwelling (A B C & D)
Number
Average Value
Number
Average Value
Number
Average Value
Number
Average Value
Number
Average Value
LOANS ORIGINATED
67
$209,085
134
$229,007
27
$129,626
35
$177,891
3
$68,977
APPLICATIONS APPROVED, NOT ACCEPTED
17
$190,112
37
$231,909
2
$128,325
9
$170,654
4
$90,120
APPLICATIONS DENIED
30
$236,068
72
$261,201
18
$143,153
14
$182,904
3
$102,123
APPLICATIONS WITHDRAWN
12
$191,544
62
$271,841
6
$141,670
10
$133,334
0
$0
FILES CLOSED FOR INCOMPLETENESS
3
$170,247
10
$274,785
1
$87,010
3
$174,390
0
$0
Aggregated Statistics For Year 2005 (Based on 1 partial tract)
A) FHA, FSA/RHS & VA Home Purchase Loans
B) Conventional Home Purchase Loans
C) Refinancings
D) Home Improvement Loans
F) Non-occupant Loans on < 5 Family Dwellings (A B C & D)
G) Loans On Manufactured Home Dwelling (A B C & D)
Number
Average Value
Number
Average Value
Number
Average Value
Number
Average Value
Number
Average Value
Number
Average Value
LOANS ORIGINATED
3
$200,350
122
$223,576
150
$203,722
21
$156,407
30
$159,877
3
$67,757
APPLICATIONS APPROVED, NOT ACCEPTED
0
$0
26
$186,330
26
$188,706
3
$211,440
3
$135,517
5
$74,216
APPLICATIONS DENIED
0
$0
41
$180,303
68
$227,048
12
$124,091
17
$183,488
5
$68,952
APPLICATIONS WITHDRAWN
0
$0
28
$222,128
47
$209,372
12
$128,082
4
$148,890
1
$201,080
FILES CLOSED FOR INCOMPLETENESS
1
$232,520
5
$196,474
14
$222,781
0
$0
1
$274,200
0
$0
Aggregated Statistics For Year 2004 (Based on 1 partial tract)
A) FHA, FSA/RHS & VA Home Purchase Loans
B) Conventional Home Purchase Loans
C) Refinancings
D) Home Improvement Loans
F) Non-occupant Loans on < 5 Family Dwellings (A B C & D)
G) Loans On Manufactured Home Dwelling (A B C & D)
Number
Average Value
Number
Average Value
Number
Average Value
Number
Average Value
Number
Average Value
Number
Average Value
LOANS ORIGINATED
1
$255,550
77
$169,828
168
$170,855
15
$89,937
26
$147,745
3
$49,477
APPLICATIONS APPROVED, NOT ACCEPTED
0
$0
15
$146,411
28
$162,300
3
$57,520
4
$119,460
2
$43,870
APPLICATIONS DENIED
0
$0
16
$166,348
56
$159,336
13
$88,082
5
$105,512
5
$74,436
APPLICATIONS WITHDRAWN
1
$98,710
13
$182,209
48
$162,585
9
$108,258
4
$150,445
1
$99,440
FILES CLOSED FOR INCOMPLETENESS
0
$0
3
$164,763
16
$143,269
1
$93,960
3
$113,823
0
$0
Aggregated Statistics For Year 2003 (Based on 1 partial tract)
A) FHA, FSA/RHS & VA Home Purchase Loans
B) Conventional Home Purchase Loans
C) Refinancings
D) Home Improvement Loans
F) Non-occupant Loans on < 5 Family Dwellings (A B C & D)
Number
Average Value
Number
Average Value
Number
Average Value
Number
Average Value
Number
Average Value
LOANS ORIGINATED
12
$138,715
64
$131,382
209
$139,502
7
$67,844
20
$113,684
APPLICATIONS APPROVED, NOT ACCEPTED
1
$36,930
13
$113,927
34
$132,218
3
$61,663
2
$132,165
APPLICATIONS DENIED
0
$0
16
$112,422
70
$140,505
8
$50,041
5
$121,892
APPLICATIONS WITHDRAWN
2
$161,960
11
$160,399
44
$141,628
0
$0
4
$87,470
FILES CLOSED FOR INCOMPLETENESS
0
$0
3
$108,340
9
$135,353
1
$25,590
2
$123,205
Aggregated Statistics For Year 2002 (Based on 1 partial tract)
A) FHA, FSA/RHS & VA Home Purchase Loans
B) Conventional Home Purchase Loans
C) Refinancings
D) Home Improvement Loans
E) Loans on Dwellings For 5+ Families
F) Non-occupant Loans on < 5 Family Dwellings (A B C & D)
Number
Average Value
Number
Average Value
Number
Average Value
Number
Average Value
Number
Average Value
Number
Average Value
LOANS ORIGINATED
20
$120,319
50
$116,590
124
$132,014
8
$38,205
1
$2,361,780
10
$109,972
APPLICATIONS APPROVED, NOT ACCEPTED
2
$140,940
7
$86,960
25
$124,348
3
$27,663
0
$0
2
$70,745
APPLICATIONS DENIED
2
$130,700
18
$102,124
54
$128,860
8
$20,885
0
$0
4
$142,400
APPLICATIONS WITHDRAWN
1
$170,370
6
$157,208
34
$122,723
3
$26,933
0
$0
1
$44,970
FILES CLOSED FOR INCOMPLETENESS
0
$0
1
$176,220
13
$142,753
0
$0
0
$0
1
$90,670
Aggregated Statistics For Year 2001 (Based on 1 partial tract)
A) FHA, FSA/RHS & VA Home Purchase Loans
B) Conventional Home Purchase Loans
C) Refinancings
D) Home Improvement Loans
F) Non-occupant Loans on < 5 Family Dwellings (A B C & D)
Number
Average Value
Number
Average Value
Number
Average Value
Number
Average Value
Number
Average Value
LOANS ORIGINATED
31
$108,630
37
$101,498
78
$110,542
3
$23,277
10
$78,238
APPLICATIONS APPROVED, NOT ACCEPTED
1
$91,400
6
$74,582
15
$94,983
1
$18,280
3
$55,450
APPLICATIONS DENIED
3
$104,073
19
$93,439
50
$106,156
6
$23,582
5
$83,576
APPLICATIONS WITHDRAWN
3
$87,133
9
$112,036
26
$108,738
1
$7,680
2
$123,940
FILES CLOSED FOR INCOMPLETENESS
0
$0
2
$126,315
6
$112,483
0
$0
1
$44,240
Aggregated Statistics For Year 2000 (Based on 1 partial tract)
A) FHA, FSA/RHS & VA Home Purchase Loans
B) Conventional Home Purchase Loans
C) Refinancings
D) Home Improvement Loans
F) Non-occupant Loans on < 5 Family Dwellings (A B C & D)
Number
Average Value
Number
Average Value
Number
Average Value
Number
Average Value
Number
Average Value
LOANS ORIGINATED
26
$108,822
37
$95,056
19
$88,033
7
$32,747
6
$70,378
APPLICATIONS APPROVED, NOT ACCEPTED
1
$104,560
5
$80,286
5
$86,282
2
$56,300
1
$64,710
APPLICATIONS DENIED
2
$72,205
37
$59,899
29
$65,796
7
$17,236
5
$67,198
APPLICATIONS WITHDRAWN
4
$115,712
6
$101,820
12
$70,104
1
$10,970
1
$156,110
FILES CLOSED FOR INCOMPLETENESS
1
$95,060
1
$116,260
3
$111,507
0
$0
2
$83,720
Aggregated Statistics For Year 1999 (Based on 1 partial tract)
A) FHA, FSA/RHS & VA Home Purchase Loans
B) Conventional Home Purchase Loans
C) Refinancings
D) Home Improvement Loans
E) Loans on Dwellings For 5+ Families
F) Non-occupant Loans on < 5 Family Dwellings (A B C & D)
Detailed PMIC statistics for the following Tracts:0086.00
2005 - 2018 National Fire Incident Reporting System (NFIRS) incidents
According to the data from the years 2005 - 2018 the average number of fires per year is 21. The highest number of fires - 44 took place in 2009, and the least - 7 in 2014. The data has a dropping trend.
When looking into fire subcategories, the most incidents belonged to: Outside Fires (47.9%), and Structure Fires (36.3%).
Fire incident types reported to NFIRS in Mentone, CA


 Recent articles from our blog. Our writers, many of them Ph.D. graduates or candidates, create easy-to-read articles on a wide variety of topics.

 (3.0 miles
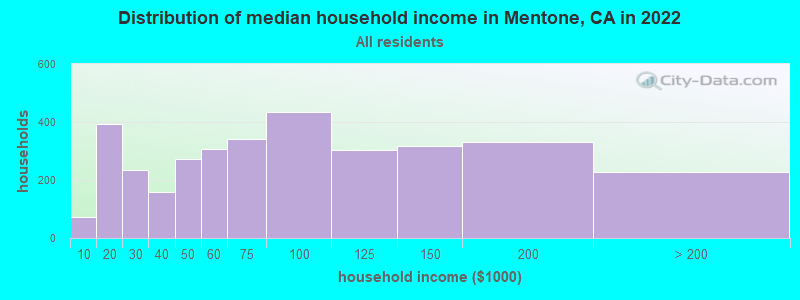


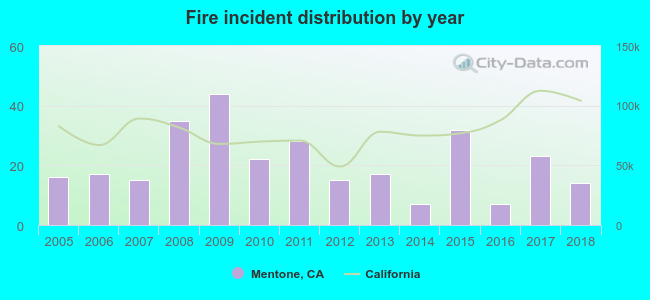 According to the data from the years 2005 - 2018 the average number of fires per year is 21. The highest number of fires - 44 took place in 2009, and the least - 7 in 2014. The data has a dropping trend.
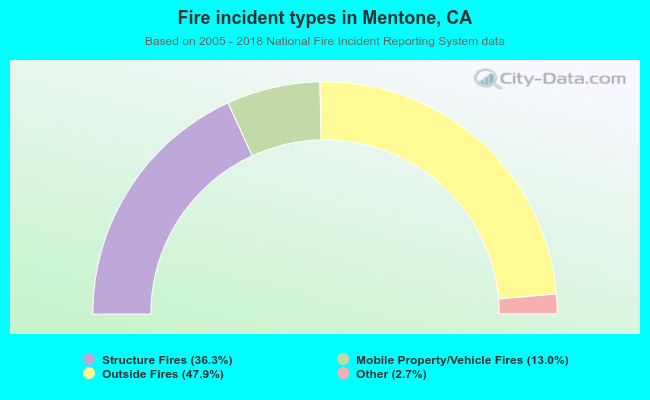 When looking into fire subcategories, the most incidents belonged to: Outside Fires (47.9%), and Structure Fires (36.3%).