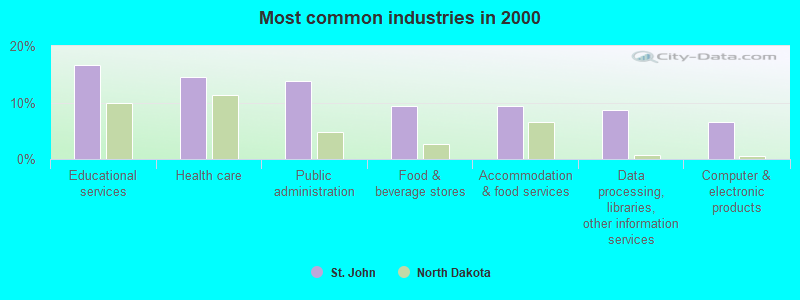
The most common industries in St. John are: Educational services (16.7% of civilian employees), Health care (14.5% of civilian employees), Public administration (13.8% of civilian employees). 92.4% of workers work in Rolette County and 1.0% of all workers work at home. 25.7% of workers are employees of private companies, which is 137.0% less than the rate of 60.9% across the entire state of North Dakota.
Whole page based on the data from 2000 / 2022 when the population of St. John, North Dakota was 358 / 217
Most common industries
Most common industries
Industry
All
Males
Females
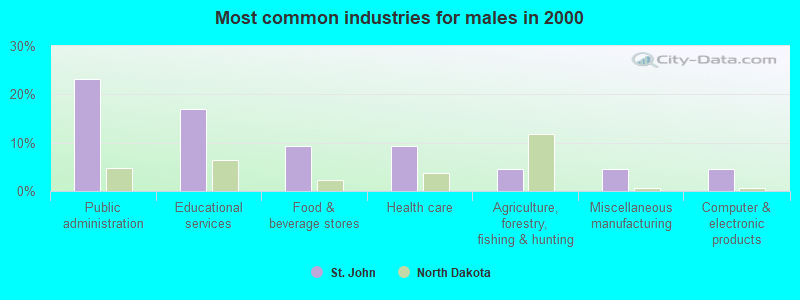
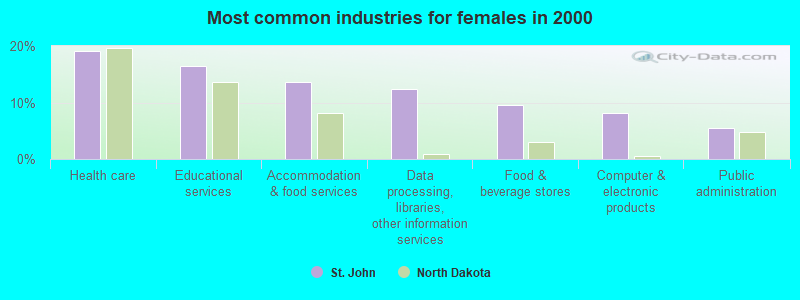
Educational services
16.7% (23)
16.9% (11)
16.4% (12)
Health care
14.5% (20)
9.2% (6)
19.2% (14)
Public administration
13.8% (19)
23.1% (15)
5.5% (4)
Food and beverage stores
9.4% (13)
9.2% (6)
9.6% (7)
Accommodation and food services
9.4% (13)
4.6% (3)
13.7% (10)
Data processing, libraries, and other information services
8.7% (12)
4.6% (3)
12.3% (9)
Computer and electronic products
6.5% (9)
4.6% (3)
8.2% (6)
Finance and insurance
4.3% (6)
3.1% (2)
5.5% (4)
Administrative and support and waste management services
2.9% (4)
0.0% (0)
5.5% (4)
Agriculture, forestry, fishing and hunting
2.2% (3)
4.6% (3)
0.0% (0)
Miscellaneous manufacturing
2.2% (3)
4.6% (3)
0.0% (0)
Mining, quarrying, and oil and gas extraction
1.4% (2)
3.1% (2)
0.0% (0)
Farm supplies merchant wholesalers
1.4% (2)
3.1% (2)
0.0% (0)
Building material and garden equipment and supplies dealers
1.4% (2)
3.1% (2)
0.0% (0)
Social assistance
1.4% (2)
0.0% (0)
2.7% (2)
Repair and maintenance
1.4% (2)
3.1% (2)
0.0% (0)
Religious, grantmaking, civic, professional, and similar organizations
1.4% (2)
3.1% (2)
0.0% (0)
Metal and metal products
0.7% (1)
0.0% (0)
1.4% (1)
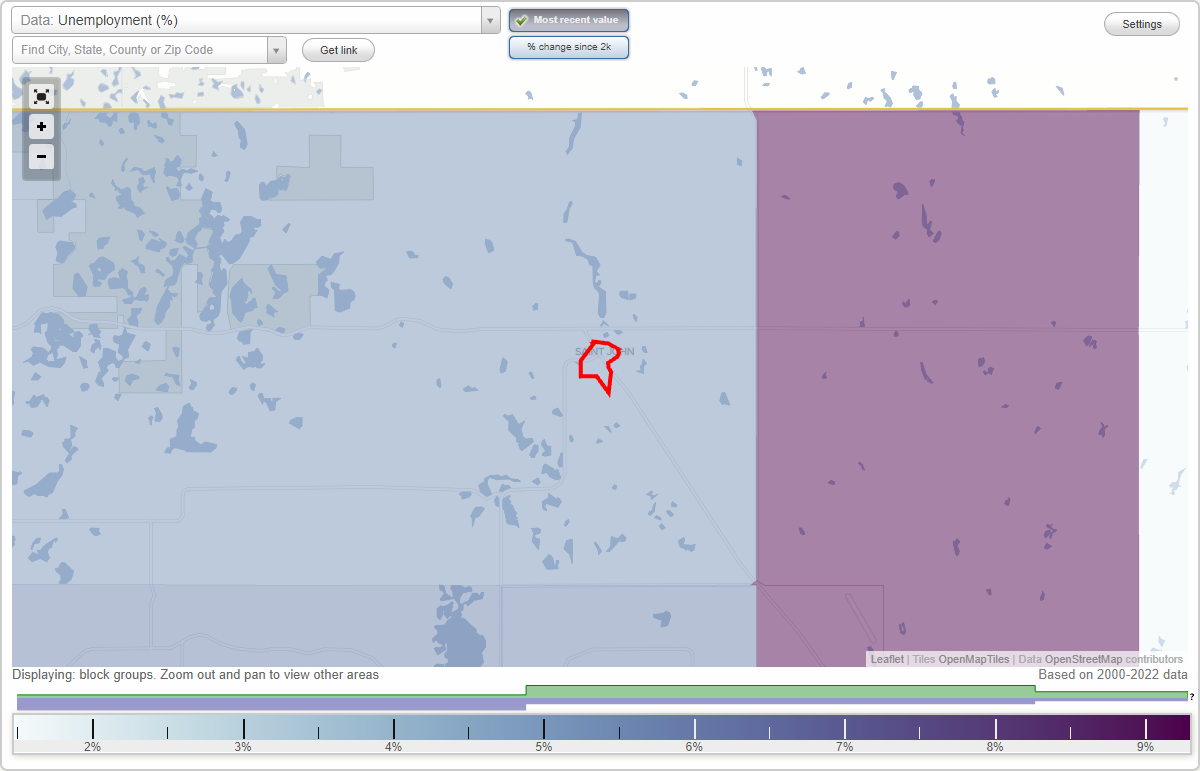
Unemployment in St. John
Unemployment by race in 2022
Unemployment rate for American Indian and Alaska Native residents
8.5%Females
Unemployment by race in 2000
Unemployment rate for White non-Hispanic residents
3.7%Males
6.1%Females
Unemployment rate for American Indian and Alaska Native residents
23.9%Males
Unemployment rate for two or more race residents
28.6%Females
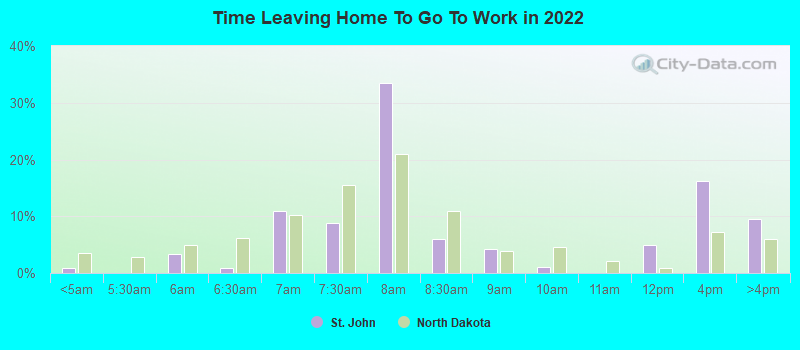
Time leaving home to go to work
12:00 a.m. to 4:59 a.m.:
St. John:
0.9% (1)
North Dakota:
3.6% (13,580)
5:30 a.m. to 5:59 a.m.:
St. John:
3.3% (3)
North Dakota:
5.0% (18,935)
6:00 a.m. to 6:29 a.m.:
St. John:
0.9% (1)
North Dakota:
6.1% (23,161)
6:30 a.m. to 6:59 a.m.:
St. John:
10.9% (11)
North Dakota:
10.3% (38,902)
7:00 a.m. to 7:29 a.m.:
St. John:
8.8% (9)
North Dakota:
15.5% (58,816)
7:30 a.m. to 7:59 a.m.:
St. John:
33.5% (35)
North Dakota:
21.1% (79,708)
8:00 a.m. to 8:29 a.m.:
St. John:
6.0% (6)
North Dakota:
11.0% (41,627)
8:30 a.m. to 8:59 a.m.:
St. John:
4.3% (4)
North Dakota:
3.9% (14,876)
9:00 a.m. to 9:59 a.m.:
St. John:
1.0% (1)
North Dakota:
4.6% (17,538)
11:00 a.m. to 11:59 a.m.:
St. John:
5.0% (5)
North Dakota:
0.9% (3,363)
12:00 p.m. to 3:59 p.m.:
St. John:
16.3% (17)
North Dakota:
7.2% (27,135)
4:00 p.m. to 11:59 p.m.:
St. John:
9.5% (10)
North Dakota:
5.9% (22,410)
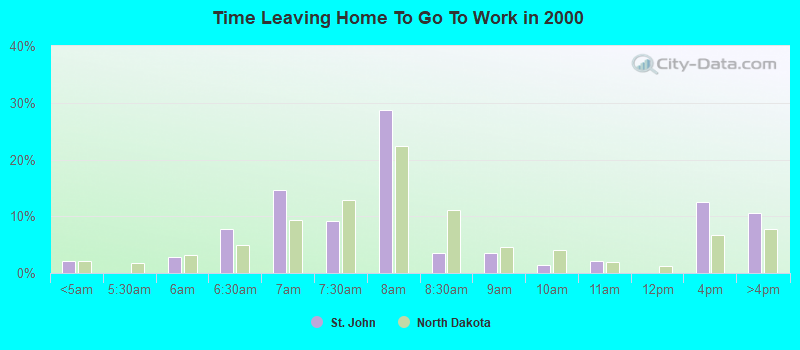
<5am:
St. John:
2.1% (3)
North Dakota:
2.0% (6,522)
6am:
St. John:
2.8% (4)
North Dakota:
3.1% (10,018)
6:30am:
St. John:
7.7% (11)
North Dakota:
5.0% (16,041)
7am:
St. John:
14.7% (21)
North Dakota:
9.3% (29,792)
7:30am:
St. John:
9.1% (13)
North Dakota:
12.9% (41,122)
8am:
St. John:
28.7% (41)
North Dakota:
22.3% (71,367)
8:30am:
St. John:
3.5% (5)
North Dakota:
11.2% (35,640)
9am:
St. John:
3.5% (5)
North Dakota:
4.6% (14,541)
10am:
St. John:
1.4% (2)
North Dakota:
4.1% (13,042)
11am:
St. John:
2.1% (3)
North Dakota:
2.0% (6,297)
4pm:
St. John:
12.6% (18)
North Dakota:
6.7% (21,553)
>4pm:
St. John:
10.5% (15)
North Dakota:
7.8% (24,981)
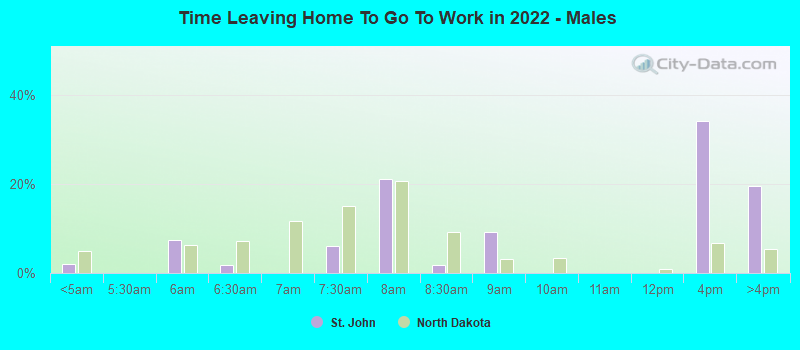
12:00 a.m. to 4:59 a.m. - Males:
St. John:
2.1% (1)
North Dakota:
4.9% (10,250)
5:30 a.m. to 5:59 a.m. - Males:
St. John:
7.3% (4)
North Dakota:
6.2% (12,896)
6:00 a.m. to 6:29 a.m. - Males:
St. John:
1.7% (1)
North Dakota:
7.3% (15,114)
7:00 a.m. to 7:29 a.m. - Males:
St. John:
6.1% (3)
North Dakota:
15.1% (31,484)
7:30 a.m. to 7:59 a.m. - Males:
St. John:
21.1% (10)
North Dakota:
20.6% (42,894)
8:00 a.m. to 8:29 a.m. - Males:
St. John:
1.9% (1)
North Dakota:
9.1% (18,980)
8:30 a.m. to 8:59 a.m. - Males:
St. John:
9.1% (4)
North Dakota:
3.2% (6,661)
12:00 p.m. to 3:59 p.m. - Males:
St. John:
34.2% (17)
North Dakota:
6.7% (13,967)
4:00 p.m. to 11:59 p.m. - Males:
St. John:
19.5% (10)
North Dakota:
5.3% (11,113)
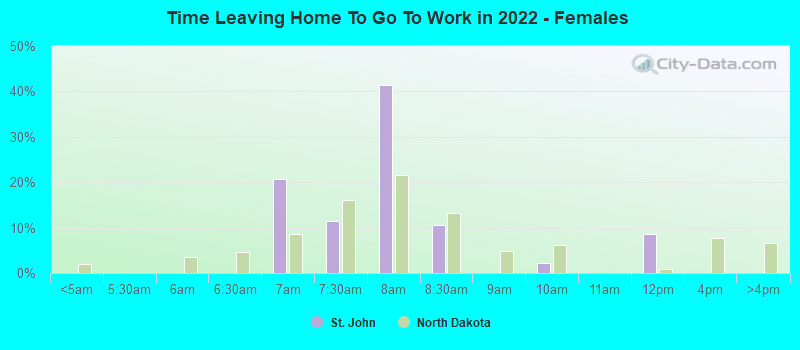
6:30 a.m. to 6:59 a.m. - Females:
St. John:
20.8% (11)
North Dakota:
8.6% (14,678)
7:00 a.m. to 7:29 a.m. - Females:
St. John:
11.4% (6)
North Dakota:
16.0% (27,332)
7:30 a.m. to 7:59 a.m. - Females:
St. John:
41.3% (23)
North Dakota:
21.6% (36,814)
8:00 a.m. to 8:29 a.m. - Females:
St. John:
10.5% (6)
North Dakota:
13.3% (22,647)
9:00 a.m. to 9:59 a.m. - Females:
St. John:
2.1% (1)
North Dakota:
6.2% (10,515)
11:00 a.m. to 11:59 a.m. - Females:
St. John:
8.7% (5)
North Dakota:
1.0% (1,675)
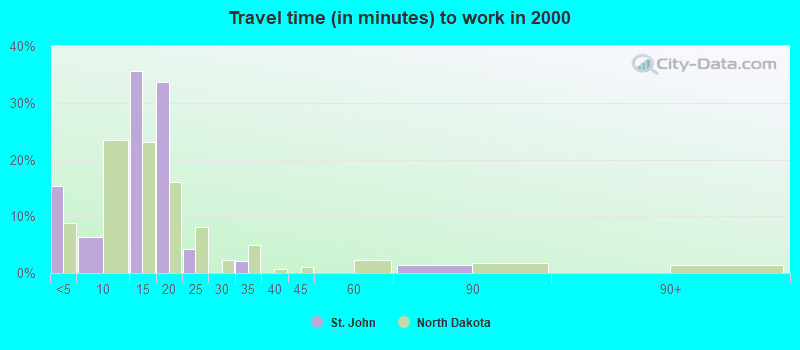
Travel time to work
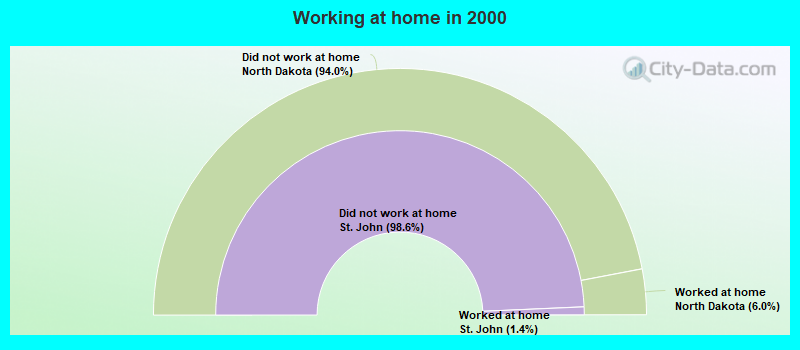
Percentage of workers working in this county: 92.4% Number of people working at home: 1 (1.0% of all workers)
Less than 5 minutes:
St. John:
15.4% (22)
North Dakota:
8.8% (28,174)
5 to 9 minutes:
St. John:
6.3% (9)
North Dakota:
23.4% (74,872)
10 to 14 minutes:
St. John:
35.7% (51)
North Dakota:
23.1% (73,827)
15 to 19 minutes:
St. John:
33.6% (48)
North Dakota:
16.0% (51,229)
20 to 24 minutes:
St. John:
4.2% (6)
North Dakota:
8.2% (26,094)
30 to 34 minutes:
St. John:
2.1% (3)
North Dakota:
4.9% (15,622)
60 to 89 minutes:
St. John:
1.4% (2)
North Dakota:
1.8% (5,644)
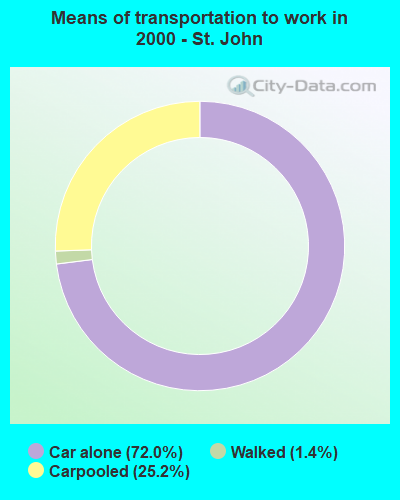
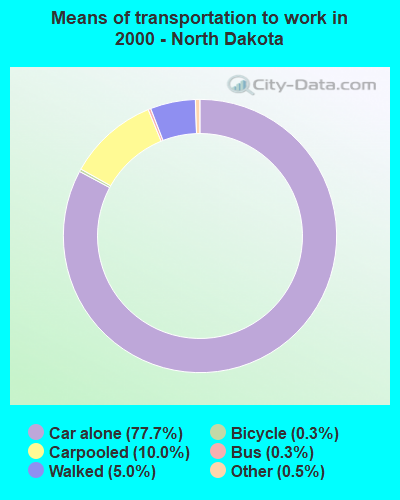
Means of transportation to work
Drove car alone:
St. John:
72.0% (103)
North Dakota:
77.7% (248,277)
Carpooled:
St. John:
25.2% (36)
North Dakota:
10.0% (32,005)
Walked:
St. John:
1.4% (2)
North Dakota:
5.0% (16,094)
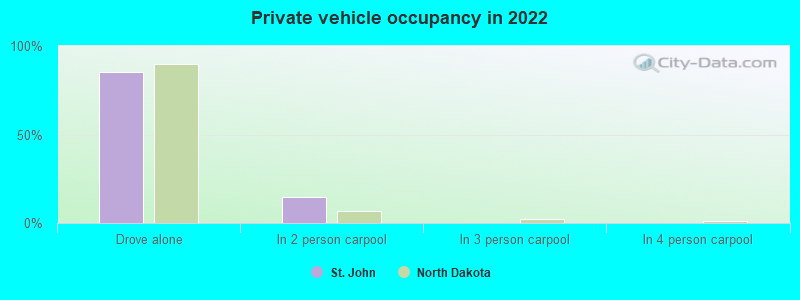
Private vehicle occupancy
Drove alone:
St. John:
85.1% (89)
North Dakota:
90.0% (322,810)
In 2 person carpool:
St. John:
14.4% (15)
North Dakota:
6.8% (24,403)
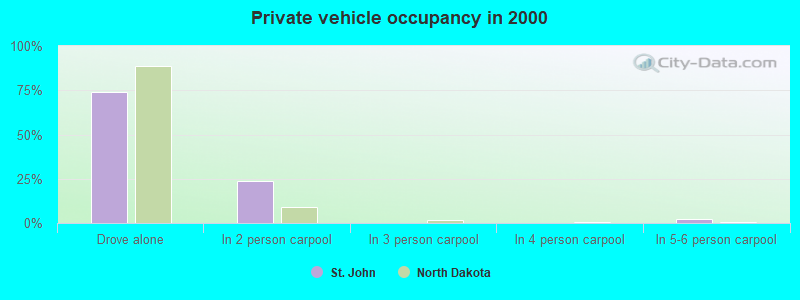
Drove alone:
St. John:
74.1% (103)
North Dakota:
88.6% (248,277)
In 2 person carpool:
St. John:
23.7% (33)
North Dakota:
8.8% (24,655)
In 5-6 person carpool:
St. John:
2.2% (3)
North Dakota:
0.3% (814)
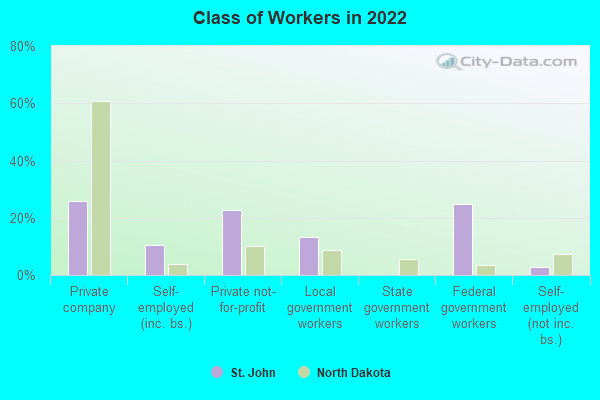
Class of workers
Employee of private company:
St. John:
25.7% (27)
North Dakota:
60.9% (248,963)
Self-employed in own incorporated business:
St. John:
10.5% (11)
North Dakota:
3.7% (15,272)
Private not-for-profit wage and salary workers:
St. John:
22.9% (24)
North Dakota:
10.2% (41,742)
Local government workers:
St. John:
13.3% (14)
North Dakota:
8.7% (35,547)
Federal government workers:
St. John:
24.8% (26)
North Dakota:
3.3% (13,675)
Self-employed workers in own not incorporated business:
St. John:
2.9% (3)
North Dakota:
7.4% (30,119)
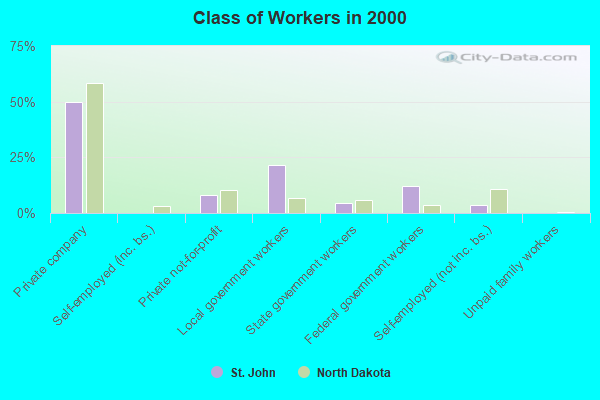
Employee of private company:
St. John:
50.0% (69)
North Dakota:
58.5% (185,338)
Private not-for-profit wage and salary workers:
St. John:
8.0% (11)
North Dakota:
10.5% (33,309)
Local government workers:
St. John:
21.7% (30)
North Dakota:
7.0% (22,008)
State government workers:
St. John:
4.3% (6)
North Dakota:
6.0% (18,962)
Federal government workers:
St. John:
12.3% (17)
North Dakota:
3.5% (11,117)
Self-employed workers in own not incorporated business:
St. John:
3.6% (5)
North Dakota:
10.7% (33,950)
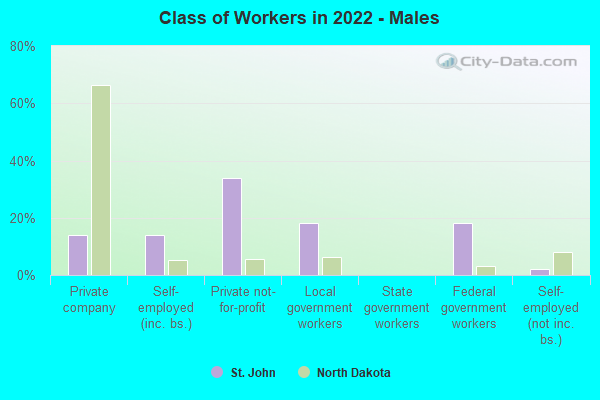
Employee of private company - Males:
St. John:
14.0% (7)
North Dakota:
66.5% (145,704)
Self-employed in own incorporated business - Males:
St. John:
14.0% (7)
North Dakota:
5.3% (11,614)
Private not-for-profit wage and salary workers - Males:
St. John:
34.0% (17)
North Dakota:
5.7% (12,562)
Local government workers - Males:
St. John:
18.0% (9)
North Dakota:
6.2% (13,550)
Federal government workers - Males:
St. John:
18.0% (9)
North Dakota:
3.2% (6,977)
Self-employed workers in own not incorporated business - Males:
St. John:
2.0% (1)
North Dakota:
8.0% (17,517)
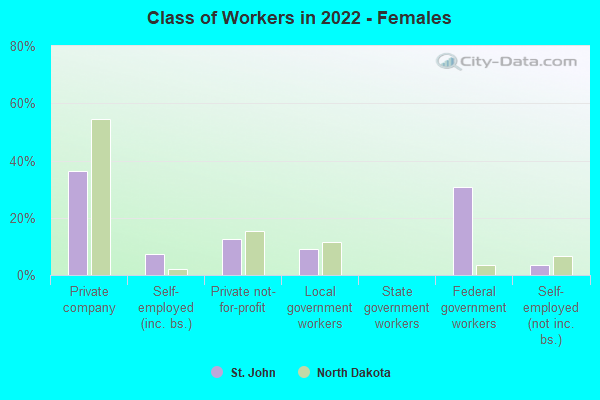
Employee of private company - Females:
St. John:
36.4% (20)
North Dakota:
54.5% (103,259)
Self-employed in own incorporated business - Females:
St. John:
7.3% (4)
North Dakota:
1.9% (3,658)
Private not-for-profit wage and salary workers - Females:
St. John:
12.7% (7)
North Dakota:
15.4% (29,180)
Local government workers - Females:
St. John:
9.1% (5)
North Dakota:
11.6% (21,997)
Federal government workers - Females:
St. John:
30.9% (17)
North Dakota:
3.5% (6,698)
Self-employed workers in own not incorporated business - Females:
St. John:
3.6% (2)
North Dakota:
6.7% (12,602)
Discuss St. John, North Dakota (ND) on our hugely popular North Dakota forum.