Estimated zip code population in 2022: 6,094 Zip code population in 2010: 6,227 Zip code population in 2000: 6,139
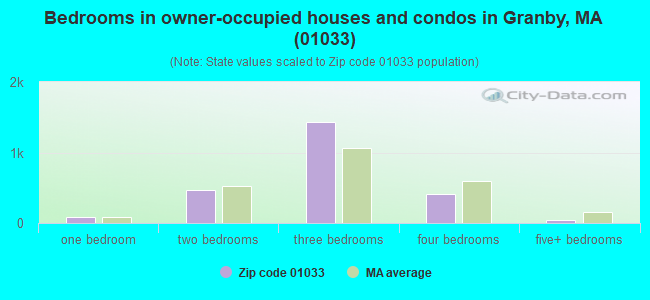
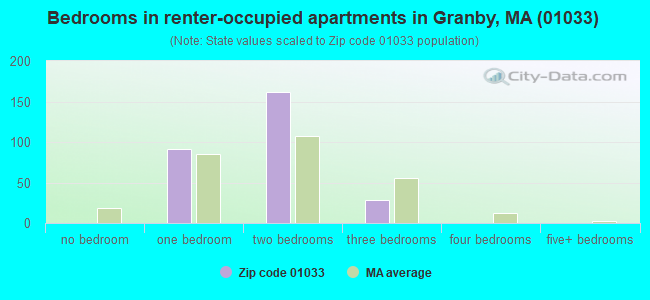
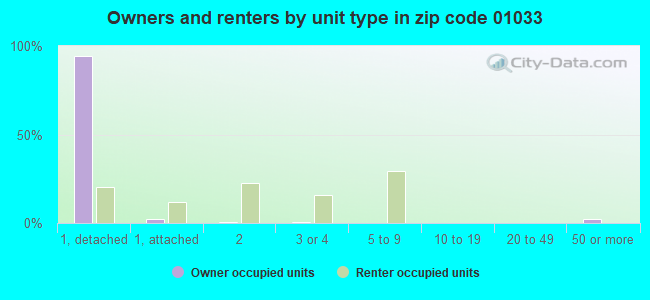
Houses and condos: 2,818 Renter-occupied apartments: 284
% of renters here:
10%
State:
38%
March 2022 cost of living index in zip code 01033: 105.3 (more than average, U.S. average is 100)
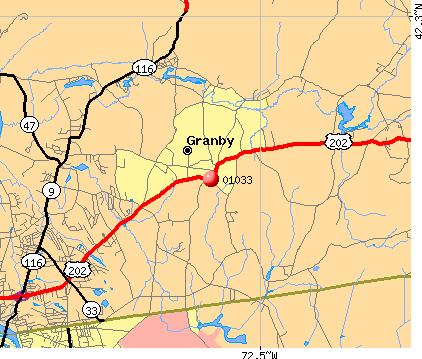
Land area: 27.8 sq. mi. Water area: 0.3 sq. mi.
Population density: 219 people per square mile
(very low).
OSM Map
Google Map
MSN Map
OSM Map
General Map
Google Map
MSN Map
OSM Map
Google Map
MSN Map
OSM Map
Google Map
MSN Map
Please wait while loading the map...
Real estate property taxes paid for housing units in 2022:
This zip code:
1.5% ($4,953)
Massachusetts:
1.0% ($5,536)
Median real estate property taxes paid for housing units with mortgages in 2022: $5,315 (1.5%) Median real estate property taxes paid for housing units with no mortgage in 2022: $4,613 (1.5%)
Business Search- 14 Million verified businesses
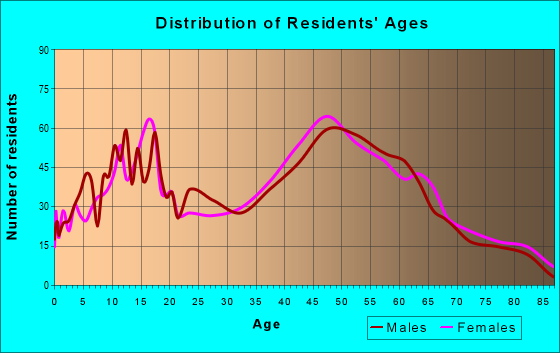
Males: 3,032
(49.8%)
Females: 3,061
(50.2%)
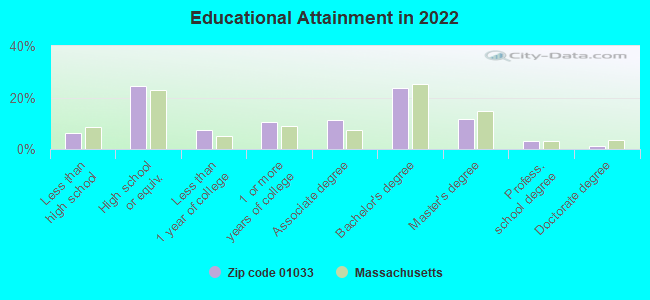
For population 25 years and over in 01033:
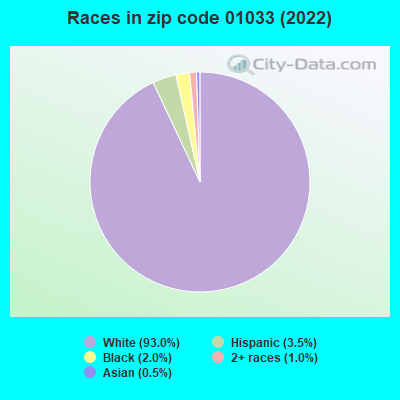
High school or higher: 93.0%
Bachelor's degree or higher: 39.6%
Graduate or professional degree: 15.9%
Unemployed: 2.6%
Mean travel time to work (commute): 22.1 minutes
For population 15 years and over in 01033:
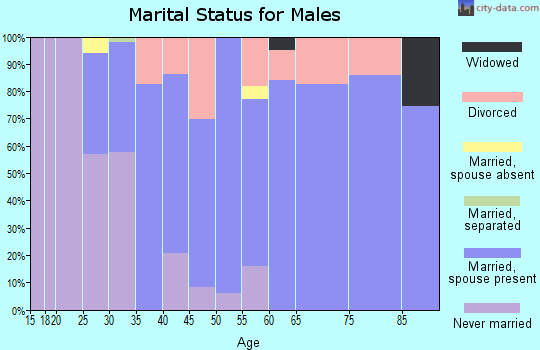
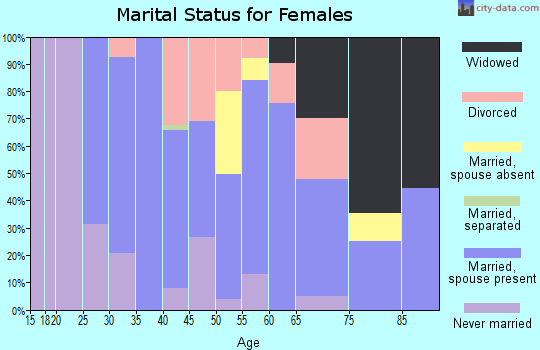
Never married: 19.1%
Now married: 63.2%
Separated: 1.7%
Widowed: 7.1%
Divorced: 8.7%
Zip code 01033 compared to state average:
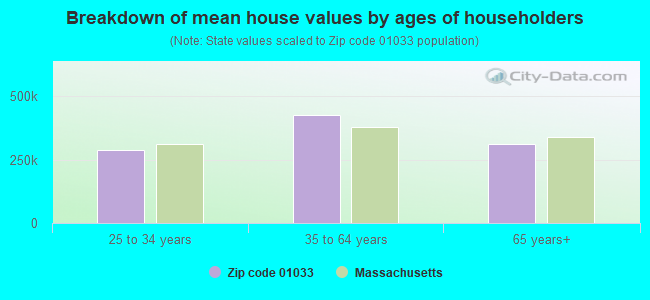
Median house value below state average.
Black race population percentage significantly below state average.
Hispanic race population percentage significantly below state average.
Median age significantly above state average.
Foreign-born population percentage significantly below state average.
Renting percentage significantly below state average.
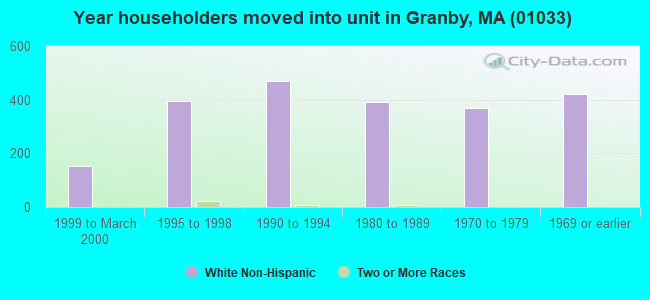
Length of stay since moving in significantly above state average.
Estimated median house/condo value in 2022: $330,279
01033:
$330,279
Massachusetts:
$534,700
According to our research of Massachusetts and other state lists, there were 2 registered sex offenders living in 01033 zip code as of April 27, 2024. The ratio of all residents to sex offenders in zip code 01033 is 3,200 to 1. The ratio of registered sex offenders to all residents in this zip code is lower than the state average.
Median resident age:
This zip code:
48.9 years
Massachusetts median age:
40.3 years
Average household size:
This zip code:
2.2 people
Massachusetts:
2.4 people
Averages for the 2020 tax year for zip code 01033, filed in 2021:
Average Adjusted Gross Income (AGI) in 2020: $78,454 (Individual Income Tax Returns)
Here:
$78,454
State:
$105,130
Salary/wage: $64,941 (reported on 81.0% of returns)
Here:
$64,941
State:
$82,951
(% of AGI for various income ranges: 1169.4% for AGIs below $25k, 3511.3% for AGIs $25k-50k, 5814.3% for AGIs $50k-75k, 9507.6% for AGIs $75k-100k, 17850.5% for AGIs $100k-200k, 53021.4% for AGIs over 200k)
Taxable interest for individuals: $1,079 (reported on 44.2% of returns)
This zip code:
$1,079
Massachusetts:
$2,361
(% of AGI for various income ranges: 17.4% for AGIs below $25k, 23.9% for AGIs $25k-50k, 76.8% for AGIs $50k-75k, 69.2% for AGIs $75k-100k, 149.2% for AGIs $100k-200k, 494.3% for AGIs over 200k)
Ordinary dividends: $2,725 (reported on 22.8% of returns)
Here:
$2,725
State:
$10,365
(% of AGI for various income ranges: 19.4% for AGIs below $25k, 58.3% for AGIs $25k-50k, 91.6% for AGIs $50k-75k, 80.0% for AGIs $75k-100k, 163.8% for AGIs $100k-200k, 714.3% for AGIs over 200k)
Net capital gain/loss in AGI: +$27,309 (reported on 19.3% of returns)
Here:
+$27,309
State:
+$48,178
(% of AGI for various income ranges: 13.0% for AGIs below $25k, 13.5% for AGIs $25k-50k, 120.8% for AGIs $50k-75k, 241.6% for AGIs $75k-100k, 550.3% for AGIs $100k-200k, 20587.1% for AGIs over 200k)
Profit/loss from business: +$16,771 (reported on 15.1% of returns)
Here:
+$16,771
State:
+$20,792
(% of AGI for various income ranges: 73.0% for AGIs below $25k, 186.1% for AGIs $25k-50k, 274.9% for AGIs $50k-75k, 429.6% for AGIs $75k-100k, 842.3% for AGIs $100k-200k, 2540.0% for AGIs over 200k)
Taxable individual retirement arrangement distribution: $17,049 (reported on 12.2% of returns)
01033:
$17,049
Massachusetts:
$22,790
(% of AGI for various income ranges: 89.8% for AGIs below $25k, 132.8% for AGIs $25k-50k, 276.8% for AGIs $50k-75k, 416.8% for AGIs $75k-100k, 685.4% for AGIs $100k-200k, 1498.6% for AGIs over 200k)
Self-employed (Keogh) retirement plans: $21,700 (reported on 0.6% of returns)
01033:
$21,700
Massachusetts:
$26,868
(% of AGI for various income ranges: 80.4% for AGIs $25k-50k)
Total itemized deductions: $27,158 (reported on 7.1% of returns)
Here:
$27,158
State:
$36,722
(% of AGI for various income ranges: 151.9% for AGIs $25k-50k, 264.9% for AGIs $50k-75k, 490.8% for AGIs $75k-100k, 480.0% for AGIs $100k-200k, 2312.9% for AGIs over 200k)
Charity contributions: $3,593 (reported on 4.5% of returns)
Here:
$3,593
State:
$12,529
(% of AGI for various income ranges: 7.8% for AGIs below $25k, 13.8% for AGIs $50k-75k, 34.8% for AGIs $75k-100k, 51.5% for AGIs $100k-200k, 225.7% for AGIs over 200k)
Taxes paid: $8,283 (reported on 7.1% of returns)
01033:
$8,283
State:
$8,782
(% of AGI for various income ranges: 44.8% for AGIs $25k-50k, 96.5% for AGIs $50k-75k, 180.8% for AGIs $75k-100k, 149.7% for AGIs $100k-200k, 504.3% for AGIs over 200k)
Earned income credit: $1,788 (reported on 7.1% of returns)
Here:
$1,788
State:
$1,909
(% of AGI for various income ranges: 45.0% for AGIs below $25k, 34.4% for AGIs $25k-50k)
Percentage of individuals using paid preparers for their 2020 taxes: 91.1%
Here:
91%
State:
92%
(% for various income ranges: 87.4% for AGIs below $25k, 91.9% for AGIs $25k-50k, 92.3% for AGIs $50k-75k, 89.7% for AGIs $75k-100k, 94.0% for AGIs $100k-200k, 94.4% for AGIs over 200k)
Averages for the 2012 tax year for zip code 01033, filed in 2013:
Average Adjusted Gross Income (AGI) in 2012: $57,959 (Individual Income Tax Returns)
Here:
$57,959
State:
$81,425
Salary/wage: $52,303 (reported on 85.9% of returns)
Here:
$52,303
State:
$64,752
(% of AGI for various income ranges: 71.1% for AGIs below $25k, 77.3% for AGIs $25k-50k, 75.9% for AGIs $50k-75k, 79.6% for AGIs $75k-100k, 82.3% for AGIs $100k-200k, 64.6% for AGIs over 200k)
Taxable interest for individuals: $804 (reported on 46.9% of returns)
This zip code:
$804
Massachusetts:
$2,136
(% of AGI for various income ranges: 1.3% for AGIs below $25k, 0.8% for AGIs $25k-50k, 0.8% for AGIs $50k-75k, 0.4% for AGIs $75k-100k, 0.6% for AGIs $100k-200k, 0.4% for AGIs over 200k)
Ordinary dividends: $2,506 (reported on 21.2% of returns)
Here:
$2,506
State:
$9,473
(% of AGI for various income ranges: 1.5% for AGIs below $25k, 0.9% for AGIs $25k-50k, 0.9% for AGIs $50k-75k, 0.6% for AGIs $75k-100k, 0.9% for AGIs $100k-200k, 1.2% for AGIs over 200k)
Net capital gain/loss in AGI: +$3,511 (reported on 14.1% of returns)
Here:
+$3,511
State:
+$31,437
(% of AGI for various income ranges: 0.1% for AGIs below $25k, 0.1% for AGIs $25k-50k, 0.3% for AGIs $50k-75k, 0.3% for AGIs $75k-100k, 1.4% for AGIs $100k-200k, 2.5% for AGIs over 200k)
Profit/loss from business: +$15,970 (reported on 14.4% of returns)
Here:
+$15,970
State:
+$20,662
(% of AGI for various income ranges: 4.5% for AGIs below $25k, 4.8% for AGIs $25k-50k, 5.4% for AGIs $50k-75k, 2.7% for AGIs $75k-100k, 3.3% for AGIs $100k-200k, 4.5% for AGIs over 200k)
Taxable individual retirement arrangement distribution: $11,653 (reported on 11.0% of returns)
01033:
$11,653
Massachusetts:
$18,892
(% of AGI for various income ranges: 4.3% for AGIs below $25k, 2.2% for AGIs $25k-50k, 2.0% for AGIs $50k-75k, 2.6% for AGIs $75k-100k, 2.4% for AGIs $100k-200k)
Self-employment retirement plans: $18,850 (reported on 0.6% of returns)
01033:
$18,850
Massachusetts:
$20,669
Total itemized deductions: $19,210 (21% of AGI, reported on 41.4% of returns)
Here:
$19,210
State:
$28,907
Here:
20.7% of AGI
State:
18.2% of AGI
(% of AGI for various income ranges: 12.3% for AGIs below $25k, 11.3% for AGIs $25k-50k, 14.1% for AGIs $50k-75k, 13.4% for AGIs $75k-100k, 15.1% for AGIs $100k-200k, 13.2% for AGIs over 200k)
Charity contributions: $1,779 (reported on 33.1% of returns)
Here:
$1,779
State:
$4,208
(% of AGI for various income ranges: 0.6% for AGIs below $25k, 0.8% for AGIs $25k-50k, 1.0% for AGIs $50k-75k, 1.1% for AGIs $75k-100k, 1.2% for AGIs $100k-200k, 1.0% for AGIs over 200k)
Taxes paid: $8,668 (reported on 41.4% of returns)
01033:
$8,668
State:
$13,303
(% of AGI for various income ranges: 3.2% for AGIs below $25k, 4.2% for AGIs $25k-50k, 5.6% for AGIs $50k-75k, 6.0% for AGIs $75k-100k, 7.7% for AGIs $100k-200k, 7.2% for AGIs over 200k)
Earned income credit: $1,821 (reported on 8.6% of returns)
Here:
$1,821
State:
$1,971
(% of AGI for various income ranges: 2.8% for AGIs below $25k, 0.6% for AGIs $25k-50k)
Percentage of individuals using paid preparers for their 2012 taxes: 54.3%
Here:
54%
State:
56%
(% for various income ranges: 46.2% for AGIs below $25k, 54.1% for AGIs $25k-50k, 58.5% for AGIs $50k-75k, 56.4% for AGIs $75k-100k, 62.0% for AGIs $100k-200k, 83.3% for AGIs over 200k)
Averages for the 2004 tax year for zip code 01033, filed in 2005:
Average Adjusted Gross Income (AGI) in 2004: $50,551 (Individual Income Tax Returns)
Here:
$50,551
State:
$62,877
Salary/wage: $44,491 (reported on 87.3% of returns)
Here:
$44,491
State:
$52,969
(% of AGI for various income ranges: 90.4% for AGIs below $10k, 71.7% for AGIs $10k-25k, 79.8% for AGIs $25k-50k, 84.7% for AGIs $50k-75k, 86.2% for AGIs $75k-100k, 63.0% for AGIs over 100k)
Taxable interest for individuals: $1,148 (reported on 59.7% of returns)
This zip code:
$1,148
Massachusetts:
$1,945
(% of AGI for various income ranges: 4.1% for AGIs below $10k, 2.3% for AGIs $10k-25k, 1.1% for AGIs $25k-50k, 0.8% for AGIs $50k-75k, 0.9% for AGIs $75k-100k, 1.9% for AGIs over 100k)
Taxable dividends: $1,357 (reported on 27.2% of returns)
Here:
$1,357
State:
$5,323
(% of AGI for various income ranges: 2.7% for AGIs below $10k, 1.4% for AGIs $10k-25k, 0.8% for AGIs $25k-50k, 0.4% for AGIs $50k-75k, 0.3% for AGIs $75k-100k, 0.9% for AGIs over 100k)
Net capital gain/loss: +$9,020 (reported on 19.4% of returns)
Here:
+$9,020
State:
+$20,377
(% of AGI for various income ranges: -1.2% for AGIs below $10k, 0.8% for AGIs $10k-25k, 0.7% for AGIs $25k-50k, 0.7% for AGIs $50k-75k, 1.3% for AGIs $75k-100k, 9.4% for AGIs over 100k)
Profit/loss from business: +$15,772 (reported on 15.1% of returns)
Here:
+$15,772
State:
+$17,837
(% of AGI for various income ranges: -7.0% for AGIs below $10k, 6.1% for AGIs $10k-25k, 5.8% for AGIs $25k-50k, 3.0% for AGIs $50k-75k, 3.1% for AGIs $75k-100k, 6.6% for AGIs over 100k)
IRA payment deduction: $3,062 (reported on 4.3% of returns)
01033:
$3,062
Massachusetts:
$3,100
(% of AGI for various income ranges: 0.3% for AGIs $10k-25k, 0.5% for AGIs $25k-50k, 0.3% for AGIs $50k-75k, 0.2% for AGIs $75k-100k, 0.1% for AGIs over 100k)
Self-employed pension: $10,256 (reported on 1.3% of returns)
Here:
$10,256
Massachusetts:
$14,516
(% of AGI for various income ranges: 0.3% for AGIs $10k-25k, 0.2% for AGIs $50k-75k, 0.7% for AGIs over 100k)
Total itemized deductions: $15,427 (20% of AGI, reported on 44.6% of returns)
Here:
$15,427
State:
$22,573
Here:
19.7% of AGI
State:
19.5% of AGI
(% of AGI for various income ranges: 6.8% for AGIs below $10k, 12.1% for AGIs $10k-25k, 13.2% for AGIs $25k-50k, 16.0% for AGIs $50k-75k, 14.9% for AGIs $75k-100k, 11.7% for AGIs over 100k)
Charity contributions deductions: $1,492 (2% of AGI, reported on 40.1% of returns)
Here:
$1,492
State:
$3,295
Here:
1.8% of AGI
State:
2.7% of AGI
(% of AGI for various income ranges: 0.4% for AGIs below $10k, 0.9% for AGIs $10k-25k, 1.0% for AGIs $25k-50k, 1.3% for AGIs $50k-75k, 1.3% for AGIs $75k-100k, 1.3% for AGIs over 100k)
Total tax: $6,668 (reported on 83.9% of returns)
01033:
$6,668
State:
$11,494
(% of AGI for various income ranges: 2.7% for AGIs below $10k, 4.9% for AGIs $10k-25k, 7.9% for AGIs $25k-50k, 8.6% for AGIs $50k-75k, 10.7% for AGIs $75k-100k, 16.7% for AGIs over 100k)
Earned income credit: $1,338 (reported on 7.9% of returns)
Here:
$1,338
State:
$1,518
Percentage of individuals using paid preparers for their 2004 taxes: 57.4%
Here:
57%
State:
58%
(% for various income ranges: 44.7% for AGIs below $10k, 54.9% for AGIs $10k-25k, 58.1% for AGIs $25k-50k, 59.5% for AGIs $50k-75k, 60.6% for AGIs $75k-100k, 73.5% for AGIs over 100k)
Likely homosexual households (counted as self-reported same-sex unmarried-partner households)
Lesbian couples: 0.5% of all households
Gay men: 0.0% of all households
Household received Food Stamps/SNAP in the past 12 months: 153 Household did not receive Food Stamps/SNAP in the past 12 months: 2,537
Women who had a birth in the past 12 months: 35 (36 now married, 0 unmarried) Women who did not have a birth in the past 12 months: 1,211 (726 now married, 467 unmarried)
Housing units in zip code 01033 with a mortgage: 1,651 (168 second mortgage, 171 both second mortgage and home equity loan) Houses without a mortgage: 183
Median monthly owner costs for units with a mortgage: $2,119 Median monthly owner costs for units without a mortgage: $795
Residents with income below the poverty level in 2022:
This zip code:
5.0%
Whole state:
10.4%
Residents with income below 50% of the poverty level in 2022:
This zip code:
4.1%
Whole state:
5.1%
Median number of rooms in houses and condos:
Here:
6.3
State:
6.5
Median number of rooms in apartments:
Here:
4.0
State:
4.0
Notable locations in this zip code not listed on our city pages
Notable locations in zip code 01033: Dickinson Farms (A), Boy Scout Camp (B), Sportsman Club (C), Rod and Gun Club (D), Kolbe Memorial Library (E), Granby Fire Department (F), Granby Townhall (G), Granby Junior-Senior High School Library Media Center (H), Granby Free Public Library (I). Display/hide their locations on the map
Churches in zip code 01033 include: Immaculate Heart of Mary Church (A), Church of Christ (B), Living Gate Evangelical Free Church (C). Display/hide their locations on the map
Reservoirs and swamps: Aldrich Lake (A), Hopkinton Reservoir (B), Forge Pond (C), Bachelor Brook Reservoir (D), Pitchawam Swamp (E), Porter Swamp (F). Display/hide their locations on the map
In group quarters: 5 (-1 institutionalized population)
Size of family households: 1,124 2-persons, 350 3-persons, 399 4-persons, 102 5-persons, 47 6-persons, 7 7-or-more-persons
Size of nonfamily households: 625 1-person, 60 2-persons, 12 3-persons
654 married couples with children.
134 single-parent households (70 men, 64 women).
91.0% of residents of 01033 zip code speak English at home.
2.3% of residents speak Spanish at home (100% very well).
5.6% of residents speak other Indo-European language at home (77% very well, 10% well, 14% not well).
0.3% of residents speak Asian or Pacific Island language at home (100% very well).
0.3% of residents speak other language at home (100% very well).
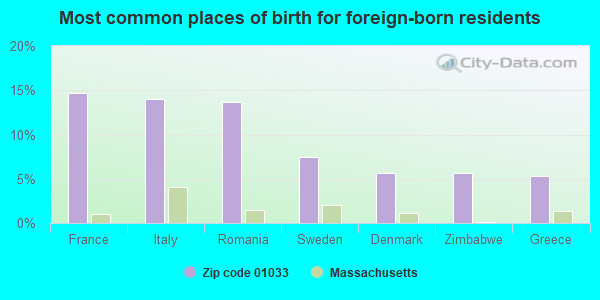
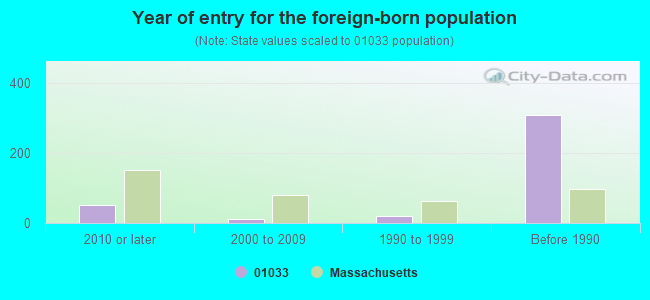
Foreign born population: 322 (5.3%) (69.1% of them are naturalized citizens)
This zip code:
5.3%
Whole state:
18.0%
15%France
14%Italy
14%Romania
7%Sweden
6%Denmark
6%Zimbabwe
5%Greece
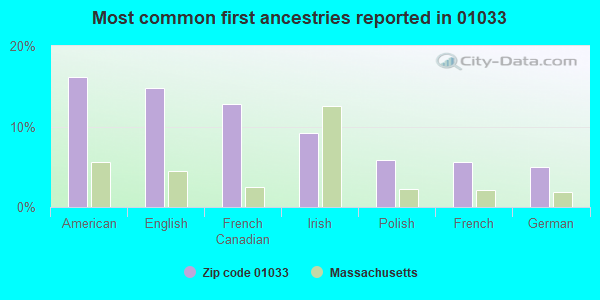
16%American
15%English
13%French Canadian
9%Irish
6%Polish
6%French
5%German
Year of entry for the foreign-born population
512010 or later
122000 to 2009
201990 to 1999
309Before 1990
Facilities with environmental interests located in this zip code:
EAST MEADOW SCHOOL (393 EAST STATE ST in GRANBY, MA)
(National Center for Education Statistics) - STATE ID-111004 Organizations: GRANBY (SCHOOL DISTRICT)
LANE CONSTRUCTION CORP (NEW LUDLOW ROAD in GRANBY, MA)
AIR SYNTHETIC MINOR (AIRS/AFS) CRITERIA AND HAZARDOUS AIR POLLUTANT INVENTORY (Inventory of air pollution sources) Conditionally Exempt Small Quantity Generators, less than 100 kg/month of hazardous waste (Resource Conservation and Recovery Act (tracking hazardous waste)) - notification Business SIC classification: ASPHALT PAVING MIXTURES AND BLOCKS
BOBS AUTO BODY (39 WEST STATE ST in GRANBY, MA)
Conditionally Exempt Small Quantity Generators, less than 100 kg/month of hazardous waste (Resource Conservation and Recovery Act (tracking hazardous waste)) - notification Organizations: ROBERT J AHERN (CONTACT/OWNER)
NUTTINGS AUTO WRECKERS INC (113 SCHOOL ST in GRANBY, MA)
(Resource Conservation and Recovery Act (tracking hazardous waste))
DRESSELS SERVICE STATION (161 WEST STATE ST in GRANBY, MA)
Conditionally Exempt Small Quantity Generators, less than 100 kg/month of hazardous waste (Resource Conservation and Recovery Act (tracking hazardous waste)) - notification Organizations: MERRILL MARTIN A (CONTACT/OWNER)
KELLOG HALL (250 STATE ST in GRANBY, MA)
AIR MINOR (AIRS/AFS) Business SIC classification: GENERAL GOVERNMENT Alternative names: GRANBY
MA ELEC CO GRANBY SERV CTR (EAST STATE ST in GRANBY, MA)
(Resource Conservation and Recovery Act (tracking hazardous waste))
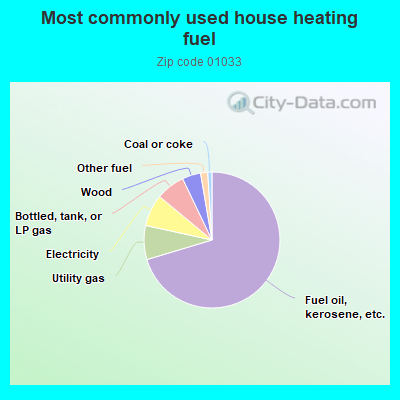
70.5%Fuel oil, kerosene, etc.
8.1%Utility gas
7.6%Electricity
6.9%Bottled, tank, or LP gas
4.4%Wood
1.7%Other fuel
1.0%Coal or coke
Population in 1990: 5,526. Population change in the 1990s: +613 (+11.1%).
Place of birth for U.S.-born residents:
This state: 4,480
Northeast: 669
Midwest: 201
South: 239
West: 66
74% of the 01033 zip code residents lived in the same house 5 years ago. Out of people who lived in different houses, 53% lived in this county. Out of people who lived in different counties, 50% lived in Massachusetts.
96% of the 01033 zip code residents lived in the same house 1 year ago. Out of people who lived in different houses, 62% moved from this county. Out of people who lived in different houses, 38% moved from different county within same state.
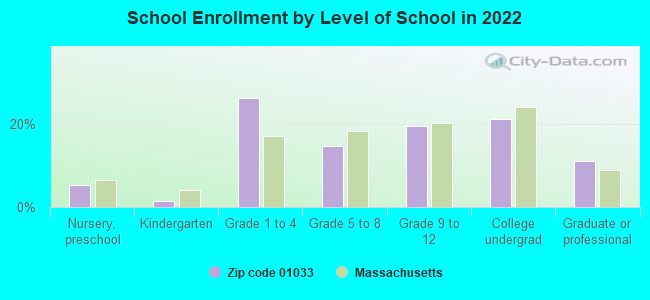
Private vs. public school enrollment:
Students in private schools in grades 1 to 8 (elementary and middle school): 33
Here:
7.1%
Massachusetts:
10.3%
Students in private schools in grades 9 to 12 (high school): 17
Here:
7.6%
Massachusetts:
12.3%
Students in private undergraduate colleges: 132
Here:
53.7%
Massachusetts:
51.2%
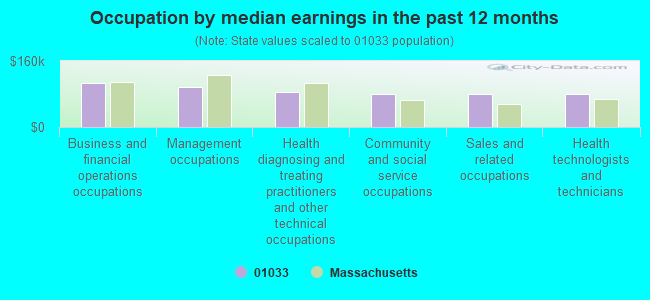
Occupation by median earnings in the past 12 months ($)
106,604Business and financial operations occupations
97,442Management occupations
85,705Health diagnosing and treating practitioners and other technical occupations
80,832Community and social service occupations
80,748Sales and related occupations
80,280Health technologists and technicians
Companies with federal contracts located in this zip code:
AUTOLINES PAVEMENT MARKINGS (69 TAYLOR STREET in GRANBY, MA; small business) : $15,750 in 3 contractsin 2004
$7,900 with Air Force for Maintenance, Repair or Alteration of Real Property -- Airport Runways. Signed on 2004-09-27. Completion date: 2004-10-23.
$5,400, same as above.Signed on 2004-07-16. Completion date: 2004-08-13.
$2,450, same as above.Signed on 2004-08-09. Completion date: 2004-09-04.
Top industries in this zip code by the number of employees in 2005:
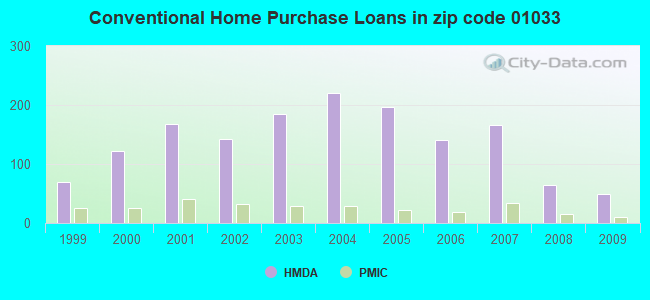
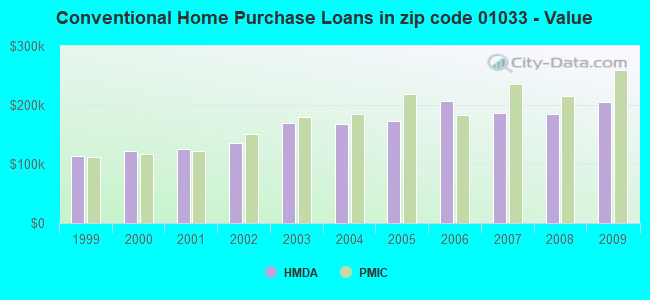
Detailed PMIC statistics for the following Tracts:8209.00
2002 - 2018 National Fire Incident Reporting System (NFIRS) incidents
According to the data from the years 2002 - 2018 the average number of fire incidents per year is 32. The highest number of reported fire incidents - 54 took place in 2002, and the least - 10 in 2005. The data has a declining trend.
When looking into fire subcategories, the most incidents belonged to: Structure Fires (41.6%), and Outside Fires (40.3%).
Fire incident types reported to NFIRS in Zip Code 01033


 Nearest zip codes: 01022, 01056, 01075, 01151, 01020, 01007.
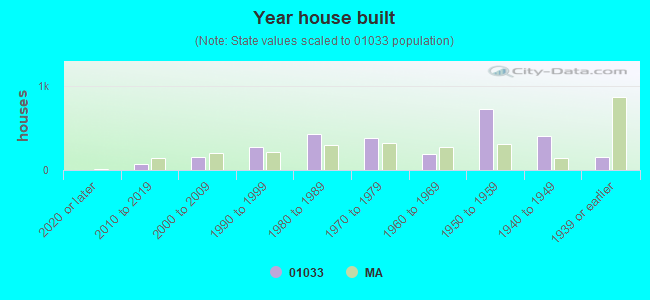


 According to the data from the years 2002 - 2018 the average number of fire incidents per year is 32. The highest number of reported fire incidents - 54 took place in 2002, and the least - 10 in 2005. The data has a declining trend.
 When looking into fire subcategories, the most incidents belonged to: Structure Fires (41.6%), and Outside Fires (40.3%).