Estimated zip code population in 2022: 10,529 Zip code population in 2010: 10,322 Zip code population in 2000: 9,961
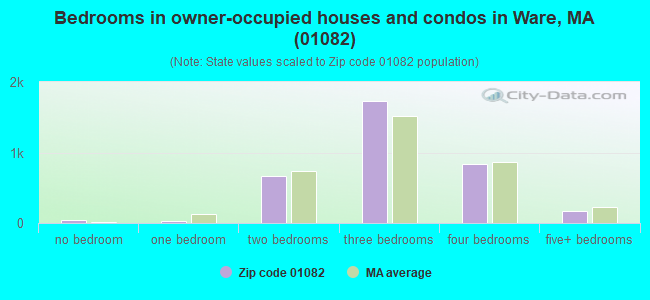
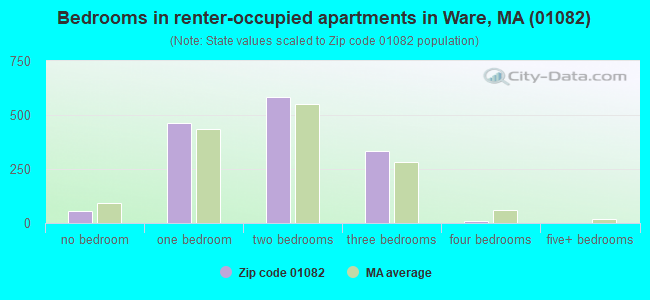
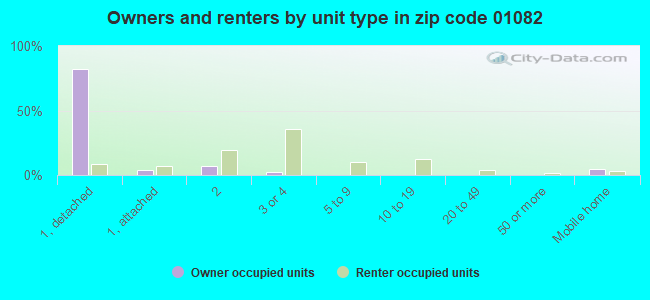
Houses and condos: 5,387 Renter-occupied apartments: 1,440
% of renters here:
29%
State:
38%
March 2022 cost of living index in zip code 01082: 106.8 (more than average, U.S. average is 100)
Land area: 46.1 sq. mi. Water area: 6.2 sq. mi.
Population density: 228 people per square mile
(very low).
OSM Map
Google Map
MSN Map
OSM Map
General Map
Google Map
MSN Map
OSM Map
Google Map
MSN Map
OSM Map
Google Map
MSN Map
Please wait while loading the map...
Real estate property taxes paid for housing units in 2022:
This zip code:
1.5% ($4,030)
Massachusetts:
1.0% ($5,536)
Median real estate property taxes paid for housing units with mortgages in 2022: $4,124 (1.4%) Median real estate property taxes paid for housing units with no mortgage in 2022: $3,751 (1.7%)
Business Search- 14 Million verified businesses
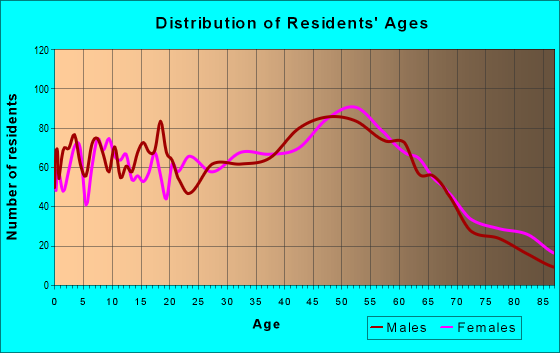
Males: 5,113
(48.6%)
Females: 5,416
(51.4%)
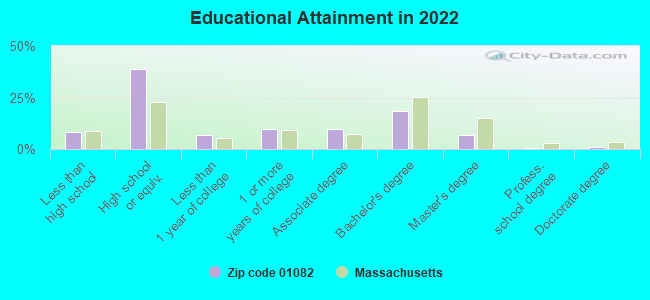
For population 25 years and over in 01082:
High school or higher: 91.4%
Bachelor's degree or higher: 26.9%
Graduate or professional degree: 8.3%
Unemployed: 6.2%
Mean travel time to work (commute): 30.3 minutes
For population 15 years and over in 01082:
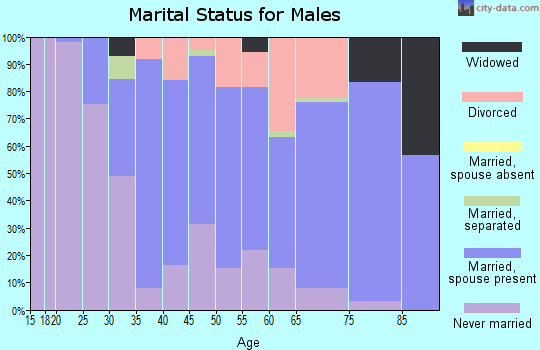
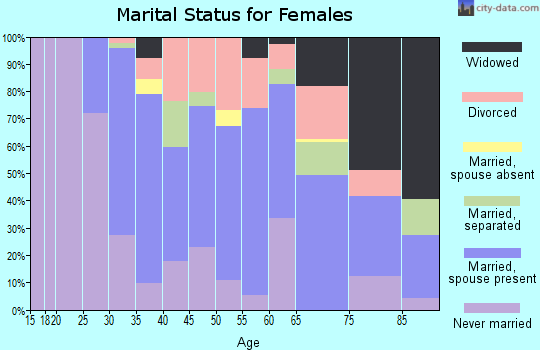
Never married: 31.6%
Now married: 48.1%
Separated: 1.6%
Widowed: 6.2%
Divorced: 12.5%
Zip code 01082 compared to state average:
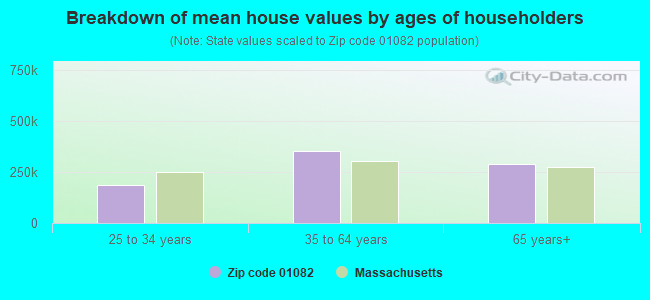
Median house value below state average.
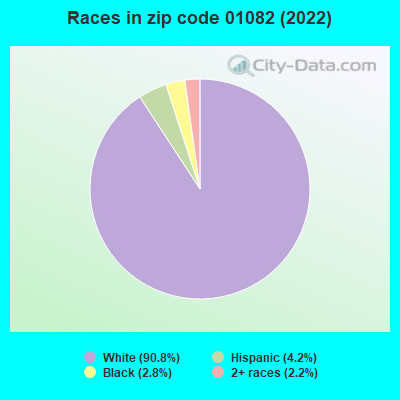
Black race population percentage below state average.
Hispanic race population percentage significantly below state average.
Foreign-born population percentage significantly below state average.
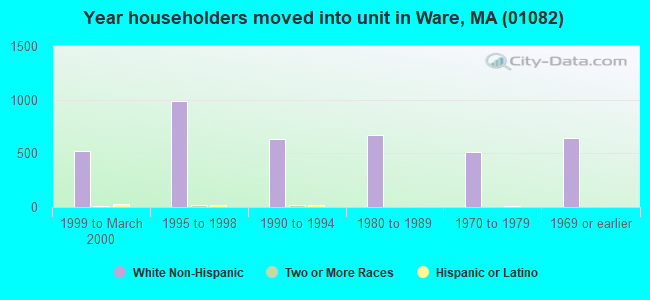
Length of stay since moving in significantly above state average.
Percentage of population with a bachelor's degree or higher below state average.
Averages for the 2020 tax year for zip code 01082, filed in 2021:
Average Adjusted Gross Income (AGI) in 2020: $56,993 (Individual Income Tax Returns)
Here:
$56,993
State:
$105,130
Salary/wage: $49,736 (reported on 81.1% of returns)
Here:
$49,736
State:
$82,951
(% of AGI for various income ranges: 1052.4% for AGIs below $25k, 3477.2% for AGIs $25k-50k, 6039.1% for AGIs $50k-75k, 9284.6% for AGIs $75k-100k, 16855.6% for AGIs $100k-200k, 63663.3% for AGIs over 200k)
Taxable interest for individuals: $860 (reported on 35.6% of returns)
This zip code:
$860
Massachusetts:
$2,361
(% of AGI for various income ranges: 19.8% for AGIs below $25k, 19.4% for AGIs $25k-50k, 40.6% for AGIs $50k-75k, 70.8% for AGIs $75k-100k, 121.6% for AGIs $100k-200k, 526.7% for AGIs over 200k)
Ordinary dividends: $2,374 (reported on 14.1% of returns)
Here:
$2,374
State:
$10,365
(% of AGI for various income ranges: 17.1% for AGIs below $25k, 17.1% for AGIs $25k-50k, 49.2% for AGIs $50k-75k, 49.7% for AGIs $75k-100k, 114.7% for AGIs $100k-200k, 1433.3% for AGIs over 200k)
Net capital gain/loss in AGI: +$8,098 (reported on 10.8% of returns)
Here:
+$8,098
State:
+$48,178
(% of AGI for various income ranges: 6.5% for AGIs below $25k, 18.5% for AGIs $25k-50k, 72.5% for AGIs $50k-75k, 101.9% for AGIs $75k-100k, 437.7% for AGIs $100k-200k, 5836.7% for AGIs over 200k)
Profit/loss from business: +$8,535 (reported on 10.1% of returns)
Here:
+$8,535
State:
+$20,792
(% of AGI for various income ranges: 57.8% for AGIs below $25k, 66.5% for AGIs $25k-50k, 110.0% for AGIs $50k-75k, 205.9% for AGIs $75k-100k, 407.0% for AGIs $100k-200k)
Taxable individual retirement arrangement distribution: $16,410 (reported on 9.4% of returns)
01082:
$16,410
Massachusetts:
$22,790
(% of AGI for various income ranges: 60.5% for AGIs below $25k, 85.0% for AGIs $25k-50k, 220.9% for AGIs $50k-75k, 236.5% for AGIs $75k-100k, 652.3% for AGIs $100k-200k, 5113.3% for AGIs over 200k)
Total itemized deductions: $21,800 (reported on 5.1% of returns)
Here:
$21,800
State:
$36,722
(% of AGI for various income ranges: 38.4% for AGIs below $25k, 49.9% for AGIs $25k-50k, 199.2% for AGIs $50k-75k, 301.6% for AGIs $75k-100k, 438.6% for AGIs $100k-200k, 2576.7% for AGIs over 200k)
Charity contributions: $3,831 (reported on 2.9% of returns)
Here:
$3,831
State:
$12,529
(% of AGI for various income ranges: 2.9% for AGIs below $25k, 11.9% for AGIs $50k-75k, 15.4% for AGIs $75k-100k, 104.0% for AGIs $100k-200k)
Taxes paid: $7,889 (reported on 5.1% of returns)
01082:
$7,889
State:
$8,782
(% of AGI for various income ranges: 9.0% for AGIs below $25k, 15.6% for AGIs $25k-50k, 73.4% for AGIs $50k-75k, 136.8% for AGIs $75k-100k, 163.0% for AGIs $100k-200k, 786.7% for AGIs over 200k)
Earned income credit: $2,074 (reported on 13.2% of returns)
Here:
$2,074
State:
$1,909
(% of AGI for various income ranges: 65.0% for AGIs below $25k, 61.2% for AGIs $25k-50k)
Percentage of individuals using paid preparers for their 2020 taxes: 94.1%
Here:
94%
State:
92%
(% for various income ranges: 92.6% for AGIs below $25k, 95.0% for AGIs $25k-50k, 95.5% for AGIs $50k-75k, 92.5% for AGIs $75k-100k, 95.8% for AGIs $100k-200k, 90.9% for AGIs over 200k)
Averages for the 2012 tax year for zip code 01082, filed in 2013:
Average Adjusted Gross Income (AGI) in 2012: $47,485 (Individual Income Tax Returns)
Here:
$47,485
State:
$81,425
Salary/wage: $43,696 (reported on 84.8% of returns)
Here:
$43,696
State:
$64,752
(% of AGI for various income ranges: 71.9% for AGIs below $25k, 78.1% for AGIs $25k-50k, 77.5% for AGIs $50k-75k, 80.3% for AGIs $75k-100k, 83.1% for AGIs $100k-200k, 64.2% for AGIs over 200k)
Taxable interest for individuals: $748 (reported on 49.8% of returns)
This zip code:
$748
Massachusetts:
$2,136
(% of AGI for various income ranges: 1.3% for AGIs below $25k, 1.0% for AGIs $25k-50k, 0.8% for AGIs $50k-75k, 0.6% for AGIs $75k-100k, 0.5% for AGIs $100k-200k, 0.8% for AGIs over 200k)
Ordinary dividends: $1,819 (reported on 18.0% of returns)
Here:
$1,819
State:
$9,473
(% of AGI for various income ranges: 0.7% for AGIs below $25k, 0.6% for AGIs $25k-50k, 0.6% for AGIs $50k-75k, 0.6% for AGIs $75k-100k, 0.7% for AGIs $100k-200k, 1.3% for AGIs over 200k)
Net capital gain/loss in AGI: +$1,650 (reported on 9.7% of returns)
Here:
+$1,650
State:
+$31,437
(% of AGI for various income ranges: 0.2% for AGIs $25k-50k, 0.3% for AGIs $50k-75k, 0.4% for AGIs $75k-100k, 0.5% for AGIs $100k-200k, 0.6% for AGIs over 200k)
Profit/loss from business: +$10,419 (reported on 10.7% of returns)
Here:
+$10,419
State:
+$20,662
(% of AGI for various income ranges: 4.3% for AGIs below $25k, 2.1% for AGIs $25k-50k, 2.6% for AGIs $50k-75k, 1.9% for AGIs $75k-100k, 2.6% for AGIs $100k-200k)
Taxable individual retirement arrangement distribution: $10,132 (reported on 10.7% of returns)
01082:
$10,132
Massachusetts:
$18,892
(% of AGI for various income ranges: 3.6% for AGIs below $25k, 2.0% for AGIs $25k-50k, 2.0% for AGIs $50k-75k, 2.4% for AGIs $75k-100k, 2.8% for AGIs $100k-200k)
Total itemized deductions: $17,657 (21% of AGI, reported on 30.0% of returns)
Here:
$17,657
State:
$28,907
Here:
21.0% of AGI
State:
18.2% of AGI
(% of AGI for various income ranges: 5.9% for AGIs below $25k, 8.1% for AGIs $25k-50k, 11.0% for AGIs $50k-75k, 13.3% for AGIs $75k-100k, 14.2% for AGIs $100k-200k, 11.8% for AGIs over 200k)
Charity contributions: $1,433 (reported on 21.7% of returns)
Here:
$1,433
State:
$4,208
(% of AGI for various income ranges: 0.2% for AGIs below $25k, 0.4% for AGIs $25k-50k, 0.7% for AGIs $50k-75k, 0.8% for AGIs $75k-100k, 0.8% for AGIs $100k-200k, 0.8% for AGIs over 200k)
Taxes paid: $7,910 (reported on 30.0% of returns)
01082:
$7,910
State:
$13,303
(% of AGI for various income ranges: 1.7% for AGIs below $25k, 2.9% for AGIs $25k-50k, 4.6% for AGIs $50k-75k, 5.8% for AGIs $75k-100k, 7.2% for AGIs $100k-200k, 7.6% for AGIs over 200k)
Earned income credit: $1,939 (reported on 15.6% of returns)
Here:
$1,939
State:
$1,971
(% of AGI for various income ranges: 4.8% for AGIs below $25k, 0.8% for AGIs $25k-50k)
Percentage of individuals using paid preparers for their 2012 taxes: 52.2%
Here:
52%
State:
56%
(% for various income ranges: 45.6% for AGIs below $25k, 50.7% for AGIs $25k-50k, 58.8% for AGIs $50k-75k, 60.4% for AGIs $75k-100k, 60.0% for AGIs $100k-200k, 80.0% for AGIs over 200k)
Averages for the 2004 tax year for zip code 01082, filed in 2005:
Average Adjusted Gross Income (AGI) in 2004: $40,795 (Individual Income Tax Returns)
Here:
$40,795
State:
$62,877
Salary/wage: $37,712 (reported on 87.3% of returns)
Here:
$37,712
State:
$52,969
(% of AGI for various income ranges: 95.4% for AGIs below $10k, 72.3% for AGIs $10k-25k, 83.3% for AGIs $25k-50k, 83.8% for AGIs $50k-75k, 86.5% for AGIs $75k-100k, 71.5% for AGIs over 100k)
Taxable interest for individuals: $1,016 (reported on 61.0% of returns)
This zip code:
$1,016
Massachusetts:
$1,945
(% of AGI for various income ranges: 4.5% for AGIs below $10k, 3.2% for AGIs $10k-25k, 1.2% for AGIs $25k-50k, 1.0% for AGIs $50k-75k, 1.6% for AGIs $75k-100k, 1.3% for AGIs over 100k)
Taxable dividends: $1,061 (reported on 21.3% of returns)
Here:
$1,061
State:
$5,323
(% of AGI for various income ranges: 1.2% for AGIs below $10k, 0.8% for AGIs $10k-25k, 0.5% for AGIs $25k-50k, 0.4% for AGIs $50k-75k, 0.3% for AGIs $75k-100k, 0.8% for AGIs over 100k)
Net capital gain/loss: +$7,306 (reported on 13.2% of returns)
Here:
+$7,306
State:
+$20,377
(% of AGI for various income ranges: -0.4% for AGIs below $10k, 0.1% for AGIs $10k-25k, 0.7% for AGIs $25k-50k, 0.9% for AGIs $50k-75k, 1.2% for AGIs $75k-100k, 8.7% for AGIs over 100k)
Profit/loss from business: +$10,744 (reported on 12.0% of returns)
Here:
+$10,744
State:
+$17,837
(% of AGI for various income ranges: 2.2% for AGIs below $10k, 4.7% for AGIs $10k-25k, 2.8% for AGIs $25k-50k, 3.4% for AGIs $50k-75k, 1.4% for AGIs $75k-100k, 4.0% for AGIs over 100k)
IRA payment deduction: $2,932 (reported on 3.0% of returns)
01082:
$2,932
Massachusetts:
$3,100
(% of AGI for various income ranges: 0.3% for AGIs $10k-25k, 0.3% for AGIs $25k-50k, 0.2% for AGIs $50k-75k, 0.1% for AGIs $75k-100k, 0.2% for AGIs over 100k)
Self-employed pension: $7,467 (reported on 0.6% of returns)
Here:
$7,467
Massachusetts:
$14,516
Total itemized deductions: $14,787 (21% of AGI, reported on 32.4% of returns)
Here:
$14,787
State:
$22,573
Here:
21.2% of AGI
State:
19.5% of AGI
(% of AGI for various income ranges: 5.7% for AGIs below $10k, 8.0% for AGIs $10k-25k, 9.7% for AGIs $25k-50k, 13.7% for AGIs $50k-75k, 14.4% for AGIs $75k-100k, 12.0% for AGIs over 100k)
Charity contributions deductions: $1,338 (2% of AGI, reported on 27.2% of returns)
Here:
$1,338
State:
$3,295
Here:
1.8% of AGI
State:
2.7% of AGI
(% of AGI for various income ranges: 0.5% for AGIs below $10k, 0.4% for AGIs $10k-25k, 0.6% for AGIs $25k-50k, 1.0% for AGIs $50k-75k, 1.1% for AGIs $75k-100k, 1.2% for AGIs over 100k)
Total tax: $5,207 (reported on 79.1% of returns)
01082:
$5,207
State:
$11,494
(% of AGI for various income ranges: 2.2% for AGIs below $10k, 4.4% for AGIs $10k-25k, 7.6% for AGIs $25k-50k, 9.2% for AGIs $50k-75k, 10.4% for AGIs $75k-100k, 17.6% for AGIs over 100k)
Earned income credit: $1,556 (reported on 13.3% of returns)
Here:
$1,556
State:
$1,518
Percentage of individuals using paid preparers for their 2004 taxes: 57.2%
Here:
57%
State:
58%
(% for various income ranges: 46.8% for AGIs below $10k, 57.2% for AGIs $10k-25k, 57.6% for AGIs $25k-50k, 61.8% for AGIs $50k-75k, 58.6% for AGIs $75k-100k, 70.9% for AGIs over 100k)
Household received Food Stamps/SNAP in the past 12 months: 1,334 Household did not receive Food Stamps/SNAP in the past 12 months: 3,715
Women who had a birth in the past 12 months: 66 (23 now married, 37 unmarried) Women who did not have a birth in the past 12 months: 2,225 (774 now married, 1,453 unmarried)
Housing units in zip code 01082 with a mortgage: 2,079 (158 second mortgage, 157 both second mortgage and home equity loan) Houses without a mortgage: 20
Median monthly owner costs for units with a mortgage: $1,897 Median monthly owner costs for units without a mortgage: $692
Residents with income below the poverty level in 2022:
This zip code:
11.4%
Whole state:
10.4%
Residents with income below 50% of the poverty level in 2022:
This zip code:
4.6%
Whole state:
5.1%
Median number of rooms in houses and condos:
Here:
6.2
State:
6.5
Median number of rooms in apartments:
Here:
4.2
State:
4.0
Notable locations in this zip code not listed on our city pages
Notable locations in zip code 01082: Ware Town Hall (A), Young Mens Library Association (B), Ware Fire Department (C). Display/hide their locations on the map
Churches in zip code 01082 include: United Church of Ware (A), Trinity Episcopal Church (B), Sovereign Grace Baptist Church (C), Quabbin Valley Baptist Church (D), Mount Carmel Church (E), Lighthouse Baptist Church (F). Display/hide their locations on the map
Cemeteries: Aspen Grove Cemetery (1), Old Saint Williams Cemetery (2), Quabbin Park Cemetery (3), Walnut Grove Cemetery (4), Saint Marys Cemetery (5), Mount Carmel Cemetery (6). Display/hide their locations on the map
Lakes and reservoirs: Sunk Pond (A), Morton Pond (B), Snow Pond (C), Hardwick Pond (D), Ware River Reservoir (E), Peppers Mill Pond (F), Beaver Lake (G). Display/hide their locations on the map
Streams, rivers, and creeks: Beaver Brook (A), Canterbury Brook (B), Flat Brook (C), King Brook (D), Middle Branch Swift River (E), Penny Brook (F), East Branch Swift River (G), Ellwell Brook (H), Muddy Brook (I). Display/hide their locations on the map
Parks in zip code 01082 include: Greenville Park (1), Ware Millyard Historic District (2), Ware Center Historic District (3), Church Street Historic District (4). Display/hide their locations on the map
730 married couples with children.
1,084 single-parent households (159 men, 925 women).
91.3% of residents of 01082 zip code speak English at home.
2.9% of residents speak Spanish at home (82% very well, 12% well, 6% not well).
4.5% of residents speak other Indo-European language at home (54% very well, 28% well, 16% not well, 2% not at all).
0.5% of residents speak other language at home (81% very well, 19% well).
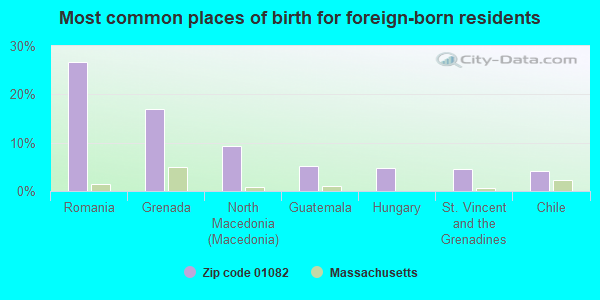
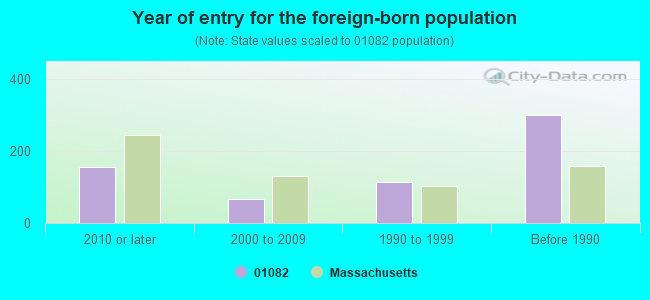
Foreign born population: 556 (5.3%) (52.8% of them are naturalized citizens)
This zip code:
5.3%
Whole state:
18.0%
27%Romania
17%Grenada
9%North Macedonia (Macedonia)
5%Guatemala
5%Hungary
4%St. Vincent and the Grenadines
4%Chile
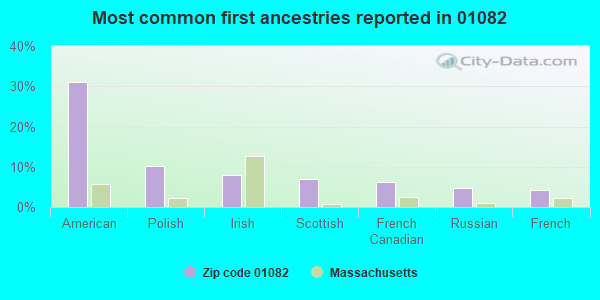
31%American
10%Polish
8%Irish
7%Scottish
6%French Canadian
5%Russian
4%French
Year of entry for the foreign-born population
1562010 or later
662000 to 2009
1141990 to 1999
301Before 1990
Facilities with environmental interests located in this zip code:
KANZAKI SPECIALTY PAPERS INC (20 CUMMINGS STREET in WARE, MA)
AIR SYNTHETIC MINOR (AIRS/AFS) SUPERFUND (Superfund database) CRITERIA AND HAZARDOUS AIR POLLUTANT INVENTORY (Inventory of air pollution sources) Small Quantity Generators, between 100 kg and 1000 kg of hazardous waste/month (Resource Conservation and Recovery Act (tracking hazardous waste)) - notification TRI REPORTER (Tracking of toxic chemicals releasing facilities) Business SIC and NAICS classification: COATED AND LAMINATED PAPER Organizations: KANZAKI USA INC (CONTACT/OWNER)
Alternative names: KANZAKI SPECIALTY PAPERS INC., LUDLOW SPECIALITY PAPERS, LUDLOW SPECIALITY PAPERS (FORMER)
NOMETCO INC (EAST MAIN STREET in WARE, MA)
(Resource Conservation and Recovery Act (tracking hazardous waste)) TRI REPORTER (Tracking of toxic chemicals releasing facilities) Business SIC classification: ELECTROPLATING, PLATING, POLISHING, ANODIZING, AND COLORING
BOBS SUNOCO STATION (57 EAST ST in WARE, MA)
(Resource Conservation and Recovery Act (tracking hazardous waste)) Organizations: ROBERT ANDERSON (CONTACT/OWNER)
DONS AUTO BODY (BACON RD in WARE, MA)
(Resource Conservation and Recovery Act (tracking hazardous waste)) Business NAICS classification: GENERAL AUTOMOTIVE REPAIR. Organizations: DONS AUTO SERVICE INC (CONTACT/OWNER)
MARY LANE HOSPITAL (85 SOUTH STREET in WARE, MA)
AIR MINOR (AIRS/AFS) CRITERIA AND HAZARDOUS AIR POLLUTANT INVENTORY (Inventory of air pollution sources) Business SIC classification: GENERAL MEDICAL AND SURGICAL HOSPITALS
EDGAR MACHINE (180 WEST ST in WARE, MA)
Conditionally Exempt Small Quantity Generators, less than 100 kg/month of hazardous waste (Resource Conservation and Recovery Act (tracking hazardous waste)) - notification Organizations: DAVID EDGAR (CONTACT/OWNER)
MA ELEC CO WARE SERV CTR (GILBERTVILLE RD in WARE, MA)
(Resource Conservation and Recovery Act (tracking hazardous waste))
MT. BETHER CHRISTIAN SCHOOL (BACON ROAD in WARE, MA)
COMPLIANCE ACTIVITY (Tracking inspections of insecticide, fungicide, and rodenticide, and toxic substances)
Housing units lacking complete kitchen facilities: 0.3%
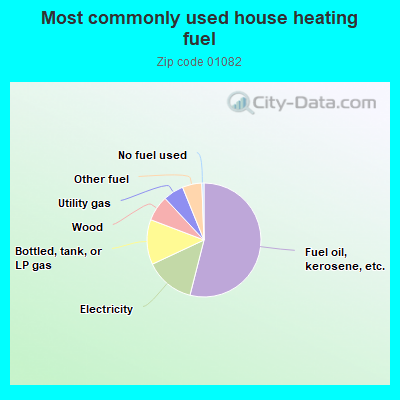
53.7%Fuel oil, kerosene, etc.
14.0%Electricity
12.7%Bottled, tank, or LP gas
7.2%Wood
5.8%Utility gas
5.5%Other fuel
0.6%No fuel used
Population in 1990: 9,808. Population change in the 1990s: +153 (+1.6%).
Place of birth for U.S.-born residents:
This state: 8,416
Northeast: 875
Midwest: 163
South: 287
West: 58
62% of the 01082 zip code residents lived in the same house 5 years ago. Out of people who lived in different houses, 55% lived in this county. Out of people who lived in different counties, 50% lived in Massachusetts.
94% of the 01082 zip code residents lived in the same house 1 year ago. Out of people who lived in different houses, 27% moved from this county. Out of people who lived in different houses, 54% moved from different county within same state. Out of people who lived in different houses, 21% moved from different state. Out of people who lived in different houses, 2% moved from abroad.
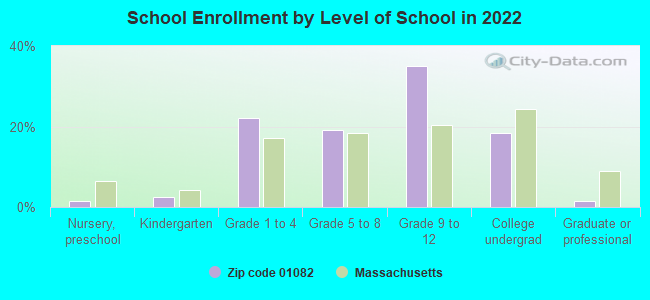
Private vs. public school enrollment:
Students in private schools in grades 1 to 8 (elementary and middle school): 23
Here:
2.6%
Massachusetts:
10.3%
Students in private schools in grades 9 to 12 (high school): 37
Here:
4.9%
Massachusetts:
12.3%
Students in private undergraduate colleges: 245
Here:
60.1%
Massachusetts:
51.2%
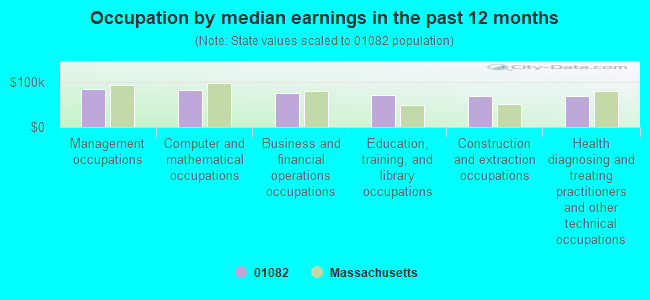
Occupation by median earnings in the past 12 months ($)
85,839Management occupations
83,561Computer and mathematical occupations
75,511Business and financial operations occupations
71,533Education, training, and library occupations
70,266Construction and extraction occupations
69,680Health diagnosing and treating practitioners and other technical occupations
Top industries in this zip code by the number of employees in 2005:
Health Care and Social Assistance: General Medical and Surgical Hospitals (250-499 employees: 1 establishment)
2002 - 2018 National Fire Incident Reporting System (NFIRS) incidents
According to the data from the years 2002 - 2018 the average number of fires per year is 59. The highest number of reported fires - 96 took place in 2006, and the least - 27 in 2017. The data has a dropping trend.
When looking into fire subcategories, the most reports belonged to: Outside Fires (47.2%), and Structure Fires (34.5%).
Fire incident types reported to NFIRS in Zip Code 01082


 Nearest zip codes: 01031, 01009, 01079, 01069, 01092, 01037.


 According to the data from the years 2002 - 2018 the average number of fires per year is 59. The highest number of reported fires - 96 took place in 2006, and the least - 27 in 2017. The data has a dropping trend.
 When looking into fire subcategories, the most reports belonged to: Outside Fires (47.2%), and Structure Fires (34.5%).