Estimated zip code population in 2022: 16,013 Zip code population in 2010: 16,021 Zip code population in 2000: 15,882
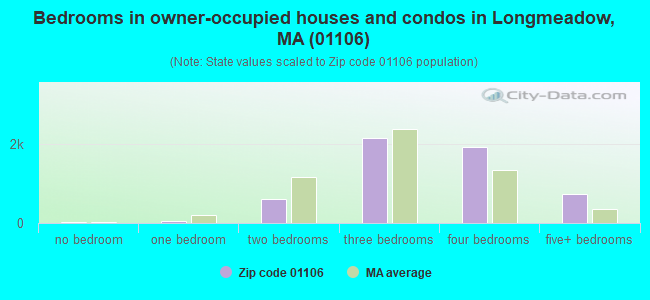
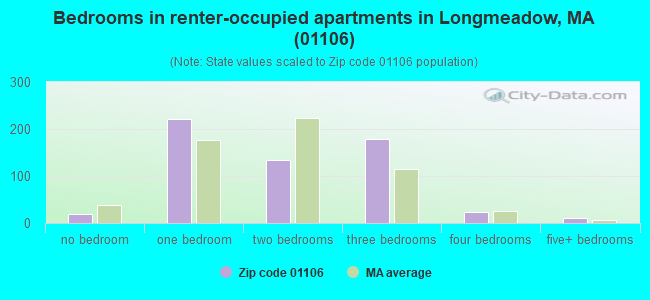
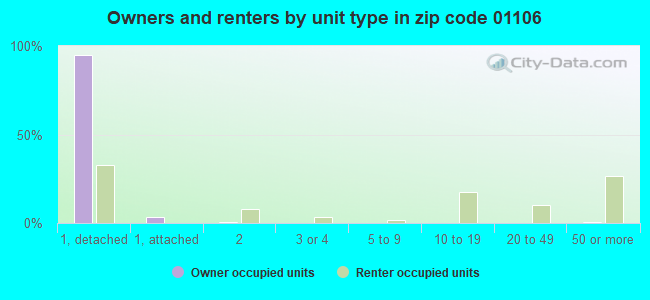
Houses and condos: 6,289 Renter-occupied apartments: 583
% of renters here:
10%
State:
38%
March 2022 cost of living index in zip code 01106: 120.5 (high, U.S. average is 100)
Land area: 9.3 sq. mi. Water area: 0.5 sq. mi.
Population density: 1,722 people per square mile
(low).
OSM Map
Google Map
MSN Map
OSM Map
General Map
Google Map
MSN Map
OSM Map
Google Map
MSN Map
OSM Map
Google Map
MSN Map
Please wait while loading the map...
Real estate property taxes paid for housing units in 2022:
This zip code:
1.9% ($8,541)
Massachusetts:
1.0% ($5,536)
Median real estate property taxes paid for housing units with mortgages in 2022: $8,677 (1.8%) Median real estate property taxes paid for housing units with no mortgage in 2022: $8,269 (2.0%)
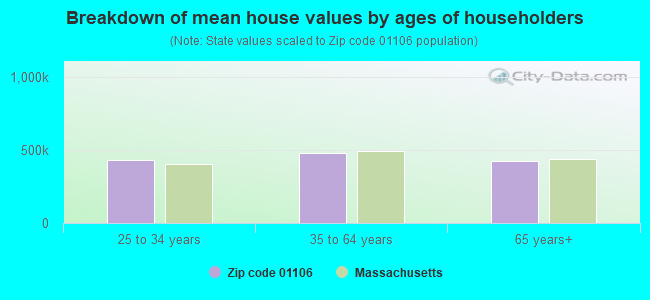
Estimated median house/condo value in 2022: $452,489
01106:
$452,489
Massachusetts:
$534,700
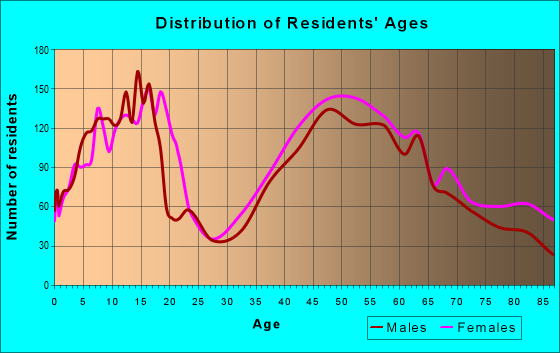
Median resident age:
This zip code:
45.7 years
Massachusetts median age:
40.3 years
Average household size:
This zip code:
2.5 people
Massachusetts:
2.4 people
Averages for the 2020 tax year for zip code 01106, filed in 2021:
Average Adjusted Gross Income (AGI) in 2020: $182,311 (Individual Income Tax Returns)
Here:
$182,311
State:
$105,130
Salary/wage: $122,769 (reported on 77.6% of returns)
Here:
$122,769
State:
$82,951
(% of AGI for various income ranges: 1151.8% for AGIs below $25k, 3534.2% for AGIs $25k-50k, 6258.6% for AGIs $50k-75k, 9342.1% for AGIs $75k-100k, 20063.9% for AGIs $100k-200k, 94698.5% for AGIs over 200k)
Taxable interest for individuals: $5,306 (reported on 54.4% of returns)
This zip code:
$5,306
Massachusetts:
$2,361
(% of AGI for various income ranges: 42.7% for AGIs below $25k, 56.6% for AGIs $25k-50k, 113.7% for AGIs $50k-75k, 168.6% for AGIs $75k-100k, 190.4% for AGIs $100k-200k, 3956.0% for AGIs over 200k)
Ordinary dividends: $16,429 (reported on 45.2% of returns)
Here:
$16,429
State:
$10,365
(% of AGI for various income ranges: 107.3% for AGIs below $25k, 183.9% for AGIs $25k-50k, 352.9% for AGIs $50k-75k, 479.5% for AGIs $75k-100k, 781.0% for AGIs $100k-200k, 9445.5% for AGIs over 200k)
Net capital gain/loss in AGI: +$58,713 (reported on 39.8% of returns)
Here:
+$58,713
State:
+$48,178
(% of AGI for various income ranges: 54.8% for AGIs below $25k, 125.6% for AGIs $25k-50k, 265.7% for AGIs $50k-75k, 422.4% for AGIs $75k-100k, 828.1% for AGIs $100k-200k, 35991.9% for AGIs over 200k)
Profit/loss from business: +$35,310 (reported on 18.9% of returns)
Here:
+$35,310
State:
+$20,792
(% of AGI for various income ranges: 94.8% for AGIs below $25k, 241.1% for AGIs $25k-50k, 470.4% for AGIs $50k-75k, 493.6% for AGIs $75k-100k, 1070.0% for AGIs $100k-200k, 7441.3% for AGIs over 200k)
Taxable individual retirement arrangement distribution: $28,712 (reported on 15.5% of returns)
01106:
$28,712
Massachusetts:
$22,790
(% of AGI for various income ranges: 108.9% for AGIs below $25k, 256.3% for AGIs $25k-50k, 429.8% for AGIs $50k-75k, 690.7% for AGIs $75k-100k, 1207.9% for AGIs $100k-200k, 3267.7% for AGIs over 200k)
Self-employed (Keogh) retirement plans: $26,418 (reported on 2.2% of returns)
01106:
$26,418
Massachusetts:
$26,868
(% of AGI for various income ranges: 24.8% for AGIs below $25k, 55.0% for AGIs $100k-200k, 799.4% for AGIs over 200k)
Total itemized deductions: $39,426 (reported on 17.8% of returns)
Here:
$39,426
State:
$36,722
(% of AGI for various income ranges: 209.6% for AGIs below $25k, 392.4% for AGIs $25k-50k, 786.5% for AGIs $50k-75k, 731.4% for AGIs $75k-100k, 1197.0% for AGIs $100k-200k, 6769.8% for AGIs over 200k)
Charity contributions: $14,399 (reported on 15.2% of returns)
Here:
$14,399
State:
$12,529
(% of AGI for various income ranges: 10.4% for AGIs below $25k, 16.0% for AGIs $25k-50k, 62.2% for AGIs $50k-75k, 78.8% for AGIs $75k-100k, 178.9% for AGIs $100k-200k, 3075.1% for AGIs over 200k)
Taxes paid: $9,300 (reported on 17.8% of returns)
01106:
$9,300
State:
$8,782
(% of AGI for various income ranges: 54.9% for AGIs below $25k, 91.9% for AGIs $25k-50k, 257.6% for AGIs $50k-75k, 292.4% for AGIs $75k-100k, 381.2% for AGIs $100k-200k, 1203.8% for AGIs over 200k)
Earned income credit: $1,561 (reported on 4.0% of returns)
Here:
$1,561
State:
$1,909
(% of AGI for various income ranges: 34.9% for AGIs below $25k, 31.3% for AGIs $25k-50k)
Percentage of individuals using paid preparers for their 2020 taxes: 92.0%
Here:
92%
State:
92%
(% for various income ranges: 89.5% for AGIs below $25k, 89.7% for AGIs $25k-50k, 93.9% for AGIs $50k-75k, 89.0% for AGIs $75k-100k, 93.8% for AGIs $100k-200k, 94.3% for AGIs over 200k)
Averages for the 2012 tax year for zip code 01106, filed in 2013:
Average Adjusted Gross Income (AGI) in 2012: $142,969 (Individual Income Tax Returns)
Here:
$142,969
State:
$81,425
Salary/wage: $106,226 (reported on 77.9% of returns)
Here:
$106,226
State:
$64,752
(% of AGI for various income ranges: 60.4% for AGIs below $25k, 59.2% for AGIs $25k-50k, 62.0% for AGIs $50k-75k, 63.8% for AGIs $75k-100k, 71.2% for AGIs $100k-200k, 51.7% for AGIs over 200k)
Taxable interest for individuals: $4,669 (reported on 62.2% of returns)
This zip code:
$4,669
Massachusetts:
$2,136
(% of AGI for various income ranges: 2.9% for AGIs below $25k, 2.3% for AGIs $25k-50k, 2.0% for AGIs $50k-75k, 2.1% for AGIs $75k-100k, 1.2% for AGIs $100k-200k, 2.3% for AGIs over 200k)
Ordinary dividends: $14,215 (reported on 48.6% of returns)
Here:
$14,215
State:
$9,473
(% of AGI for various income ranges: 6.7% for AGIs below $25k, 4.3% for AGIs $25k-50k, 3.7% for AGIs $50k-75k, 3.4% for AGIs $75k-100k, 3.3% for AGIs $100k-200k, 5.6% for AGIs over 200k)
Net capital gain/loss in AGI: +$30,578 (reported on 38.6% of returns)
Here:
+$30,578
State:
+$31,437
(% of AGI for various income ranges: 1.1% for AGIs below $25k, 0.5% for AGIs $25k-50k, 1.3% for AGIs $50k-75k, 0.9% for AGIs $75k-100k, 1.8% for AGIs $100k-200k, 12.6% for AGIs over 200k)
Profit/loss from business: +$39,639 (reported on 18.0% of returns)
Here:
+$39,639
State:
+$20,662
(% of AGI for various income ranges: 4.9% for AGIs below $25k, 6.3% for AGIs $25k-50k, 4.9% for AGIs $50k-75k, 5.4% for AGIs $75k-100k, 4.9% for AGIs $100k-200k, 4.9% for AGIs over 200k)
Taxable individual retirement arrangement distribution: $30,047 (reported on 18.9% of returns)
01106:
$30,047
Massachusetts:
$18,892
(% of AGI for various income ranges: 6.6% for AGIs below $25k, 6.1% for AGIs $25k-50k, 4.7% for AGIs $50k-75k, 5.4% for AGIs $75k-100k, 4.5% for AGIs $100k-200k, 3.4% for AGIs over 200k)
Self-employment retirement plans: $24,067 (reported on 3.2% of returns)
01106:
$24,067
Massachusetts:
$20,669
(% of AGI for various income ranges: 0.8% for AGIs $50k-75k, 0.5% for AGIs $100k-200k, 0.6% for AGIs over 200k)
Total itemized deductions: $35,035 (16% of AGI, reported on 61.6% of returns)
Here:
$35,035
State:
$28,907
Here:
16.4% of AGI
State:
18.2% of AGI
(% of AGI for various income ranges: 26.5% for AGIs below $25k, 21.2% for AGIs $25k-50k, 20.3% for AGIs $50k-75k, 18.9% for AGIs $75k-100k, 17.9% for AGIs $100k-200k, 12.6% for AGIs over 200k)
Charity contributions: $5,391 (reported on 54.9% of returns)
Here:
$5,391
State:
$4,208
(% of AGI for various income ranges: 1.4% for AGIs below $25k, 1.7% for AGIs $25k-50k, 1.6% for AGIs $50k-75k, 2.0% for AGIs $75k-100k, 1.8% for AGIs $100k-200k, 2.3% for AGIs over 200k)
Taxes paid: $19,131 (reported on 61.5% of returns)
01106:
$19,131
State:
$13,303
(% of AGI for various income ranges: 8.0% for AGIs below $25k, 8.1% for AGIs $25k-50k, 8.5% for AGIs $50k-75k, 9.3% for AGIs $75k-100k, 9.3% for AGIs $100k-200k, 7.7% for AGIs over 200k)
Earned income credit: $1,494 (reported on 4.1% of returns)
Here:
$1,494
State:
$1,971
(% of AGI for various income ranges: 1.9% for AGIs below $25k, 0.3% for AGIs $25k-50k)
Percentage of individuals using paid preparers for their 2012 taxes: 65.4%
Here:
65%
State:
56%
(% for various income ranges: 58.7% for AGIs below $25k, 62.2% for AGIs $25k-50k, 64.8% for AGIs $50k-75k, 65.8% for AGIs $75k-100k, 64.3% for AGIs $100k-200k, 81.5% for AGIs over 200k)
Averages for the 2004 tax year for zip code 01106, filed in 2005:
Average Adjusted Gross Income (AGI) in 2004: $111,485 (Individual Income Tax Returns)
Here:
$111,485
State:
$62,877
Salary/wage: $87,271 (reported on 76.0% of returns)
Here:
$87,271
State:
$52,969
(% of AGI for various income ranges: 237.8% for AGIs below $10k, 49.8% for AGIs $10k-25k, 57.1% for AGIs $25k-50k, 62.6% for AGIs $50k-75k, 70.9% for AGIs $75k-100k, 57.7% for AGIs over 100k)
Taxable interest for individuals: $3,960 (reported on 76.1% of returns)
This zip code:
$3,960
Massachusetts:
$1,945
(% of AGI for various income ranges: 28.8% for AGIs below $10k, 8.9% for AGIs $10k-25k, 4.9% for AGIs $25k-50k, 3.1% for AGIs $50k-75k, 2.5% for AGIs $75k-100k, 2.3% for AGIs over 100k)
Taxable dividends: $7,404 (reported on 57.8% of returns)
Here:
$7,404
State:
$5,323
(% of AGI for various income ranges: 33.9% for AGIs below $10k, 7.9% for AGIs $10k-25k, 5.1% for AGIs $25k-50k, 3.9% for AGIs $50k-75k, 3.1% for AGIs $75k-100k, 3.7% for AGIs over 100k)
Net capital gain/loss: +$24,962 (reported on 49.4% of returns)
Here:
+$24,962
State:
+$20,377
(% of AGI for various income ranges: -14.5% for AGIs below $10k, 1.8% for AGIs $10k-25k, 1.4% for AGIs $25k-50k, 1.4% for AGIs $50k-75k, 2.4% for AGIs $75k-100k, 13.7% for AGIs over 100k)
Profit/loss from business: +$38,207 (reported on 19.3% of returns)
Here:
+$38,207
State:
+$17,837
(% of AGI for various income ranges: 8.5% for AGIs below $10k, 5.0% for AGIs $10k-25k, 6.6% for AGIs $25k-50k, 7.1% for AGIs $50k-75k, 5.9% for AGIs $75k-100k, 6.7% for AGIs over 100k)
IRA payment deduction: $3,512 (reported on 3.9% of returns)
01106:
$3,512
Massachusetts:
$3,100
(% of AGI for various income ranges: 0.5% for AGIs $10k-25k, 0.4% for AGIs $25k-50k, 0.4% for AGIs $50k-75k, 0.2% for AGIs $75k-100k, 0.1% for AGIs over 100k)
Self-employed pension: $18,635 (reported on 4.3% of returns)
Here:
$18,635
Massachusetts:
$14,516
(% of AGI for various income ranges: 0.5% for AGIs $25k-50k, 0.3% for AGIs $50k-75k, 0.6% for AGIs $75k-100k, 0.8% for AGIs over 100k)
Total itemized deductions: $27,392 (16% of AGI, reported on 62.3% of returns)
Here:
$27,392
State:
$22,573
Here:
16.4% of AGI
State:
19.5% of AGI
(% of AGI for various income ranges: 59.8% for AGIs below $10k, 25.3% for AGIs $10k-25k, 24.8% for AGIs $25k-50k, 22.1% for AGIs $50k-75k, 21.2% for AGIs $75k-100k, 13.1% for AGIs over 100k)
Charity contributions deductions: $4,318 (2% of AGI, reported on 58.9% of returns)
Here:
$4,318
State:
$3,295
Here:
2.5% of AGI
State:
2.7% of AGI
(% of AGI for various income ranges: 3.1% for AGIs below $10k, 2.2% for AGIs $10k-25k, 2.3% for AGIs $25k-50k, 2.6% for AGIs $50k-75k, 2.3% for AGIs $75k-100k, 2.3% for AGIs over 100k)
Total tax: $24,886 (reported on 82.3% of returns)
01106:
$24,886
State:
$11,494
(% of AGI for various income ranges: 7.0% for AGIs below $10k, 5.6% for AGIs $10k-25k, 7.4% for AGIs $25k-50k, 9.1% for AGIs $50k-75k, 9.8% for AGIs $75k-100k, 21.1% for AGIs over 100k)
Earned income credit: $1,100 (reported on 3.0% of returns)
Here:
$1,100
State:
$1,518
Percentage of individuals using paid preparers for their 2004 taxes: 66.3%
Here:
66%
State:
58%
(% for various income ranges: 61.1% for AGIs below $10k, 61.5% for AGIs $10k-25k, 65.7% for AGIs $25k-50k, 65.7% for AGIs $50k-75k, 62.8% for AGIs $75k-100k, 73.2% for AGIs over 100k)
Likely homosexual households (counted as self-reported same-sex unmarried-partner households)
Lesbian couples: 0.0% of all households
Gay men: 0.5% of all households
Household received Food Stamps/SNAP in the past 12 months: 232 Household did not receive Food Stamps/SNAP in the past 12 months: 5,735
Women who had a birth in the past 12 months: 146 (153 now married, 0 unmarried) Women who did not have a birth in the past 12 months: 2,914 (1,453 now married, 1,436 unmarried)
Housing units in zip code 01106 with a mortgage: 3,569 (544 second mortgage, 12 home equity loan, 490 both second mortgage and home equity loan) Houses without a mortgage: 102
Median monthly owner costs for units with a mortgage: $2,764 Median monthly owner costs for units without a mortgage: $1,244
Residents with income below the poverty level in 2022:
This zip code:
4.0%
Whole state:
10.4%
Residents with income below 50% of the poverty level in 2022:
This zip code:
1.7%
Whole state:
5.1%
Median number of rooms in houses and condos:
Here:
7.6
State:
6.5
Median number of rooms in apartments:
Here:
4.5
State:
4.0
Notable locations in this zip code not listed on our city pages
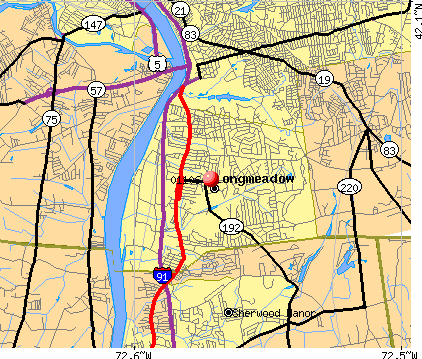
Notable locations in zip code 01106: Field Club of Longmeadow (A), Twin Hills Country Club (B), Longmeadow Country Club (C), Longmeadow Plaza (D), Longmeadow Shops (E), Maple Center (F), Franconia Golf Course (G), Longmeadow Fire Department (H), Wolf Swamp Road School Library (I), Center School Library (J), Frank and Marian Hatch Library (K), Longmeadow Town Hall (L). Display/hide their locations on the map
Shopping Centers: Longmeadow Mall Shopping Center (1), Longmeadow Shops Shopping Center (2), Maple Center Shopping Center (3), Williams Place Shopping Mall Shopping Center (4), Trading Post Shopping Center (5). Display/hide their locations on the map
Churches in zip code 01106 include: Saint Andrews Episcopal Church (A), First Unitarian Universalist Church (B), First Church of Christ Scientist (C), First Church of Christ (D). Display/hide their locations on the map
Parks in zip code 01106 include: Turner Park (1), Greenwood Park (2), Laurel Park (3), Longmeadow Historic District (4), Bliss Park (5), Williams Street Playground (6), East Park (7), Fannie Stebbins Wildlife Refuge (8). Display/hide their locations on the map
In group quarters: 542 (-1 institutionalized population)
Size of family households: 1,670 2-persons, 1,052 3-persons, 962 4-persons, 409 5-persons, 121 6-persons, 47 7-or-more-persons
Size of nonfamily households: 1,573 1-person, 196 2-persons, 29 3-persons
3,133 married couples with children.
464 single-parent households (25 men, 439 women).
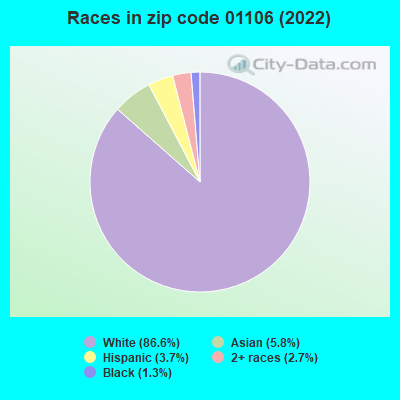
86.6% of residents of 01106 zip code speak English at home.
2.1% of residents speak Spanish at home (78% very well, 5% well, 16% not well).
7.9% of residents speak other Indo-European language at home (78% very well, 10% well, 11% not well, 1% not at all).
2.4% of residents speak Asian or Pacific Island language at home (68% very well, 9% well, 15% not well, 8% not at all).
0.9% of residents speak other language at home (86% very well, 9% well, 5% not well).
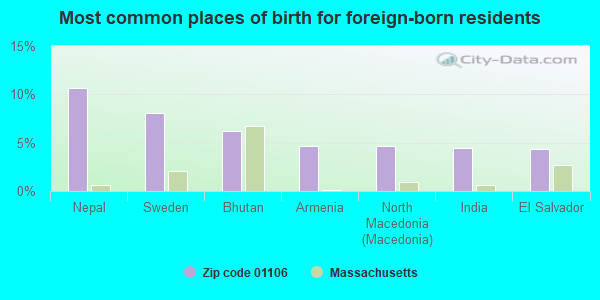
Foreign born population: 2,160 (13.5%) (83.7% of them are naturalized citizens)
This zip code:
13.5%
Whole state:
18.0%
11%Nepal
8%Sweden
6%Bhutan
5%Armenia
5%North Macedonia (Macedonia)
4%India
4%El Salvador
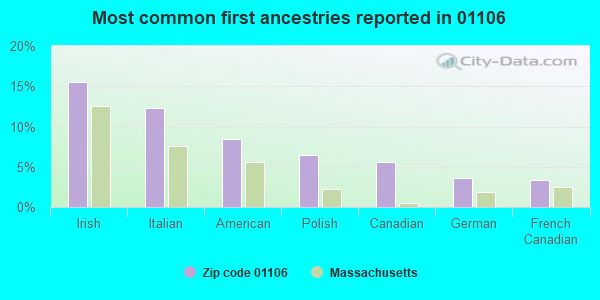
16%Irish
12%Italian
8%American
6%Polish
6%Canadian
4%German
3%French Canadian
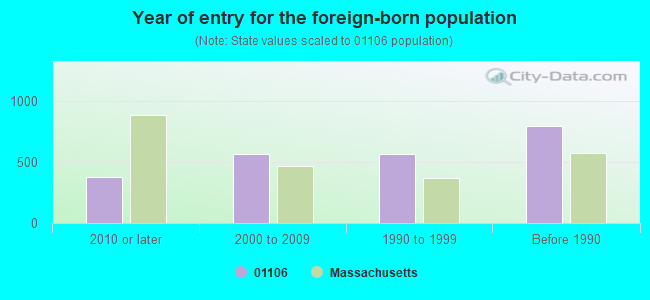
Year of entry for the foreign-born population
3752010 or later
5662000 to 2009
5631990 to 1999
798Before 1990
Facilities with environmental interests located in this zip code:
LONGMEADOW HIGH SCHOOL (95 GRASSY GUTTER RD in LONGMEADOW, MA)
AIR MINOR (AIRS/AFS) (National Center for Education Statistics) - STATE ID-159505 CRITERIA AND HAZARDOUS AIR POLLUTANT INVENTORY (Inventory of air pollution sources) Business SIC classification: ELEMENTARY AND SECONDARY SCHOOLS Alternative names: LONGMEADOW PUB. SCHL
LONGMEADOW WILLIAMS (410 WILLIAMS STREET in LONGMEADOW, MA)
AIR MINOR (AIRS/AFS) (National Center for Education Statistics) - STATE ID-159305 CRITERIA AND HAZARDOUS AIR POLLUTANT INVENTORY (Inventory of air pollution sources) Business SIC classification: ELEMENTARY AND SECONDARY SCHOOLS Alternative names: LONGMEADOW PUB. SCHL, WILLIAMS MIDDLE
LONGMEADOW FIRE DEPARTMENT (44 WILLIAMS ST in LONGMEADOW, MA)
STATE MASTER (MA-EPICS) - RCRAINFO-MV4135673357, HAZARDOUS WASTE PROGRAM Conditionally Exempt Small Quantity Generators, less than 100 kg/month of hazardous waste (Resource Conservation and Recovery Act (tracking hazardous waste)) - notification Organizations: LONGMEADOW TOWN OF FIRE DEPT (CONTACT/OPERATOR)
, TOWN OF LONGMEADOW MA (CONTACT/OWNER)
Alternative names: LONGMEADOW TOWN OF FIRE DEPT
LONGMEADOW RECYCLING CENTER (31 PONDS SIDE ROAD in LONGMEADOW, MA)
AIR MINOR (AIRS/AFS) - ICIS-, ENFORCEMENT/COMPLIANCE ACTIVITY ENFORCEMENT/COMPLIANCE ACTIVITY (Integrated Compliance Information System) Business SIC classification: NONCLASSIFIABLE ESTABLISHMENTS
BLUEBERRY HILL (275 BLUEBERRY HILL RD in LONGMEADOW, MA)
(National Center for Education Statistics) - STATE ID-159005 Organizations: LONGMEADOW (SCHOOL DISTRICT)
NEW ENGLAND TELE (450 LONGMEADOW in LONGMEADOW, MA)
(Resource Conservation and Recovery Act (tracking hazardous waste))
KIM CLEANERS (7-9 PEARL ST in SPRINGFIELD, MA)
(Resource Conservation and Recovery Act (tracking hazardous waste)) Organizations: YOUNG K KIM (CONTACT/OWNER)
BAY PATH JUNIOR COLLEGE (588 LONGMEADOW ST in LONGMEADOW, MA)
Conditionally Exempt Small Quantity Generators, less than 100 kg/month of hazardous waste (Resource Conservation and Recovery Act (tracking hazardous waste)) - notification
LONGMEADOW (20 WILLIAM STREET in LONGMEADOW, MA)
AIR MINOR (AIRS/AFS) Business SIC classification: GENERAL GOVERNMENT Alternative names: TOWN HALL
LONGMEADOW TOWN OF (257 EMERSON RD in LONGMEADOW, MA)
Conditionally Exempt Small Quantity Generators, less than 100 kg/month of hazardous waste (Resource Conservation and Recovery Act (tracking hazardous waste)) - notification Organizations: TOWN OF LONGMEADOW (CONTACT/OWNER)
Housing units lacking complete plumbing facilities: 0.5% Housing units lacking complete kitchen facilities: 1.0%
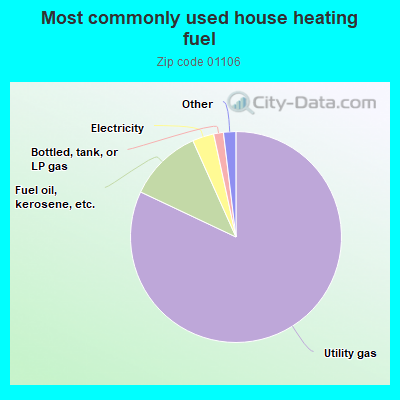
82.1%Utility gas
11.3%Fuel oil, kerosene, etc.
3.3%Electricity
1.5%Bottled, tank, or LP gas
0.8%No fuel used
0.6%Wood
Population in 1990: 15,688. Population change in the 1990s: +194 (+1.2%).
Place of birth for U.S.-born residents:
This state: 8,598
Northeast: 3,568
Midwest: 519
South: 631
West: 292
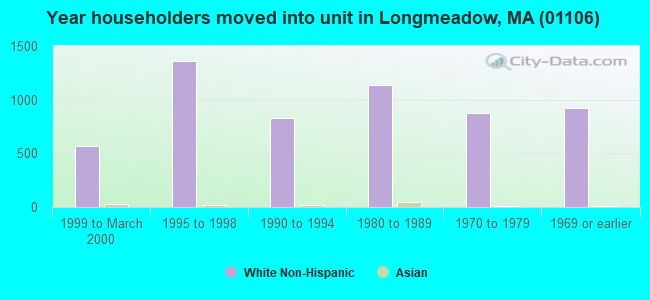
66% of the 01106 zip code residents lived in the same house 5 years ago. Out of people who lived in different houses, 66% lived in this county. Out of people who lived in different counties, 50% lived in Massachusetts.
91% of the 01106 zip code residents lived in the same house 1 year ago. Out of people who lived in different houses, 37% moved from this county. Out of people who lived in different houses, 25% moved from different county within same state. Out of people who lived in different houses, 34% moved from different state. Out of people who lived in different houses, 6% moved from abroad.
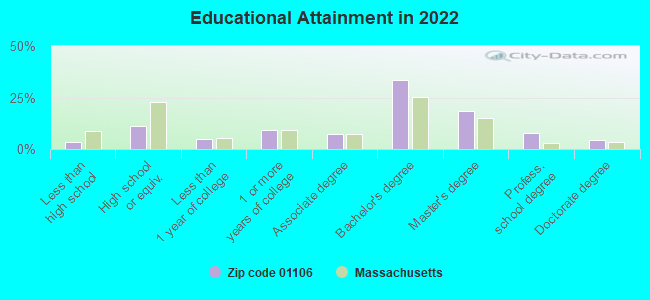
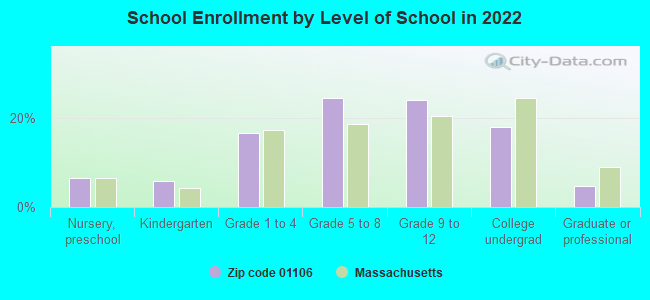
Private vs. public school enrollment:
Students in private schools in grades 1 to 8 (elementary and middle school): 73
Here:
4.5%
Massachusetts:
10.3%
Students in private schools in grades 9 to 12 (high school): 12
Here:
1.3%
Massachusetts:
12.3%
Students in private undergraduate colleges: 473
Here:
66.2%
Massachusetts:
51.2%
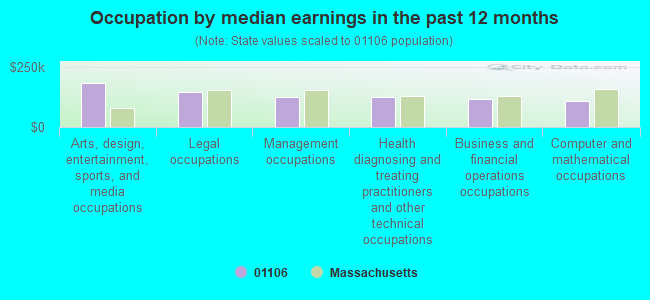
Occupation by median earnings in the past 12 months ($)
182,641Arts, design, entertainment, sports, and media occupations
143,866Legal occupations
125,901Management occupations
124,675Health diagnosing and treating practitioners and other technical occupations
117,872Business and financial operations occupations
106,374Computer and mathematical occupations
Companies with federal contracts located in this zip code:
MLSUSA CORP (164 FARMINGTON RD in LONGMEADOW, MA) : $847,903 in 23 contractsfrom 2004 to 2005
Contracts for Logistics Support Services, Other Professional Services, Other Management Support Services by Navy Signed by year:2000: $0; 2001: $0; 2002: $0; 2003: $0; 2004: $58,180; 2005: $789,723; 2006: $0.
Biggest contracts:
$689,318 with Navy for Logistics Support Services. Taking place in NY. Signed on 2005-02-18. Completion date: 2005-06-30.
$49,210 with Navy for Other Professional Services. Taking place in NY. Signed on 2005-05-18. Completion date: 2005-06-03.
$35,391 with Navy for Other Management Support Services. Signed on 2004-03-17. Completion date: 2004-03-22.
$27,575 with Navy for Logistics Support Services. Taking place in MS. Signed on 2005-01-21. Completion date: 2005-01-26.
MRT INC (140 LONGVIEW DRIVE in LONGMEADOW, MA; small business) : $551,796 in 31 contractsfrom 2002 to 2005
Contracts for Guns, through 30 mm, Nails, Machine Keys, and Pins, Hand Tools, Nonedged, Nonpowered, Aircraft Maintenance and Repair Shop Specialized Equipment, and moreby Defense Logistics Agency, Army, Navy Signed by year:2000: $0; 2001: $0; 2002: $25,912; 2003: $39,718; 2004: $503,156; 2005: -$16,990; 2006: $0.
Biggest contracts:
$83,500 with Defense Logistics Agency for Guns, through 30 mm. Signed on 2004-10-01. Completion date: 2005-09-30.
$83,500, same as above.Signed on 2004-03-10. Completion date: 2004-09-06.
$68,320, same as above.Signed on 2004-01-23. Completion date: 2004-06-21.
$48,276, same as above.Signed on 2004-09-03. Completion date: 2004-12-02.
Top industries in this zip code by the number of employees in 2005:
2002 - 2018 National Fire Incident Reporting System (NFIRS) incidents
Based on the data from the years 2002 - 2018 the average number of fires per year is 40. The highest number of reported fires - 53 took place in 2002, and the least - 25 in 2017. The data has a decreasing trend.
When looking into fire subcategories, the most reports belonged to: Structure Fires (47.9%), and Outside Fires (29.0%).
Fire incident types reported to NFIRS in Zip Code 01106


 Nearest zip codes: 01108, 01105, 01001, 01103, 01118, 06082.


 Based on the data from the years 2002 - 2018 the average number of fires per year is 40. The highest number of reported fires - 53 took place in 2002, and the least - 25 in 2017. The data has a decreasing trend.
 When looking into fire subcategories, the most reports belonged to: Structure Fires (47.9%), and Outside Fires (29.0%).