Springfield, Massachusetts
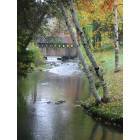
Springfield: Springfield park2

Springfield: Sunrise over Springfield by Joe C.

Springfield: Sprigfield City Hall 4th of July by Joe C
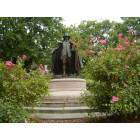
Springfield: Deacon Samuel Chapin "The Puritan"
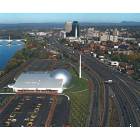
Springfield: Downtown Springfield Overlooking the Basketball Hall of Fame

Springfield: Springfield park

Springfield: Fingers of God 1
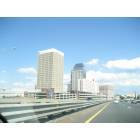
Springfield: Skyline, as seen from the fastlane
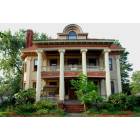
Springfield: The Lathrop House B&B at 188 Sumner Avenue, in Springfield, MA's Historic Forest Park Heights

Springfield: Hillside Cemetery
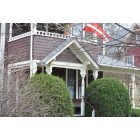
Springfield: 121 Harvard Street
- see
28
more - add
your
Submit your own pictures of this city and show them to the world
- OSM Map
- General Map
- Google Map
- MSN Map
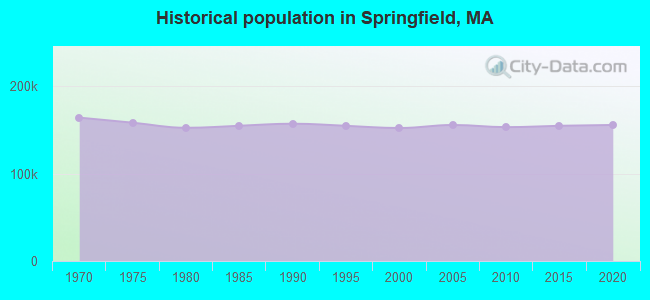
Population change since 2000: +1.3%
 |
| Males: 74,998 | |
| Females: 79,066 |
| Median resident age: | 33.9 years |
| Massachusetts median age: | 40.3 years |
Zip codes: 01103, 01104, 01105, 01107, 01108, 01109, 01118, 01119, 01128, 01129, 01151, 01199.
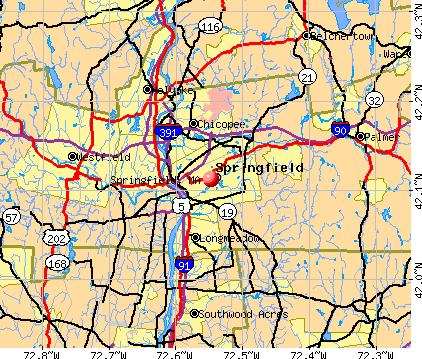
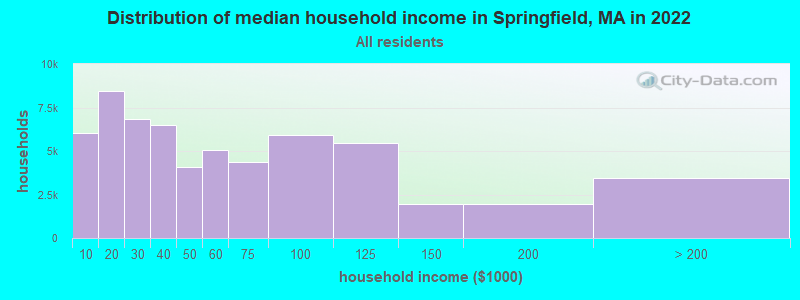
Springfield Zip Code Map| Springfield: | $44,286 |
| MA: | $94,488 |
Estimated per capita income in 2022: $26,431 (it was $15,232 in 2000)
Springfield city income, earnings, and wages data
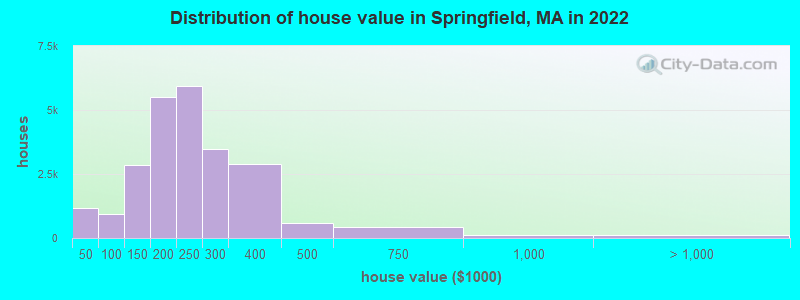
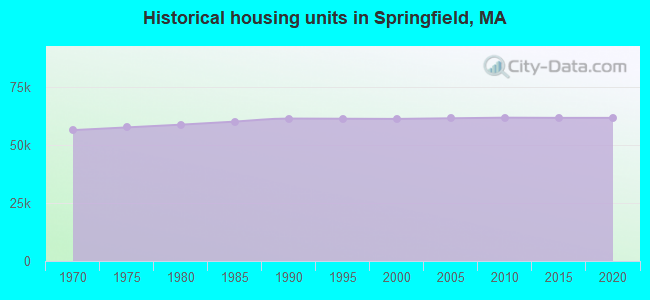
Estimated median house or condo value in 2022: $226,700 (it was $86,500 in 2000)
| Springfield: | $226,700 |
| MA: | $534,700 |
Mean prices in 2022: all housing units: $243,855; detached houses: $262,257; townhouses or other attached units: $175,492; in 2-unit structures: $191,333; in 3-to-4-unit structures: $146,694; in 5-or-more-unit structures: $161,557; mobile homes: $98,268
Median gross rent in 2022: $1,019.
(14.1% for White Non-Hispanic residents, 22.2% for Black residents, 32.1% for Hispanic or Latino residents, 17.8% for American Indian residents, 33.0% for other race residents, 34.2% for two or more races residents)
Detailed information about poverty and poor residents in Springfield, MA


- 75,98849.3%Hispanic
- 40,83126.5%White alone
- 27,99218.2%Black alone
- 5,1113.3%Asian alone
- 3,8292.5%Two or more races
- 2970.2%Other race alone
- 100.01%American Indian alone
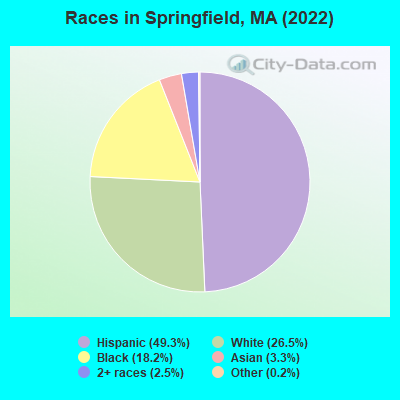
Races in Springfield detailed stats: ancestries, foreign born residents, place of birth
According to our research of Massachusetts and other state lists, there were 314 registered sex offenders living in Springfield, Massachusetts as of April 27, 2024.
The ratio of all residents to sex offenders in Springfield is 491 to 1.
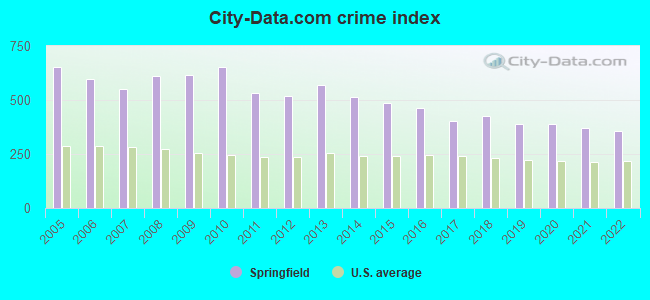
The City-Data.com crime index weighs serious crimes and violent crimes more heavily. Higher means more crime, U.S. average is 246.1. It adjusts for the number of visitors and daily workers commuting into cities.
- means the value is smaller than the state average.- means the value is about the same as the state average.
- means the value is bigger than the state average.
- means the value is much bigger than the state average.
Crime rate in Springfield detailed stats: murders, rapes, robberies, assaults, burglaries, thefts, arson
Full-time law enforcement employees in 2021, including police officers: 574 (465 officers - 405 male; 60 female).
| Officers per 1,000 residents here: | 3.02 |
| Massachusetts average: | 2.53 |
 Recent articles from our blog. Our writers, many of them Ph.D. graduates or candidates, create easy-to-read articles on a wide variety of topics.

 | Springfield sees record number of homicides for 2023 (27 replies) |
| Three people shot, two dead (including a 10-year-old girl) in Springfield. (10 replies) |
| Why is Worcester doing so much better than Springfield? (13 replies) |
| Family renting, Greater Springfield area (3 replies) |
| What happened to Springfield? (67 replies) |
| Nice Neighborhoods Near Springfield (108 replies) |
Latest news from Springfield, MA collected exclusively by city-data.com from local newspapers, TV, and radio stations
Springfield, MA City Guides:
Ancestries: American (5.6%), Jamaican (3.8%), Irish (3.0%), Italian (2.8%), French (1.5%), Polish (1.2%).
Current Local Time: EST time zone
Elevation: 70 feet
Land area: 32.1 square miles.
Population density: 4,799 people per square mile (average).
16,345 residents are foreign born (6.0% Latin America, 2.2% Asia, 1.1% Africa).
| This city: | 10.6% |
| Massachusetts: | 17.6% |
Median real estate property taxes paid for housing units with mortgages in 2022: $3,439 (1.5%)
Median real estate property taxes paid for housing units with no mortgage in 2022: $3,391 (1.6%)
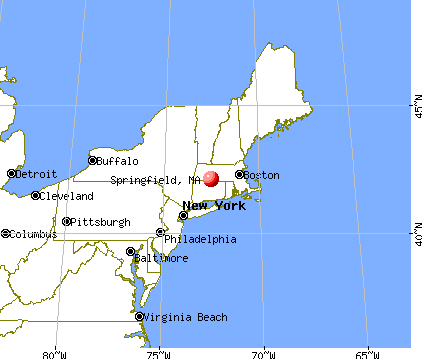
Nearest city with pop. 200,000+: Boston, MA  (76.1 miles , pop. 589,141).
Nearest city with pop. 1,000,000+: Bronx, NY (111.3 miles , pop. 1,332,650).
Nearest cities:
), ), ), )Latitude: 42.11 N, Longitude: 72.55 W
Daytime population change due to commuting: +12,006 (+7.8%)
Workers who live and work in this city: 36,870 (56.1%)
Area code: 413

Detailed articles:
Detailed articles:
- Springfield: Introduction
- Springfield Basic Facts
- Springfield: Introduction
- Springfield Basic Facts
- Springfield: Communications
- Springfield: Convention Facilities
- Springfield: Economy
- Springfield: Education and Research
- Springfield: Geography and Climate
- Springfield: Health Care
- Springfield: History
- Springfield: Municipal Government
- Springfield: Population Profile
- Springfield: Recreation
- Springfield: Transportation
Springfield tourist attractions:
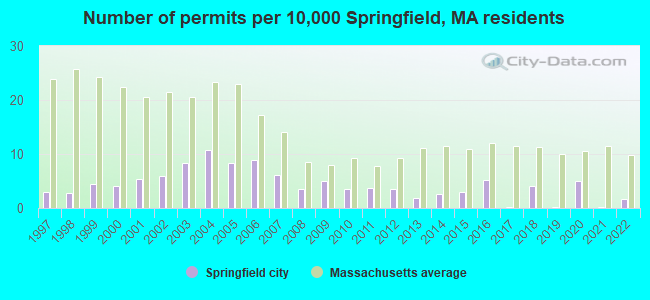
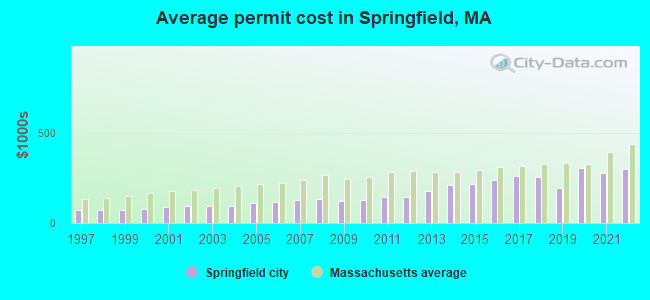
Single-family new house construction building permits:
- 2022: 24 buildings, average cost: $298,900
- 2021: 3 buildings, average cost: $275,800
- 2020: 77 buildings, average cost: $303,500
- 2019: 4 buildings, average cost: $191,700
- 2018: 63 buildings, average cost: $255,400
- 2017: 4 buildings, average cost: $258,400
- 2016: 79 buildings, average cost: $239,500
- 2015: 44 buildings, average cost: $214,400
- 2014: 39 buildings, average cost: $208,000
- 2013: 27 buildings, average cost: $175,500
- 2012: 53 buildings, average cost: $144,600
- 2011: 55 buildings, average cost: $144,600
- 2010: 54 buildings, average cost: $126,400
- 2009: 75 buildings, average cost: $119,900
- 2008: 54 buildings, average cost: $132,200
- 2007: 94 buildings, average cost: $126,100
- 2006: 135 buildings, average cost: $118,300
- 2005: 126 buildings, average cost: $109,700
- 2004: 163 buildings, average cost: $95,900
- 2003: 126 buildings, average cost: $93,400
- 2002: 90 buildings, average cost: $94,200
- 2001: 83 buildings, average cost: $88,200
- 2000: 62 buildings, average cost: $77,400
- 1999: 68 buildings, average cost: $73,200
- 1998: 42 buildings, average cost: $73,200
- 1997: 46 buildings, average cost: $72,800
| Here: | 5.8% |
| Massachusetts: | 3.5% |
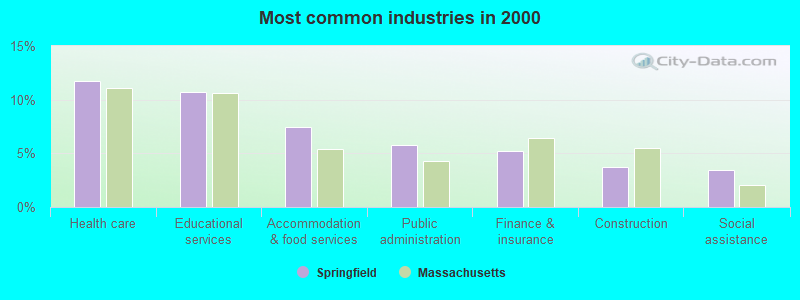
- Health care (11.7%)
- Educational services (10.7%)
- Accommodation & food services (7.4%)
- Public administration (5.8%)
- Finance & insurance (5.2%)
- Construction (3.8%)
- Social assistance (3.4%)
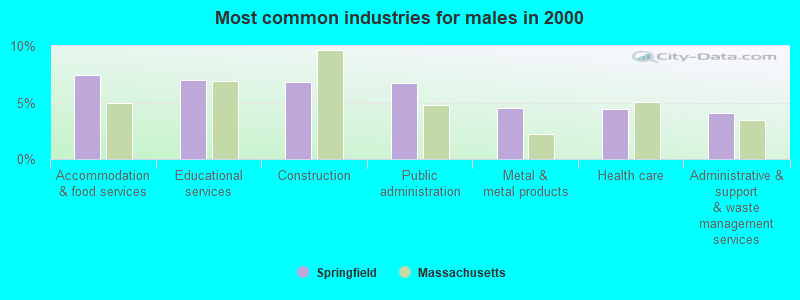
- Accommodation & food services (7.4%)
- Educational services (7.0%)
- Construction (6.8%)
- Public administration (6.7%)
- Metal & metal products (4.5%)
- Health care (4.5%)
- Administrative & support & waste management services (4.0%)
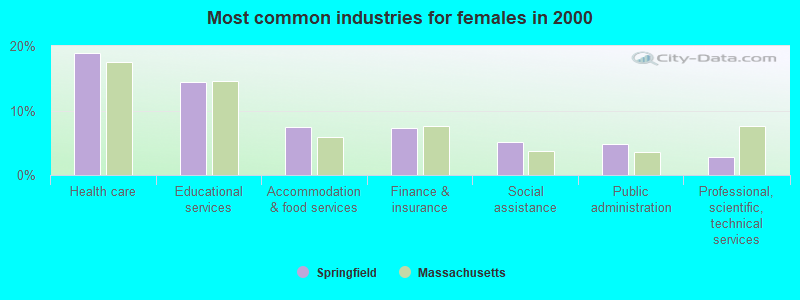
- Health care (18.9%)
- Educational services (14.4%)
- Accommodation & food services (7.4%)
- Finance & insurance (7.3%)
- Social assistance (5.2%)
- Public administration (4.8%)
- Professional, scientific, technical services (2.8%)
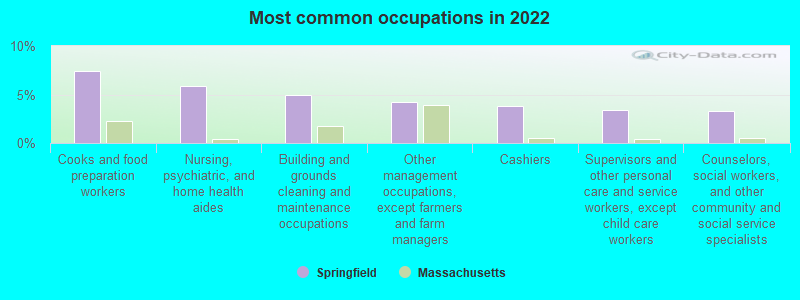
- Cooks and food preparation workers (7.4%)
- Nursing, psychiatric, and home health aides (5.9%)
- Building and grounds cleaning and maintenance occupations (5.0%)
- Other management occupations, except farmers and farm managers (4.2%)
- Cashiers (3.8%)
- Supervisors and other personal care and service workers, except child care workers (3.4%)
- Counselors, social workers, and other community and social service specialists (3.2%)
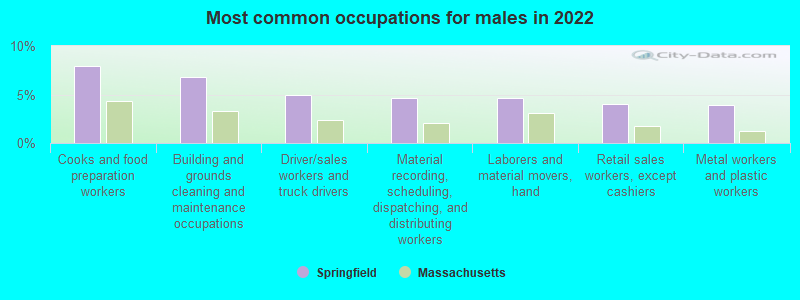
- Cooks and food preparation workers (7.9%)
- Building and grounds cleaning and maintenance occupations (6.8%)
- Driver/sales workers and truck drivers (5.0%)
- Material recording, scheduling, dispatching, and distributing workers (4.6%)
- Laborers and material movers, hand (4.6%)
- Retail sales workers, except cashiers (4.0%)
- Metal workers and plastic workers (3.9%)
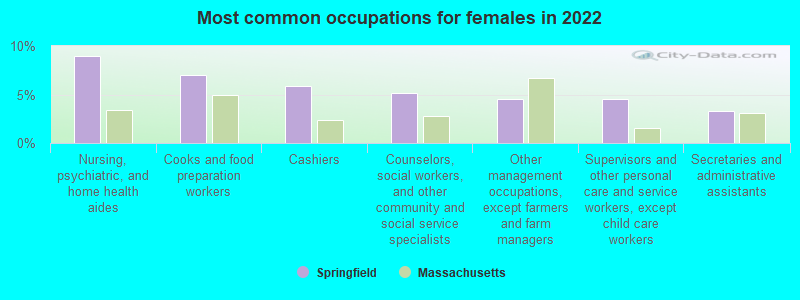
- Nursing, psychiatric, and home health aides (9.0%)
- Cooks and food preparation workers (7.0%)
- Cashiers (5.9%)
- Counselors, social workers, and other community and social service specialists (5.2%)
- Other management occupations, except farmers and farm managers (4.6%)
- Supervisors and other personal care and service workers, except child care workers (4.6%)
- Secretaries and administrative assistants (3.3%)
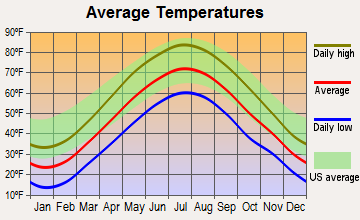
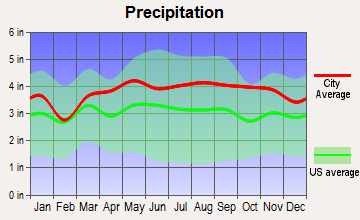
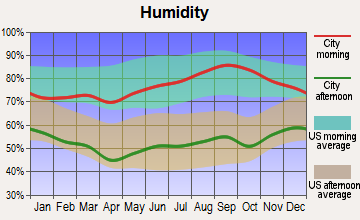
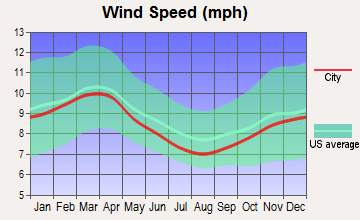
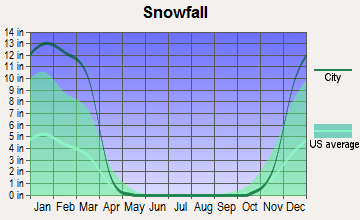
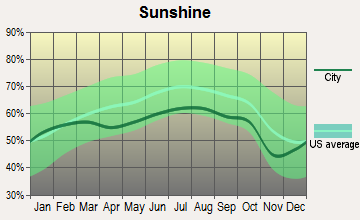
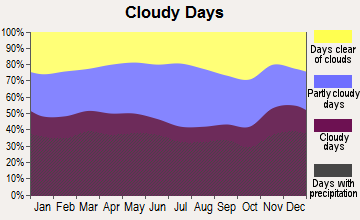
Average climate in Springfield, Massachusetts
Based on data reported by over 4,000 weather stations
|
|

(lower is better)
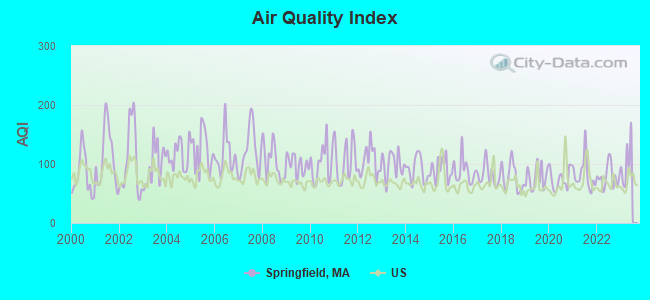
Air Quality Index (AQI) level in 2022 was 78.6. This is about average.
| City: | 78.6 |
| U.S.: | 72.6 |
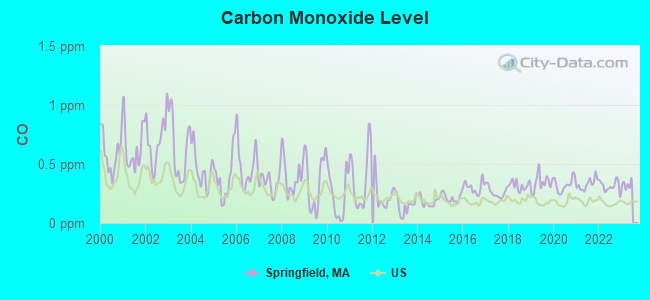
Carbon Monoxide (CO) [ppm] level in 2022 was 0.312. This is worse than average. Closest monitor was 2.0 miles away from the city center.
| City: | 0.312 |
| U.S.: | 0.251 |
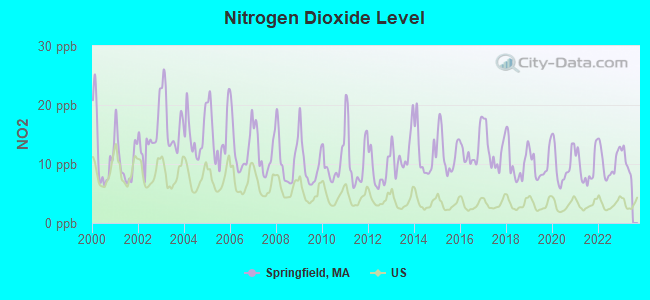
Nitrogen Dioxide (NO2) [ppb] level in 2022 was 10.3. This is significantly worse than average. Closest monitor was 1.7 miles away from the city center.
| City: | 10.3 |
| U.S.: | 5.1 |
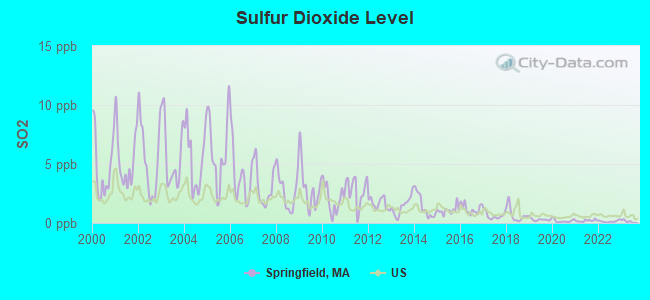
Sulfur Dioxide (SO2) [ppb] level in 2022 was 0.141. This is significantly better than average. Closest monitor was 1.8 miles away from the city center.
| City: | 0.141 |
| U.S.: | 1.515 |
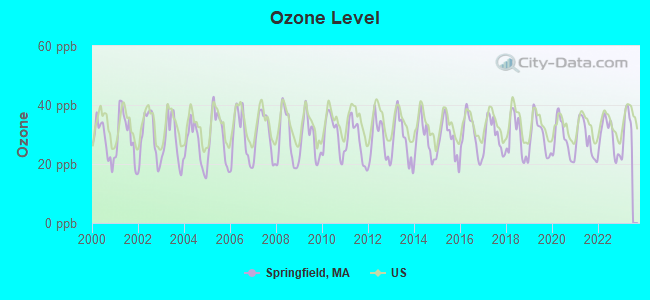
Ozone [ppb] level in 2022 was 29.2. This is about average. Closest monitor was 2.9 miles away from the city center.
| City: | 29.2 |
| U.S.: | 33.3 |
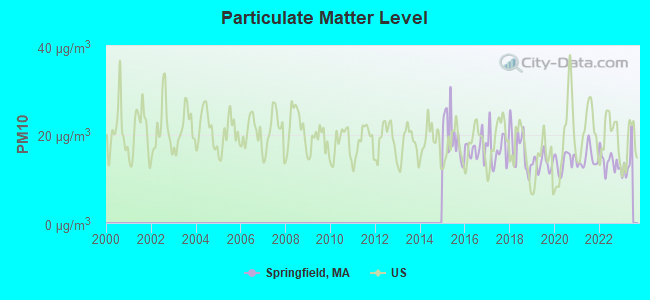
Particulate Matter (PM10) [µg/m3] level in 2022 was 13.8. This is better than average. Closest monitor was 2.2 miles away from the city center.
| City: | 13.8 |
| U.S.: | 19.2 |
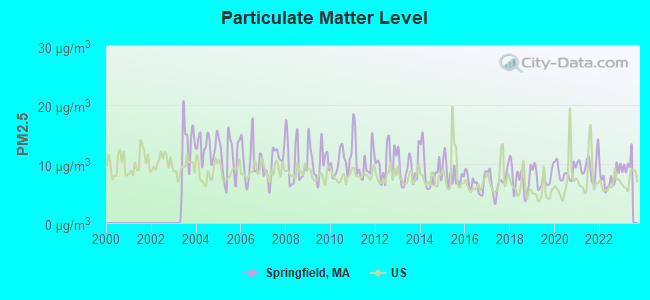
Particulate Matter (PM2.5) [µg/m3] level in 2022 was 7.65. This is about average. Closest monitor was 2.0 miles away from the city center.
| City: | 7.65 |
| U.S.: | 8.11 |
Tornado activity:
Springfield-area historical tornado activity is above Massachusetts state average. It is 9% smaller than the overall U.S. average.
On 10/3/1979, a category F4 (max. wind speeds 207-260 mph) tornado 8.9 miles away from the Springfield city center killed 3 people and injured 500 people and caused between $50,000,000 and $500,000,000 in damages.
On 6/9/1953, a category F4 tornado 31.4 miles away from the city center killed 90 people and injured 1228 people and caused between $50,000,000 and $500,000,000 in damages.
Earthquake activity:
Springfield-area historical earthquake activity is significantly above Massachusetts state average. It is 70% smaller than the overall U.S. average.On 10/7/1983 at 10:18:46, a magnitude 5.3 (5.1 MB, 5.3 LG, 5.1 ML, Class: Moderate, Intensity: VI - VII) earthquake occurred 156.3 miles away from Springfield center
On 4/20/2002 at 10:50:47, a magnitude 5.3 (5.3 ML, Depth: 3.0 mi) earthquake occurred 175.8 miles away from Springfield center
On 4/20/2002 at 10:50:47, a magnitude 5.2 (5.2 MB, 4.2 MS, 5.2 MW, 5.0 MW) earthquake occurred 174.5 miles away from Springfield center
On 1/19/1982 at 00:14:42, a magnitude 4.7 (4.5 MB, 4.7 MD, 4.5 LG, Class: Light, Intensity: IV - V) earthquake occurred 107.3 miles away from the city center
On 10/16/2012 at 23:12:25, a magnitude 4.7 (4.7 ML, Depth: 10.0 mi) earthquake occurred 140.5 miles away from the city center
On 8/23/2011 at 17:51:04, a magnitude 5.8 (5.8 MW, Depth: 3.7 mi) earthquake occurred 407.3 miles away from Springfield center
Magnitude types: regional Lg-wave magnitude (LG), body-wave magnitude (MB), duration magnitude (MD), local magnitude (ML), surface-wave magnitude (MS), moment magnitude (MW)
Natural disasters:
The number of natural disasters in Hampden County (22) is greater than the US average (15).Major Disasters (Presidential) Declared: 12
Emergencies Declared: 9
Causes of natural disasters: Storms: 6, Floods: 5, Hurricanes: 5, Snowstorms: 4, Winter Storms: 4, Blizzards: 2, Snows: 2, Snowfall: 1, Tornado: 1, Tropical Storm: 1, Wind: 1, Other: 1 (Note: some incidents may be assigned to more than one category).
Main business address for: SMITH & WESSON HOLDING CORP (ORDNANCE & ACCESSORIES, (NO VEHICLES/GUIDED MISSILES)), NORTHEAST UTILITIES (ELECTRIC SERVICES).
Hospitals in Springfield:
- BAYSTATE MEDICAL CENTER (Voluntary non-profit - Private, provides emergency services, 759 CHESTNUT STREET)
- MERCY MEDICAL CENTER (Voluntary non-profit - Private, 271 CAREW STREET)
- SPRINGFIELD MUN HOSP (1400 STATE ST)
Nursing Homes in Springfield:
- CHAPIN CENTER (200 KENDALL STREET)
- CRESCENT HILL NURSING CENTER (370 PINE ST)
- MARATHON HEALTHCARE CENTER OF SPRINGFIELD (370 PINE STREET)
- OLYMPUS SPECIALITY HOSP TCU - OLD (1400 STATE STREET)
- REEDS LANDING NURSING CENTER (807 WILBRAHAM ROAD)
- RING NURSING HOME RIDGEWOOD (22 RIDGEWOOD PLACE)
- RING NURSING HOME SOUTH (155 MILL STREET)
- SPRUCE MANOR NURSING HOME (388 CENTRAL ST)
- SUMMERFIELD PINE MANOR NH (1190 LIBERTY ST)
- WELDON TCU AT THE MERCY HOSPITAL, INC (271 CAREW STREET, 4TH FLOOR)
Dialysis Facilities in Springfield:
- EAST SPRINGFIELD DIALYSIS (BMA OF MASSACHUSETTS) (435 COTTAGE STREET)
- SPRINGFIELD DIALYSIS CENTER (125 LIBERTY STREET, SUITE 101)
- WESTERN MASS. KIDNEY CENTER (BMA SPRINGFIELD) (2000 MAIN STREET)
Home Health Centers in Springfield:
- BAYSTATE VISITING NURSE ASSOCIATION AND HOSPICE (50 MAPLE STREET, P O BOX 9058)
- GENTIVA HEALTH SERVICES (2073 ROOSEVELT AVENUE)
- HAMPDEN COUNTY VISITING NURSES AND HOME CARE SERV (110 FORT PLEASANT AVENUE)
- INTERNATIONAL HEALTH SOLUTIONS (604 COTTAGE STREET)
- MEDICAL WEST COMM HEALTH PLAN HC DEPT (354 BIRNIE AVE,)
- MULTICULTURAL COMMUNITY SERVICES OF PIONEER VALLEY (96 INDUSTRY AVENUE)
- QC MEDI-MA DBA KIMBERLY QUALITY CARE (2150 MAIN STREET)
- STAFF BUILDERS HOME HEALTH CARE (155 MAPLE ST SUITE 408)
Heliports located in Springfield:
See details about Heliports located in Springfield, MAAmtrak station:
SPRINGFIELD (66 LYMAN ST.) . Services: ticket office, partially wheelchair accessible, enclosed waiting area, public restrooms, public payphones, full-service food facilities, snack bar, vending machines, ATM, paid short-term parking, paid long-term parking, call for car rental service, taxi stand, intercity bus service, public transit connection.Colleges/Universities in Springfield:
- Springfield Technical Community College (Full-time enrollment: 4,750; Location: 1 Armory Sq; Public; Website: www.stcc.edu)
- Western New England University (Full-time enrollment: 3,477; Location: 1215 Wilbraham Rd; Private, not-for-profit; Website: www.wne.edu; Offers Doctor's degree)
- Springfield College (Full-time enrollment: 3,144; Location: 263 Alden St; Private, not-for-profit; Website: www.spfldcol.edu; Offers Doctor's degree)
- American International College (Full-time enrollment: 2,733; Location: 1000 State Street; Private, not-for-profit; Website: www.aic.edu; Offers Doctor's degree)
- Springfield College-School of Human Services (Full-time enrollment: 1,898; Location: Springfield College - School of Human Services; Private, not-for-profit; Website: www.spfldcol.edu/homepage/dept.nsf/shs; Offers Master's degree)
- Branford Hall Career Institute-Springfield Campus (Full-time enrollment: 711; Location: 112 Industry Avenue; Private, for-profit; Website: www.branfordhall.edu)
- Mansfield Beauty Schools-Springfield (Full-time enrollment: 32; Location: 266 Bridge St; Private, for-profit; Website: mansfieldbeautyschools.edu)
Other colleges/universities with over 2000 students near Springfield:
- Bay Path College (about 5 miles; Longmeadow, MA; Full-time enrollment: 2,085)
- Holyoke Community College (about 8 miles; Holyoke, MA; FT enrollment: 4,911)
- Mount Holyoke College (about 11 miles; South Hadley, MA; FT enrollment: 2,573)
- Westfield State University (about 13 miles; Westfield, MA; FT enrollment: 5,548)
- Smith College (about 15 miles; Northampton, MA; FT enrollment: 3,549)
- University of Massachusetts-Amherst (about 19 miles; Amherst, MA; FT enrollment: 26,583)
- University of Hartford (about 24 miles; West Hartford, CT; FT enrollment: 6,398)
Biggest public high schools in Springfield:
- SPRINGFIELD CENTRAL HIGH (Students: 1,985, Location: 1840 ROOSEVELT AVENUE, Grades: 9-12)
- SABIS INTERNATIONAL CHARTER SCHOOL (Students: 1,373, Location: 160 JOAN STREET, Grades: KG-12, Charter school)
- JOHN J DUGGAN MIDDLE (Students: 778, Location: 1015 WILBRAHAM RD, Grades: 6-9)
- HIGH SCHOOL OF COMMERCE (Students: 164, Location: 415 STATE STREET, Grades: 9-12)
- PHOENIX ACADEMY PUBLIC CHARTER HIGH SCHOOL SPRINGF (Location: 1 FEDERAL STREET, Grades: 9-12, Charter school)
- SPRINGFIELD HIGH SCHOOL OF SCIENCE AND TECHNOLOGY (Location: 1250 STATE STREET, Grades: 9-12)
- THE SPRINGFIELD RENAISSANCE SCHOOL AN EXPEDITIONAR (Location: 1170 CAREW STREET, Grades: 6-12)
- ROGER L. PUTNAM VOCATIONAL TECHNICAL ACADEMY (Location: 1300 STATE STREET, Grades: 9-12)
- SPRINGFIELD HIGH SCHOOL (Location: DICKENSON BLDG, 37 ALDERMAN ST, Grades: 9-12)
- LIBERTY PREPARATORY ACADEMY (Location: ALDERMAN BLDG, 37 ALDERMAN STR, Grades: 9-12)
Private high schools in Springfield:
- CATHEDRAL HIGH SCHOOL (Students: 345, Location: 260 SURREY RD, Grades: 9-12)
- PIONEER VALLEY CHRISTIAN SCHOOL (Students: 282, Location: 965 PLUMTREE RD, Grades: PK-12)
- CURTIS BLAKE DAY SCHOOL (Students: 64, Location: 979 DICKINSON ST, Grades: 2-9)
- MILL POND SCHOOL (Students: 19, Location: 91 OLD ACRE RD, Grades: 7-12)
Biggest public elementary/middle schools in Springfield:
- VAN SICKLE MIDDLE SCHOOL (Students: 1,135, Location: 1170 CAREW STREET, Grades: 6-8)
- FOREST PARK MIDDLE (Students: 1,041, Location: 46 OAKLAND STREET, Grades: 6-8)
- M MARCUS KILEY MIDDLE (Students: 939, Location: 180 COOLEY STREET, Grades: 6-8)
- REBECCA M JOHNSON (Students: 674, Location: 55 CATHERINE STREET, Grades: PK-5)
- JOHN F KENNEDY MIDDLE (Students: 616, Location: 1385 BERKSHIRE AVENUE, Grades: 6-8)
- FREDERICK HARRIS (Students: 605, Location: 58 HARTFORD TER, Grades: PK-5)
- DANIEL B BRUNTON (Students: 599, Location: 1801 PARKER STREET, Grades: KG-5)
- MILTON BRADLEY SCHOOL (Students: 595, Location: 22 MULBERRY STREET, Grades: PK-5)
- SUMNER AVENUE (Students: 498, Location: 45 SUMNER AVENUE, Grades: PK-5)
- ELIAS BROOKINGS (Students: 485, Location: 367 HANCOCK STREET, Grades: PK-5)
Private elementary/middle schools in Springfield:
- ST MICHAELS ACADEMY (Students: 230, Location: 153 EDDYWOOD ST, Grades: 6-8)
- ACADEMY HILL SCHOOL (Students: 109, Location: 1190 LIBERTY ST, Grades: KG-8)
- PIONEER VALLEY MONTESSORI SCHOOL (Students: 102, Location: 1524 PARKER ST, Grades: PK-6)
- SPRINGFIELD SDA JUNIOR ACADEMY (Students: 18, Location: 797 STATE ST, Grades: PK-8)
- KATHLEEN THORNTON SCHOOL (Students: 5, Location: 91 OLD ACRE RD, Grades: 4-7)
Library in Springfield:
User-submitted facts and corrections:
- WEIB-FM (106.3 FM; NORTHAMPTON, MA; Owner: CUTTING EDGE BROADCASTING INCORPORATED)
- WSHM 3 is Springfield Mass's CBS affiliate
- Dr. Seuss 3/2/1904-9/24/1991 Born in Springfield, MA. added by Myya
Points of interest:
Notable locations in Springfield: Memorial Industrial Park (A), Veterans Golf Course (B), Wells Block (C), Barrows Playground (D), Wight Playground (E), Walker Playground (F), George M Hendee Playground (G), Emily Bill Playground (H), J L Sullivan Playground (I), Springfield Plaza (J), Winchester Plaza (K), Five Town Plaza (L), Rockys Plaza (M), Babson Library (N), Baystate Medical Center Health Sciences Library (O), Bemis Hall (P), Berkshire Hall (Q), Beveridge Center (R), Adams Hall (S), Afro-American Cultural Center (T). Display/hide their locations on the map
Shopping Centers: Big D Plaza Shopping Center (1), Center Square Shopping Center (2), Eastfield Mall Shopping Center (3), Finast Shopping Center (4), Five Town Plaza Shopping Center (5), Marshalls Boston-Parker Plaza Shopping Center (6), One-Stop Shopping Center (7), Page Boulevard Mini-Mall Shopping Center (8), Riverdale Shops Shopping Center (9). Display/hide their locations on the map
Main business address in Springfield include: SMITH & WESSON HOLDING CORP (A), NORTHEAST UTILITIES (B). Display/hide their locations on the map
Churches in Springfield include: Zion Community Baptist Church (A), Word of Life Ministries Church (B), Whole Truth Temple (C), Wesley United Methodist Church (D), Wachogue Congregational Church (E), Victory Church (F), Universal Temple Family Church (G), United House of Prayer Church (H), Union Church (I). Display/hide their locations on the map
Cemeteries: Gate of Heaven Cemetery (1), Maplewood Cemetery (2), Hillcrest Park Cemetery (3), Sinai Memorial Park (4), Saint Aloysius Cemetery (5), Bay Path Cemetery (6), Saint Benedicts Cemetery (7). Display/hide their locations on the map
Lakes and reservoirs: Dimmock Pond (A), Venture Pond (B), Quarry Pond (C), Mona Lake (D), Lake Lorraine (E), Long Pond (F), Island Pond (G), Hogan Ponds (H). Display/hide their locations on the map
Streams, rivers, and creeks: Pecousic Brook (A), Entry Dingle Brook (B), Fuller Brook (C), Mill River (D), Schnelock Brook (E). Display/hide their locations on the map
Parks in Springfield include: Gunn Square (1), Winchester Square (2), Entry Dingle Park (3), Pynchon Park (4), Stebbins Park (5), Gurdon Bill Park (6), Calhoun Park (7), Goodwin Park (8), Federal Square (9). Display/hide their locations on the map
Tourist attractions: Basketball Hall of Fame (Museums; 1000 West Columbus Avenue) (1), Mass Commonwealth - Springfield District Court- Trial Courts- Hampden Law Lib (Cultural Attractions- Events- & Facilities; 50 State Street) (2), Indian Motocycle Museum Hall of Fame (Cultural Attractions- Events- & Facilities; 33 Hendee Street) (3), Forest Park Zoological Society (Cultural Attractions- Events- & Facilities; Pecousic Drive) (4), Italian Cultural Center (Cultural Attractions- Events- & Facilities; 11 Acushnet Avenue) (5), United States Government - Interior Dept- National Park Service (Recreation Areas; 1 Armory Square) (6). Display/hide their approximate locations on the map
Hotels: Marriott Springfield (2 Boland Way) (1), Peter's Grille (1 Monarch Place Suite 100) (2), Country Inn & Tavern - Country Western Lounge (339 Boston Road) (3), Blackjacks (1 Monarch Place) (4), Center Court (1 Monarch Place Suite 100) (5), Holiday Inn Springfield (711 Dwight Street) (6), Sheraton Springfield Monarch Place (1 Monarch Place) (7), River Inn (700 State) (8), Sheraton Springfield (1 Monarch Place Suite 100) (9). Display/hide their approximate locations on the map
Courts: Mass Commonwealth - Trial Courts- Springfield District Court- Juvenile C (80 State Street) (1), Mass Commonwealth - Trial Courts- Springfield District Court- Jury Commissi (50 State Street) (2), Mass Commonwealth - Trial Courts- Springfield District Court- Housing C (37 Elm Street) (3), Mass Commonwealth - Trial Courts- Springfield District Court- Superior C (50 State Street) (4), United States District Court (1550 Main Street) (5), Springfield Museums and Dr Seuss National Memorial - Libraries- Springfield City Lib (220 State Street) (6), Mass Commonwealth - Trial Courts- Springfield District Court- District Atto (50 State Street) (7), Mass Commonwealth - Trial Courts- Springfield District Court- Probate & Family C (50 State Street) (8), Mass Commonwealth - Trial Courts- Springfield District Court (50 State Street) (9). Display/hide their approximate locations on the map
Birthplace of: Dr. Seuss - Writer, Linda Perry - Female guitarist, Mike Scully - Writer and producer, Peter Welch - Congressman for Vermont, Donald Davidson (philosopher) - Philosopher, Mike Gravel - Politician, Robert B. Parker - Novelist, Robert Harold Davidson - Recipient of the Purple Heart medal, Timothy Leary - (1950-1996), author and LSD enthusiast, Oliver Edwards - Brevet major general in the Union Army during the Civil War.
Drinking water stations with addresses in Springfield and their reported violations in the past:
SPRINGFIELD WATER AND SEWER COMMISSION (Population served: 234,105, Surface water):Past monitoring violations:SILVER MEADOW (Address: 322 MAIN ST SUITE 1 , Population served: 40, Groundwater):
- Follow-up Or Routine LCR Tap M/R - In OCT-01-2005, Contaminant: Lead and Copper Rule. Follow-up actions: St AO (w/o penalty) issued (JAN-03-2006), St Compliance achieved (JAN-03-2006)
Past monitoring violations:
- One minor monitoring violation
- 2 regular monitoring violations
| This city: | 2.6 people |
| Massachusetts: | 2.5 people |
| This city: | 63.5% |
| Whole state: | 63.0% |
| This city: | 9.0% |
| Whole state: | 7.0% |
Likely homosexual households (counted as self-reported same-sex unmarried-partner households)
- Lesbian couples: 0.5% of all households
- Gay men: 0.4% of all households
People in group quarters in Springfield in 2010:
- 3,979 people in college/university student housing
- 553 people in nursing facilities/skilled-nursing facilities
- 242 people in other noninstitutional facilities
- 206 people in correctional residential facilities
- 168 people in emergency and transitional shelters (with sleeping facilities) for people experiencing homelessness
- 138 people in residential treatment centers for adults
- 132 people in group homes intended for adults
- 74 people in residential treatment centers for juveniles (non-correctional)
- 64 people in workers' group living quarters and job corps centers
- 57 people in group homes for juveniles (non-correctional)
- 35 people in correctional facilities intended for juveniles
- 29 people in mental (psychiatric) hospitals and psychiatric units in other hospitals
People in group quarters in Springfield in 2000:
- 3,215 people in college dormitories (includes college quarters off campus)
- 829 people in nursing homes
- 323 people in other noninstitutional group quarters
- 228 people in other types of correctional institutions
- 200 people in hospitals/wards and hospices for chronically ill
- 200 people in other hospitals or wards for chronically ill
- 123 people in wards in general hospitals for patients who have no usual home elsewhere
- 113 people in unknown juvenile institutions
- 88 people in homes for abused, dependent, and neglected children
- 86 people in homes or halfway houses for drug/alcohol abuse
- 83 people in homes for the mentally ill
- 77 people in religious group quarters
- 75 people in homes for the mentally retarded
- 41 people in short-term care, detention or diagnostic centers for delinquent children
- 26 people in schools, hospitals, or wards for the intellectually disabled
- 25 people in other group homes
Banks with most branches in Springfield (2011 data):
- TD Bank, National Association: 9 branches. Info updated 2010/10/04: Bank assets: $188,912.6 mil, Deposits: $153,149.8 mil, headquarters in Wilmington, DE, positive income, 1314 total offices, Holding Company: Toronto-Dominion Bank, The
- Bank of America, National Association: 7 branches. Info updated 2009/11/18: Bank assets: $1,451,969.3 mil, Deposits: $1,077,176.8 mil, headquarters in Charlotte, NC, positive income, 5782 total offices, Holding Company: Bank Of America Corporation
- RBS Citizens, National Association: Main Street, East Springfield Stop And Shop, Springfield Stop & Shop (S & S), Island Pond Branch, Springfield Cooley S&S Branch, Springfield Stop & Shop Branch. Info updated 2007/09/19: Bank assets: $106,940.6 mil, Deposits: $75,690.2 mil, headquarters in Providence, RI, positive income, 1135 total offices, Holding Company: Uk Financial Investments Limited
- PeoplesBank: Springfield Branch, Sumner Street Springfield Branch, St. James Avenue Branch, Wilbraham Road Branch. Info updated 2007/02/12: Bank assets: $1,653.1 mil, Deposits: $1,224.2 mil, headquarters in Holyoke, MA, positive income, Commercial Lending Specialization, 18 total offices, Holding Company: Peoplesbancorp, Mhc
- Hampden Bank: Allen Street Branch, Tower Square Branch, Boston Road Branch, at 19 Harrison Avenue. Info updated 2012/04/04: Bank assets: $563.1 mil, Deposits: $428.3 mil, local headquarters, positive income, Commercial Lending Specialization, 10 total offices, Holding Company: Hampden Bancorp, Inc.
- People's United Bank: The Bank Of Western Massachusetts Br, State Street Branch, Boston Road Branch. Info updated 2012/02/16: Bank assets: $27,319.3 mil, Deposits: $20,835.4 mil, headquarters in Bridgeport, CT, positive income, Commercial Lending Specialization, 374 total offices
- United Bank: St. James Avenue Branch, Wilbraham Road Branch, Downtown Branch. Info updated 2012/01/20: Bank assets: $1,617.9 mil, Deposits: $1,235.2 mil, headquarters in West Springfield, MA, positive income, Commercial Lending Specialization, 25 total offices
- Sovereign Bank, National Association: Springfield Main Branch at 1350 Main Street, branch established on 1872/01/01; Forest Park Branch at 590 Sumner Avenue, branch established on 1906/01/06. Info updated 2012/01/31: Bank assets: $78,146.9 mil, Deposits: $48,042.9 mil, headquarters in Wilmington, DE, positive income, Commercial Lending Specialization, 718 total offices, Holding Company: Banco Santander, S.A.
- Berkshire Bank: Springfield Branch at 1259 East Columbus Ave, branch established on 2009/11/14. Info updated 2011/08/24: Bank assets: $3,955.6 mil, Deposits: $3,176.2 mil, headquarters in Pittsfield, MA, positive income, Commercial Lending Specialization, 64 total offices
- 3 other banks with 3 local branches
For population 15 years and over in Springfield:
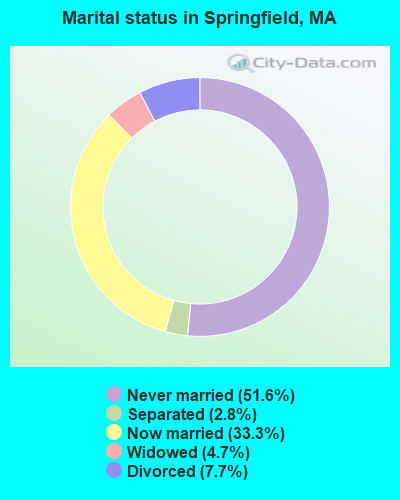
- Never married: 51.6%
- Now married: 33.3%
- Separated: 2.8%
- Widowed: 4.7%
- Divorced: 7.7%
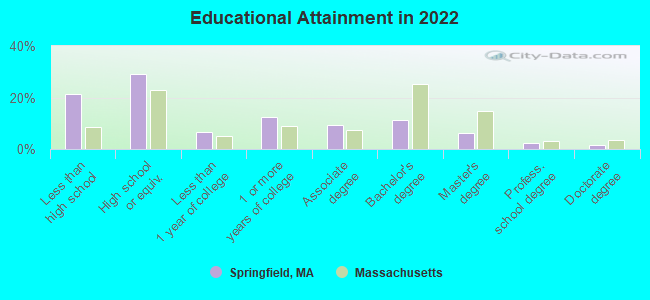
For population 25 years and over in Springfield:
- High school or higher: 78.6%
- Bachelor's degree or higher: 21.2%
- Graduate or professional degree: 9.8%
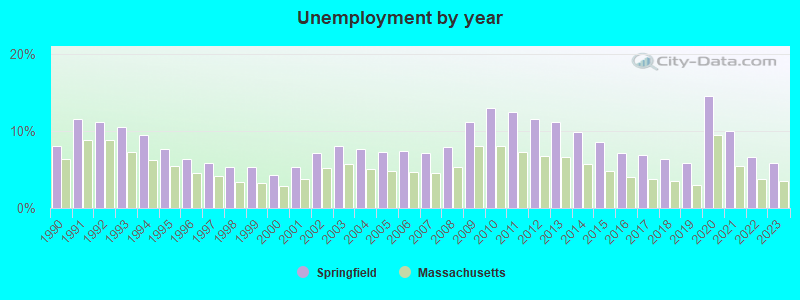
- Unemployed: 8.5%
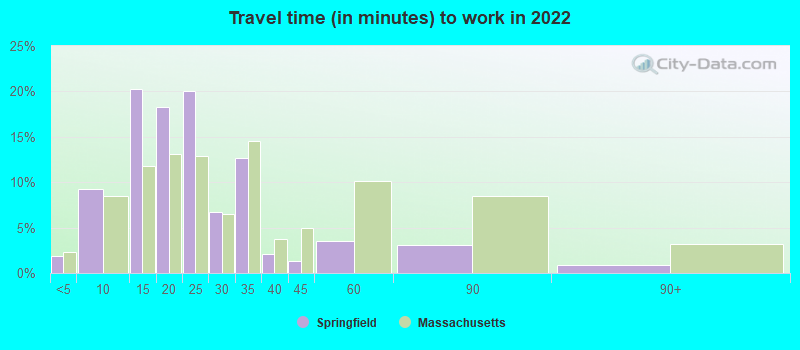
- Mean travel time to work (commute): 17.8 minutes
| Here: | 15.3 |
| Massachusetts average: | 13.0 |
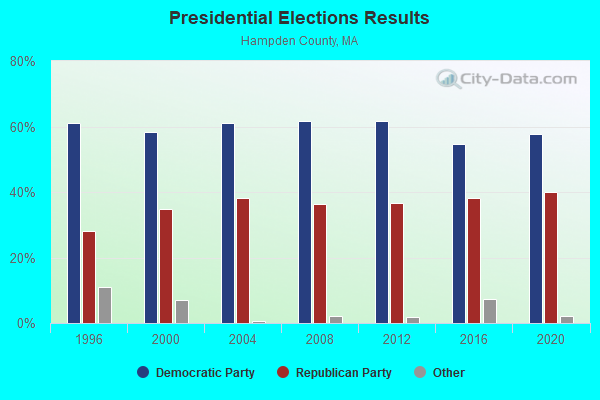
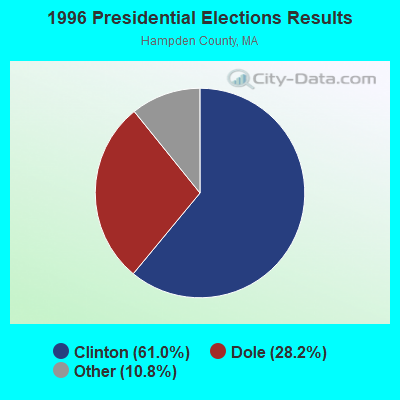
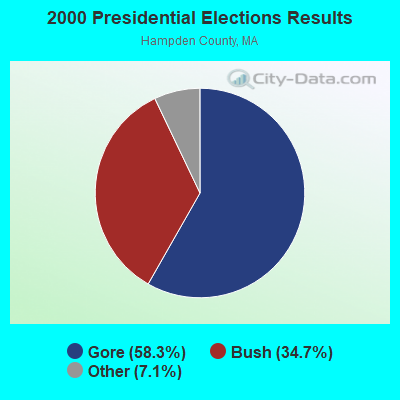
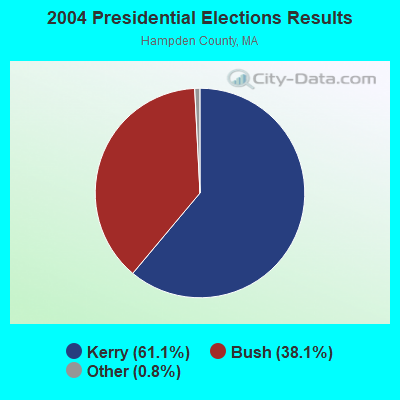
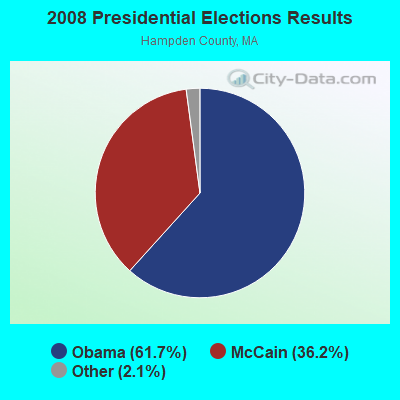
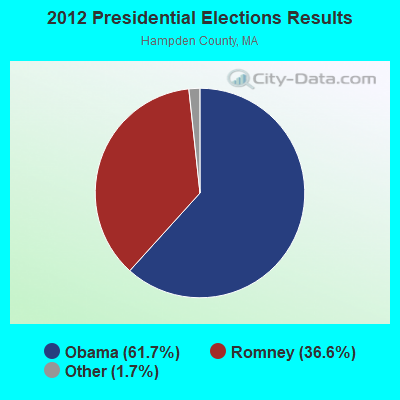
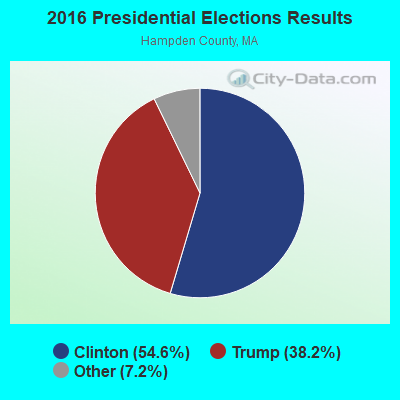
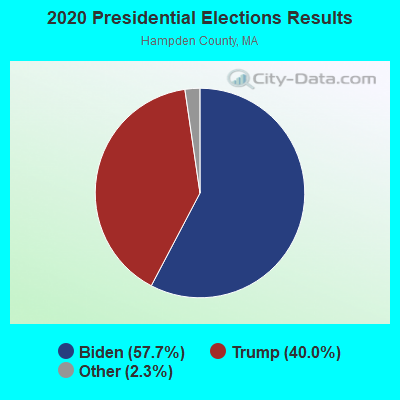
Graphs represent county-level data. Detailed 2008 Election Results
Neighborhoods in Springfield:
(Springfield, Massachusetts Neighborhood Map)Religion statistics for Springfield, MA (based on Hampden County data)
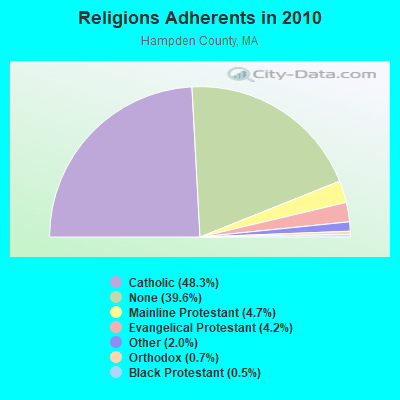
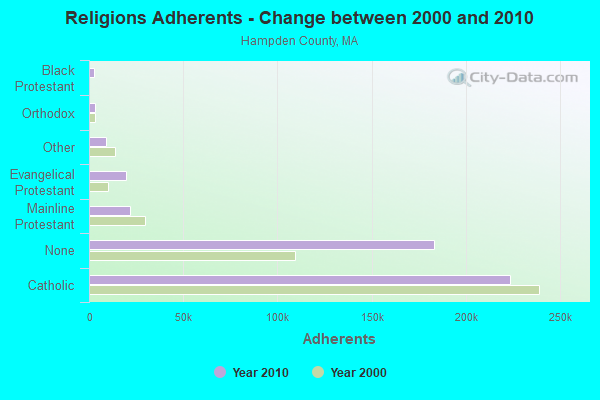
| Religion | Adherents | Congregations |
|---|---|---|
| Catholic | 223,685 | 65 |
| Mainline Protestant | 21,962 | 88 |
| Evangelical Protestant | 19,438 | 114 |
| Other | 9,140 | 31 |
| Orthodox | 3,406 | 10 |
| Black Protestant | 2,491 | 16 |
| None | 183,368 | - |
Food Environment Statistics:
| Hampden County: | 1.95 / 10,000 pop. |
| Massachusetts: | 1.98 / 10,000 pop. |
| This county: | 0.04 / 10,000 pop. |
| Massachusetts: | 0.05 / 10,000 pop. |
| Hampden County: | 1.87 / 10,000 pop. |
| Massachusetts: | 2.22 / 10,000 pop. |
| Here: | 2.43 / 10,000 pop. |
| Massachusetts: | 1.77 / 10,000 pop. |
| Hampden County: | 7.27 / 10,000 pop. |
| Massachusetts: | 8.76 / 10,000 pop. |
| This county: | 9.2% |
| Massachusetts: | 8.1% |
| Hampden County: | 25.9% |
| State: | 22.5% |
| This county: | 16.2% |
| Massachusetts: | 16.5% |
Health and Nutrition:
| Springfield: | 47.7% |
| Massachusetts: | 50.5% |
| Springfield: | 45.6% |
| State: | 48.0% |
| Here: | 28.8 |
| State: | 28.4 |
| This city: | 20.9% |
| State: | 20.7% |
| Springfield: | 11.8% |
| Massachusetts: | 10.4% |
| This city: | 6.8 |
| Massachusetts: | 6.8 |
| This city: | 33.1% |
| Massachusetts: | 33.4% |
| Here: | 54.6% |
| State: | 57.1% |
| Springfield: | 80.1% |
| Massachusetts: | 79.2% |
More about Health and Nutrition of Springfield, MA Residents
| Local government employment and payroll (March 2022) | |||||
| Function | Full-time employees | Monthly full-time payroll | Average yearly full-time wage | Part-time employees | Monthly part-time payroll |
|---|---|---|---|---|---|
| Elementary and Secondary - Instruction | 3,362 | $18,852,714 | $67,291 | 459 | $1,358,469 |
| Elementary and Secondary - Other Total | 628 | $2,714,121 | $51,862 | 552 | $686,240 |
| Police Protection - Officers | 480 | $3,553,933 | $88,848 | 0 | $0 |
| Firefighters | 266 | $1,702,684 | $76,813 | 0 | $0 |
| Streets and Highways | 76 | $417,929 | $65,989 | 1 | $1,829 |
| Parks and Recreation | 73 | $347,820 | $57,176 | 28 | $21,709 |
| Financial Administration | 73 | $476,430 | $78,317 | 1 | $996 |
| Police - Other | 71 | $358,515 | $60,594 | 3 | $3,144 |
| Local Libraries | 65 | $288,986 | $53,351 | 40 | $53,639 |
| Other and Unallocable | 54 | $259,457 | $57,657 | 1 | $1,541 |
| Other Government Administration | 53 | $312,484 | $70,751 | 4 | $11,563 |
| Solid Waste Management | 50 | $226,287 | $54,309 | 0 | $0 |
| Health | 50 | $259,461 | $62,271 | 8 | $16,244 |
| Fire - Other | 45 | $265,821 | $70,886 | 10 | $40,619 |
| Housing and Community Development (Local) | 34 | $128,752 | $45,442 | 2 | $5,509 |
| Judicial and Legal | 25 | $150,771 | $72,370 | 4 | $13,259 |
| Welfare | 19 | $84,178 | $53,165 | 35 | $48,993 |
| Totals for Government | 5,424 | $30,400,343 | $67,257 | 1,148 | $2,263,755 |
Springfield government finances - Expenditure in 2021 (per resident):
- Construction - Elementary and Secondary Education: $44,998,000 ($292.07)
General - Other: $6,999,000 ($45.43)
- Current Operations - Elementary and Secondary Education: $520,962,000 ($3381.46)
General - Other: $121,569,000 ($789.08)
Police Protection: $50,744,000 ($329.37)
Local Fire Protection: $23,684,000 ($153.73)
Financial Administration: $10,801,000 ($70.11)
Housing and Community Development: $10,129,000 ($65.75)
Regular Highways: $9,235,000 ($59.94)
Parks and Recreation: $9,055,000 ($58.77)
Libraries: $6,216,000 ($40.35)
Protective Inspection and Regulation - Other: $3,941,000 ($25.58)
General Public Buildings: $3,435,000 ($22.30)
Central Staff Services: $3,332,000 ($21.63)
Judicial and Legal Services: $2,119,000 ($13.75)
Health - Other: $1,583,000 ($10.27)
Solid Waste Management: $1,372,000 ($8.91)
Public Welfare - Other: $1,242,000 ($8.06)
Water Utilities: $529,000 ($3.43)
- General - Interest on Debt: $7,111,000 ($46.16)
- Intergovernmental to Local - Other - Elementary and Secondary Education: $6,837,000 ($44.38)
Other - Health - Other: $35,000 ($0.23)
- Intergovernmental to State - Transit Utilities: $3,218,000 ($20.89)
General - Other: $419,000 ($2.72)
- Other Capital Outlay - Elementary and Secondary Education: $32,432,000 ($210.51)
General - Other: $6,641,000 ($43.11)
General Public Building: $5,705,000 ($37.03)
Housing and Community Development: $3,719,000 ($24.14)
Regular Highways: $3,710,000 ($24.08)
Parks and Recreation: $1,507,000 ($9.78)
Police Protection: $187,000 ($1.21)
Libraries: $35,000 ($0.23)
Local Fire Protection: $6,000 ($0.04)
- Total Salaries and Wages: $281,782,000 ($1828.99)
Springfield government finances - Revenue in 2021 (per resident):
- Charges - Elementary and Secondary Education School Lunch: $11,270,000 ($73.15)
Other: $10,882,000 ($70.63)
Parks and Recreation: $2,310,000 ($14.99)
Elementary and Secondary Education School Tuition and Transportation: $245,000 ($1.59)
Elementary and Secondary Education - Other: $1,000 ($0.01)
- Federal Intergovernmental - Other: $59,192,000 ($384.20)
Housing and Community Development: $13,664,000 ($88.69)
Education: $771,000 ($5.00)
- Local Intergovernmental - Education: $117,000 ($0.76)
- Miscellaneous - General Revenue - Other: $10,117,000 ($65.67)
Interest Earnings: $2,665,000 ($17.30)
Donations From Private Sources: $1,301,000 ($8.44)
Fines and Forfeits: $409,000 ($2.65)
Special Assessments: $1,000 ($0.01)
- State Intergovernmental - Education: $489,755,000 ($3178.91)
General Local Government Support: $58,765,000 ($381.43)
Other: $11,198,000 ($72.68)
Highways: $4,303,000 ($27.93)
Public Welfare: $979,000 ($6.35)
- Tax - Property: $239,319,000 ($1553.37)
Other License: $4,524,000 ($29.36)
Other Selective Sales: $2,303,000 ($14.95)
Springfield government finances - Debt in 2021 (per resident):
- Long Term Debt - Outstanding Unspecified Public Purpose: $193,500,000 ($1255.97)
Beginning Outstanding - Unspecified Public Purpose: $171,965,000 ($1116.19)
Issue, Unspecified Public Purpose: $39,475,000 ($256.22)
Retired Unspecified Public Purpose: $17,940,000 ($116.45)
- Short Term Debt Outstanding - Beginning: $15,844,000 ($102.84)
End of Fiscal Year: $7,277,000 ($47.23)
Springfield government finances - Cash and Securities in 2021 (per resident):
- Bond Funds - Cash and Securities: $17,379,000 ($112.80)
- Other Funds - Cash and Securities: $230,980,000 ($1499.25)
3.64% of this county's 2021 resident taxpayers lived in other counties in 2020 ($58,474 average adjusted gross income)
| Here: | 3.64% |
| Massachusetts average: | 6.35% |
0.02% of residents moved from foreign countries ($105 average AGI)
Hampden County: 0.02% Massachusetts average: 0.01%
Top counties from which taxpayers relocated into this county between 2020 and 2021:
| from Hampshire County, MA | |
| from Hartford County, CT | |
| from Worcester County, MA |
4.26% of this county's 2020 resident taxpayers moved to other counties in 2021 ($66,146 average adjusted gross income)
| Here: | 4.26% |
| Massachusetts average: | 7.18% |
0.03% of residents moved to foreign countries ($223 average AGI)
Hampden County: 0.03% Massachusetts average: 0.02%
Top counties to which taxpayers relocated from this county between 2020 and 2021:
| to Hampshire County, MA | |
| to Hartford County, CT | |
| to Worcester County, MA |
| Businesses in Springfield, MA | ||||
| Name | Count | Name | Count | |
|---|---|---|---|---|
| 7-Eleven | 2 | Lane Furniture | 3 | |
| AMF Bowling | 1 | LensCrafters | 1 | |
| AT&T | 1 | Little Caesars Pizza | 2 | |
| Ace Hardware | 2 | Lowe's | 1 | |
| Advance Auto Parts | 3 | Macy's | 1 | |
| Aeropostale | 1 | Marriott | 1 | |
| American Eagle Outfitters | 1 | Marshalls | 1 | |
| Applebee's | 1 | MasterBrand Cabinets | 2 | |
| AutoZone | 3 | McDonald's | 9 | |
| Bath & Body Works | 1 | Men's Wearhouse | 1 | |
| Blockbuster | 2 | Motherhood Maternity | 1 | |
| Burger King | 4 | Nike | 20 | |
| Burlington Coat Factory | 1 | Old Navy | 1 | |
| CVS | 6 | Olive Garden | 1 | |
| Chevrolet | 1 | Payless | 4 | |
| Chuck E. Cheese's | 1 | Penske | 2 | |
| Circle K | 1 | Pizza Hut | 1 | |
| Cold Stone Creamery | 1 | Quiznos | 1 | |
| Dairy Queen | 1 | RadioShack | 3 | |
| Deb | 1 | Raymour & Flanigan | 1 | |
| Domino's Pizza | 3 | Rite Aid | 1 | |
| DressBarn | 1 | Ruby Tuesday | 1 | |
| Dressbarn | 1 | Ryder Rental & Truck Leasing | 1 | |
| Dunkin Donuts | 19 | Sears | 2 | |
| Fashion Bug | 1 | Sheraton | 1 | |
| FedEx | 17 | Sprint Nextel | 1 | |
| Firestone Complete Auto Care | 1 | Starbucks | 1 | |
| GNC | 1 | Stop & Shop | 2 | |
| GameStop | 3 | Subway | 17 | |
| Goodwill | 2 | T-Mobile | 4 | |
| H&R Block | 7 | Taco Bell | 3 | |
| Hilton | 1 | The Room Place | 1 | |
| Hot Topic | 1 | Toys"R"Us | 2 | |
| Howard Johnson | 2 | True Value | 1 | |
| Hyundai | 1 | U-Haul | 4 | |
| IHOP | 1 | UPS | 20 | |
| JCPenney | 1 | Vans | 2 | |
| Jones New York | 4 | Verizon Wireless | 1 | |
| Journeys | 1 | Walgreens | 6 | |
| KFC | 3 | Walmart | 1 | |
| Kmart | 1 | Wendy's | 3 | |
| LA Fitness | 1 | YMCA | 3 | |
| La-Z-Boy | 1 | |||
Strongest AM radio stations in Springfield:
- WNNZ (640 AM; 50 kW; WESTFIELD, MA; Owner: CLEAR CHANNEL BROADCASTING LICENSES, INC.)
- WACE (730 AM; 5 kW; CHICOPEE, MA; Owner: CARTER BROADCASTING CORP.)
- WSPR (1270 AM; 5 kW; SPRINGFIELD, MA; Owner: ANTONIO F. AND HELENA R. GOIS, TENANTS BY THE ENTIRETY)
- WHNP (1600 AM; 2 kW; EAST LONGMEADOW, MA; Owner: SAGA COMMUNICATIONS OF NEW ENGLAND, LLC)
- WHYN (560 AM; 5 kW; SPRINGFIELD, MA; Owner: CLEAR CHANNEL BROADCASTING LICENSES, INC.)
- WTIC (1080 AM; 50 kW; HARTFORD, CT; Owner: INFINITY RADIO OPERATIONS INC.)
- WMAS (1450 AM; 1 kW; SPRINGFIELD, MA; Owner: LAPPIN COMMUNICATIONS, INC.)
- WCRN (830 AM; 50 kW; WORCESTER, MA; Owner: CARTER BROADCASTING CORPORATION)
- WVNE (760 AM; daytime; 25 kW; LEICESTER, MA; Owner: BLOUNT MASSCOM, INC.)
- WACM (1490 AM; 1 kW; WEST SPRINGFIELD, MA; Owner: ANTONIO F. GOIS)
- WALE (990 AM; 50 kW; GREENVILLE, RI; Owner: NORTH AMERICAN BROADCASTING CO., INC.)
- WRKO (680 AM; 50 kW; BOSTON, MA; Owner: ENTERCOM BOSTON LICENSE, LLC)
- WEEI (850 AM; 50 kW; BOSTON, MA; Owner: ENTERCOM BOSTON LICENSE, LLC)
Strongest FM radio stations in Springfield:
- WAIC (91.9 FM; SPRINGFIELD, MA; Owner: AMERICAN INTERNATIONAL COLLEGE)
- WTCC (90.7 FM; SPRINGFIELD, MA; Owner: SPRINGFIELD TECH. COMM. COLLEGE)
- WAQY (102.1 FM; SPRINGFIELD, MA; Owner: SAGA COMMUNICATIONS OF NEW ENGLAND, LLC)
- WHYN-FM (93.1 FM; SPRINGFIELD, MA; Owner: CLEAR CHANNEL BROADCASTING LICENSES, INC.)
- WRNX (100.9 FM; AMHERST, MA; Owner: WESTERN MASSACHUSETTS RADIO COMPANY)
- WMAS-FM (94.7 FM; SPRINGFIELD, MA; Owner: LAPPIN COMMUNICATIONS, INC.)
- WSCB (89.9 FM; SPRINGFIELD, MA; Owner: THE PRES.& TRUS. OF SPRINGFIELD COLL)
- WPKX (97.9 FM; ENFIELD, CT; Owner: CAPSTAR TX LIMITED PARTNERSHIP)
- WFCR (88.5 FM; AMHERST, MA; Owner: UNIVERSITY OF MASSACHUSETTS)
- WNEK-FM (105.1 FM; SPRINGFIELD, MA; Owner: WESTERN NEW ENGLAND COLLEGE)
- WCCH (103.5 FM; HOLYOKE, MA; Owner: HOLYOKE COMMUNITY COLLEGE)
- WAMH (89.3 FM; AMHERST, MA; Owner: TRUSTEES OF AMHERST COLLEGE)
- W246AM (97.1 FM; AMHERST, MA; Owner: GREAT NORTHERN RADIO, LLC)
- WRCH (100.5 FM; NEW BRITAIN, CT; Owner: INFINITY RADIO OPERATIONS INC.)
- WAMC-FM (90.3 FM; ALBANY, NY; Owner: WAMC)
- WTIC-FM (96.5 FM; HARTFORD, CT; Owner: INFINITY RADIO OPERATIONS INC.)
- WCCC-FM (106.9 FM; HARTFORD, CT; Owner: MARLIN BROADCASTING, LLC)
- WWUH (91.3 FM; WEST HARTFORD, CT; Owner: UNIVERSITY OF HARTFORD)
- WAAF (107.3 FM; WORCESTER, MA; Owner: ENTERCOM BOSTON LICENSE, LLC)
- WLZX (99.3 FM; NORTHAMPTON, MA; Owner: SAGA COMMUNICATIONS OF NEW ENGLAND, LLC)
TV broadcast stations around Springfield:
- WWLP (Channel 22; SPRINGFIELD, MA; Owner: WWLP BROADCASTING, LLC)
- WYDN (Channel 48; WORCESTER, MA; Owner: EDUCATIONAL PUBLIC TV CORPORATION)
- W67DF (Channel 67; SPRINGFIELD, MA; Owner: TRINITY BROADCASTING NETWORK)
- WTIC-TV (Channel 61; HARTFORD, CT; Owner: TRIBUNE TELEVISION COMPANY)
- W11BJ (Channel 11; HARTFORD, CT; Owner: COMMUNICATIONS SITE MANAGEMENT LLC)
- WUVN (Channel 18; HARTFORD, CT; Owner: ENTRAVISION HOLDINGS, LLC)
- WTXX (Channel 20; WATERBURY, CT; Owner: WTXX INC.)
- WDMR-LP (Channel 65; SPRINGFIELD, MA; Owner: ZGS HARTFORD, INC.)
- WVIT (Channel 30; NEW BRITAIN, CT; Owner: OUTLET BROADCASTING, INC)
- WEDH (Channel 24; HARTFORD, CT; Owner: CONNECTICUT PUBLIC BROADCASTING, INC.)
- WFSB (Channel 3; HARTFORD, CT; Owner: MEREDITH CORPORATION)
- WUNI (Channel 27; WORCESTER, MA; Owner: ENTRAVISION HOLDINGS, LLC)
- WGBY-TV (Channel 57; SPRINGFIELD, MA; Owner: WGBH EDUCATIONAL FOUNDATION)
- WGGB-TV (Channel 40; SPRINGFIELD, MA; Owner: WGGB LICENSEE, LLC)
- W12CL (Channel 12; GRANBY, CT; Owner: SALVATORE MINNITI)
- WHCT-LP (Channel 38; HARTFORD, CT; Owner: VENTURE TECHNOLOGIES GROUP, LLC)
- WHTX-LP (Channel 10; HARTFORD, CT; Owner: ENTRAVISION HOLDINGS, LLC)
- WRDM-LP (Channel 13; HARTFORD, CT; Owner: ZGS HARTFORD, INC.)
Medal of Honor Recipients
Medal of Honor Recipients born in Springfield: Andrew S. Bryant, Arthur, Jr. MacArthur.

- National Bridge Inventory (NBI) Statistics
- 71Number of bridges
- 1,916ft / 584mTotal length
- $432,408,000Total costs
- 2,980,672Total average daily traffic
- 154,192Total average daily truck traffic
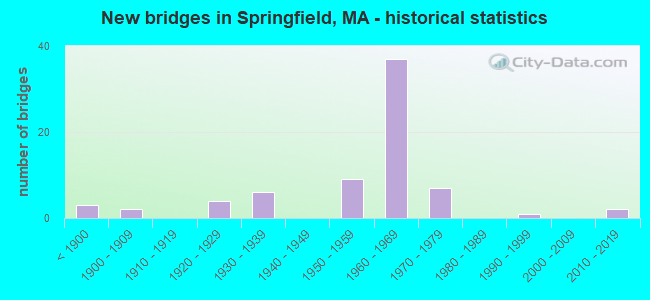
- New bridges - historical statistics
- 3Before 1900
- 21900-1909
- 41920-1929
- 61930-1939
- 91950-1959
- 371960-1969
- 71970-1979
- 11990-1999
- 22010-2019
FCC Registered Commercial Land Mobile Towers: 9 (See the full list of FCC Registered Commercial Land Mobile Towers in Springfield, MA)
FCC Registered Private Land Mobile Towers: 15 (See the full list of FCC Registered Private Land Mobile Towers)
FCC Registered Broadcast Land Mobile Towers: 75 (See the full list of FCC Registered Broadcast Land Mobile Towers)
FCC Registered Microwave Towers: 88 (See the full list of FCC Registered Microwave Towers in this town)
FCC Registered Paging Towers: 18 (See the full list of FCC Registered Paging Towers)
FCC Registered Maritime Coast & Aviation Ground Towers: 4 (See the full list of FCC Registered Maritime Coast & Aviation Ground Towers)
FCC Registered Amateur Radio Licenses: 300 (See the full list of FCC Registered Amateur Radio Licenses in Springfield)
FAA Registered Aircraft Manufacturers and Dealers: 1 (See the full list of FAA Registered Manufacturers and Dealers in Springfield)
FAA Registered Aircraft: 20 (See the full list of FAA Registered Aircraft)
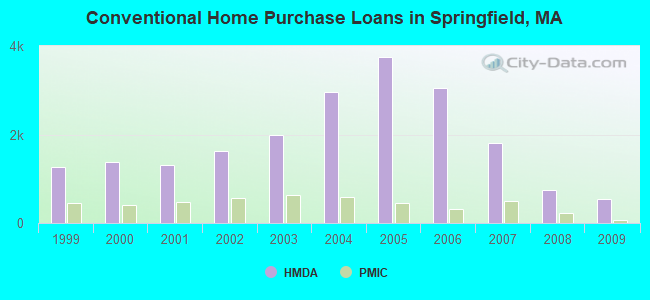
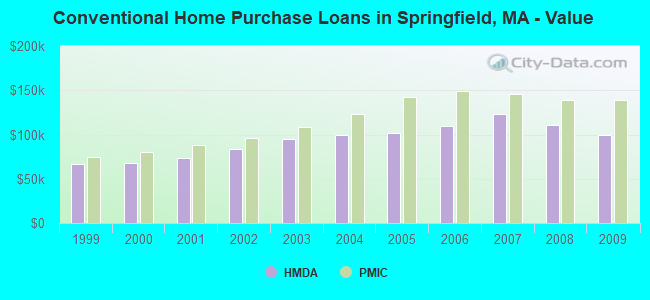
| Home Mortgage Disclosure Act Aggregated Statistics For Year 2009 (Based on 35 full tracts) | ||||||||||||||
| A) FHA, FSA/RHS & VA Home Purchase Loans | B) Conventional Home Purchase Loans | C) Refinancings | D) Home Improvement Loans | E) Loans on Dwellings For 5+ Families | F) Non-occupant Loans on < 5 Family Dwellings (A B C & D) | G) Loans On Manufactured Home Dwelling (A B C & D) | ||||||||
|---|---|---|---|---|---|---|---|---|---|---|---|---|---|---|
| Number | Average Value | Number | Average Value | Number | Average Value | Number | Average Value | Number | Average Value | Number | Average Value | Number | Average Value | |
| LOANS ORIGINATED | 661 | $137,115 | 541 | $99,329 | 1,276 | $123,595 | 166 | $42,042 | 18 | $731,667 | 163 | $92,804 | 6 | $42,333 |
| APPLICATIONS APPROVED, NOT ACCEPTED | 37 | $126,541 | 37 | $102,486 | 181 | $130,597 | 30 | $34,533 | 0 | $0 | 24 | $79,792 | 2 | $30,000 |
| APPLICATIONS DENIED | 136 | $128,140 | 159 | $94,925 | 799 | $125,324 | 258 | $28,066 | 5 | $296,400 | 114 | $80,930 | 15 | $24,800 |
| APPLICATIONS WITHDRAWN | 83 | $116,795 | 97 | $87,371 | 408 | $132,990 | 21 | $47,143 | 0 | $0 | 37 | $84,216 | 0 | $0 |
| FILES CLOSED FOR INCOMPLETENESS | 20 | $120,500 | 18 | $91,222 | 165 | $128,515 | 5 | $42,200 | 0 | $0 | 8 | $92,375 | 0 | $0 |
Detailed mortgage data for all 35 tracts in Springfield, MA
| Private Mortgage Insurance Companies Aggregated Statistics For Year 2009 (Based on 26 full tracts) | ||||||
| A) Conventional Home Purchase Loans | B) Refinancings | C) Non-occupant Loans on < 5 Family Dwellings (A & B) | ||||
|---|---|---|---|---|---|---|
| Number | Average Value | Number | Average Value | Number | Average Value | |
| LOANS ORIGINATED | 57 | $139,439 | 36 | $155,056 | 0 | $0 |
| APPLICATIONS APPROVED, NOT ACCEPTED | 18 | $159,444 | 15 | $130,800 | 0 | $0 |
| APPLICATIONS DENIED | 17 | $142,000 | 11 | $139,000 | 0 | $0 |
| APPLICATIONS WITHDRAWN | 3 | $141,333 | 3 | $161,667 | 1 | $109,000 |
| FILES CLOSED FOR INCOMPLETENESS | 2 | $114,000 | 0 | $0 | 0 | $0 |
2002 - 2018 National Fire Incident Reporting System (NFIRS) incidents
- Fire incident types reported to NFIRS in Springfield, MA
- 8,87456.0%Structure Fires
- 4,59429.0%Outside Fires
- 1,84911.7%Mobile Property/Vehicle Fires
- 5273.3%Other
 Based on the data from the years 2002 - 2018 the average number of fires per year is 932. The highest number of reported fires - 1,335 took place in 2007, and the least - 471 in 2018. The data has a dropping trend.
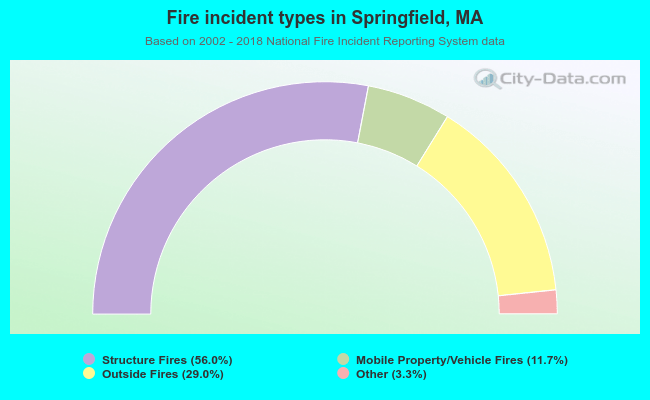 When looking into fire subcategories, the most incidents belonged to: Structure Fires (56.0%), and Outside Fires (29.0%).
Fire-safe hotels and motels in Springfield, Massachusetts:
- Sheraton Springfield, One Springfield Ctr, Springfield, Massachusetts 01144 , Phone: (413) 781-1010, Fax: (413) 732-7560
- Hilton Garden Inn Springfield, 800 W Columbus Ave, Springfield, Massachusetts 01105 , Phone: (413) 886-8000, Fax: (413) 886-8100
- La Quinta Inns & Suites, 100 Congress St, Springfield, Massachusetts 01104 , Phone: (413) 781-0900, Fax: (413) 750-3135
- Howard Johnson, 1356 Boston Rd, Springfield, Massachusetts 01119 , Phone: (413) 783-2111, Fax: (413) 783-7750
- Hampton Inn & Suites Springfield/Downtown, 851 E Columbus Ave, Springfield, Massachusetts 01105 , Phone: (413) 310-2300
| Most common first names in Springfield, MA among deceased individuals | ||
| Name | Count | Lived (average) |
|---|---|---|
| Mary | 2,102 | 80.8 years |
| John | 1,818 | 74.5 years |
| William | 1,385 | 73.6 years |
| James | 1,080 | 72.1 years |
| Joseph | 1,068 | 74.8 years |
| Robert | 910 | 69.5 years |
| George | 856 | 74.8 years |
| Helen | 846 | 79.7 years |
| Margaret | 721 | 80.2 years |
| Edward | 694 | 73.8 years |
| Most common last names in Springfield, MA among deceased individuals | ||
| Last name | Count | Lived (average) |
|---|---|---|
| Smith | 459 | 73.6 years |
| Johnson | 436 | 74.6 years |
| Sullivan | 341 | 76.8 years |
| Brown | 331 | 71.5 years |
| Williams | 287 | 71.6 years |
| Jones | 222 | 72.6 years |
| Murphy | 205 | 76.6 years |
| Shea | 190 | 77.6 years |
| Anderson | 170 | 75.1 years |
| Oconnor | 168 | 77.3 years |
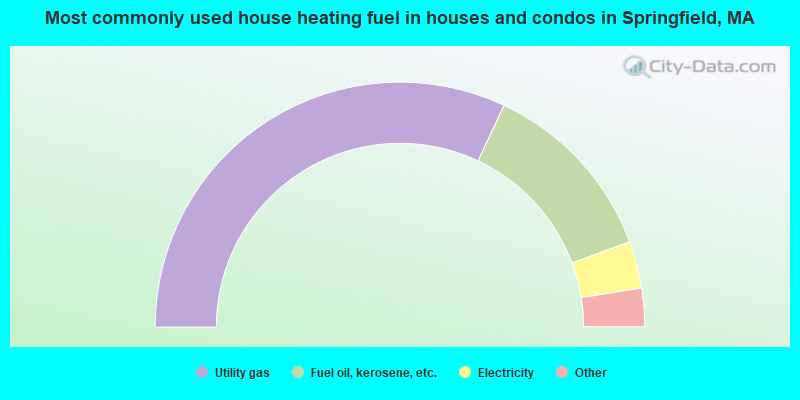
- 64.0%Utility gas
- 24.7%Fuel oil, kerosene, etc.
- 6.2%Electricity
- 3.1%Bottled, tank, or LP gas
- 1.4%Solar energy
- 0.4%Other fuel
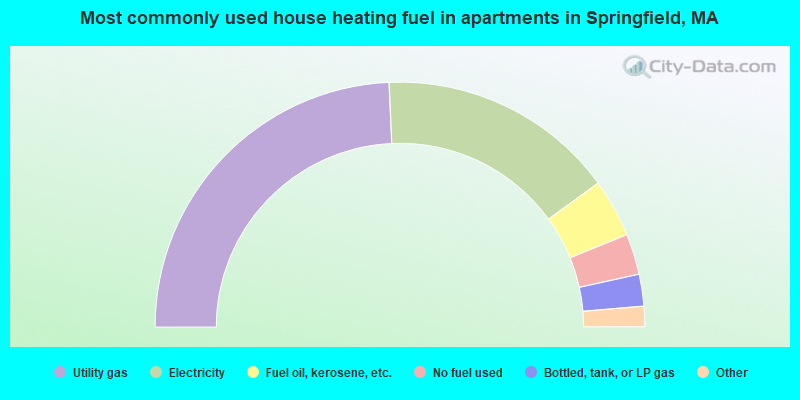
- 48.6%Utility gas
- 31.4%Electricity
- 7.7%Fuel oil, kerosene, etc.
- 5.4%No fuel used
- 4.2%Bottled, tank, or LP gas
- 1.2%Solar energy
- 0.8%Other fuel
- 0.7%Wood
Springfield compared to Massachusetts state average:
- Median household income below state average.
- Median house value significantly below state average.
- Black race population percentage above state average.
- Hispanic race population percentage significantly above state average.
- Median age below state average.
- Foreign-born population percentage below state average.
- Percentage of population with a bachelor's degree or higher below state average.
Springfield, MA compared to other similar cities:
Springfield on our top lists:
- #4 on the list of "Top 101 cities with largest percentage of males in occupations: healthcare support occupations (population 50,000+)"
- #9 on the list of "Top 101 cities with largest percentage of females in occupations: community and social service occupations (population 50,000+)"
- #16 on the list of "Top 101 cities with the highest percentage of single-parent households, population 50,000+"
- #19 on the list of "Top 101 cities with largest percentage of females in industries: health care and social assistance (population 50,000+)"
- #30 on the list of "Top 101 cities with largest percentage of males in industries: health care and social assistance (population 50,000+)"
- #35 on the list of "Top 101 cities with the lowest maximum monthly sunshine amount (population 50,000+)"
- #38 on the list of "Top 101 cities with the least cars per house, population 50,000+"
- #41 on the list of "Top 101 cities with largest percentage of females in occupations: healthcare support occupations (population 50,000+)"
- #41 on the list of "Top 101 cities with the biggest local government total salary and wages expenses per resident (population 10,000+)"
- #45 on the list of "Top 101 cities with the largest city-data.com crime index decrease from 2002 to 2012 (population 50,000+)"
- #47 on the list of "Top 101 cities with largest percentage of females in occupations: farming, fishing, and forestry occupations (population 50,000+)"
- #47 on the list of "Top 101 cities with the smallest house values disparities (population 50,000+)"
- #48 on the list of "Top 101 cities with largest percentage of females in occupations: fire fighting and prevention workers including supervisors (population 50,000+)"
- #49 on the list of "Top 101 cities with the highest number of assaults per 100,000 residents, excludes tourist destinations and others with a lot of outsiders visiting based on city industries data (population 50,000+)"
- #54 on the list of "Top 100 least-safe cities (highest city-data.com crime index) (pop. 50,000+)"
- #56 on the list of "Top 101 cities with the most residents born in Barbados (population 500+)"
- #59 on the list of "Top 101 cities with the highest number of robberies per 100,000 residents, excludes tourist destinations and others with a lot of outsiders visiting based on city industries data (population 50,000+)"
- #60 on the list of "Top 100 cities with old houses but young residents (pop. 50,000+)"
- #63 on the list of "Top 101 cities with largest percentage of males in occupations: transportation occupations (population 50,000+)"
- #64 on the list of "Top 101 cities with largest percentage population decreases in the 1990s) (population 50,000+)"
- #31 (01105) on the list of "Top 101 zip codes with the lowest average reported salary/wage in 2012 (pop 5,000+)"
- #41 (01105) on the list of "Top 101 zip codes with the lowest 2012 average Adjusted Gross Income (AGI) for individuals (pop 5,000+)"
- #81 (01103) on the list of "Top 101 zip codes with the most museums in 2005"
- #85 (01104) on the list of "Top 101 zip codes with the smallest percentage of taxpayers reporting profit/loss from business in 2012 (pop 5,000+)"
- #91 (01105) on the list of "Top 101 zip codes with the smallest percentage of taxpayers using charity contributions deductions in 2012 (pop 5,000+)"
- #91 (01107) on the list of "Top 101 zip codes with the largest percentage of Arab first ancestries (pop 5,000+)"
- #97 (01105) on the list of "Top 101 zip codes with the largest percentage of returns reporting salary or wage in 2012 (pop 5,000+)"
- #14 on the list of "Top 101 counties with the lowest percentage of residents relocating from other counties between 2010 and 2011"
- #21 on the list of "Top 101 counties with the largest number of people moving out compared to moving in (pop. 50,000+)"
- #22 on the list of "Top 101 counties with the highest carbon monoxide air pollution readings in 2012 (ppm)"
- #31 on the list of "Top 101 counties with the lowest percentage of residents relocating to other counties in 2011"
- #34 on the list of "Top 101 counties with the lowest percentage of residents that keep firearms around their homes"

|
|
Total of 174 patent applications in 2008-2024.