Estimated zip code population in 2022: 26,189 Zip code population in 2010: 26,688 Zip code population in 2000: 25,828
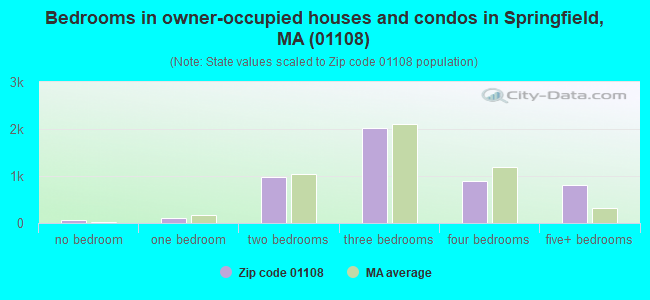
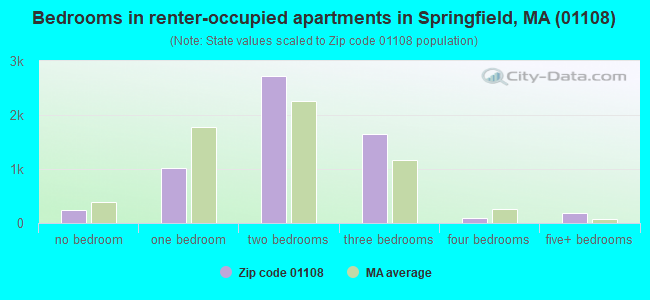
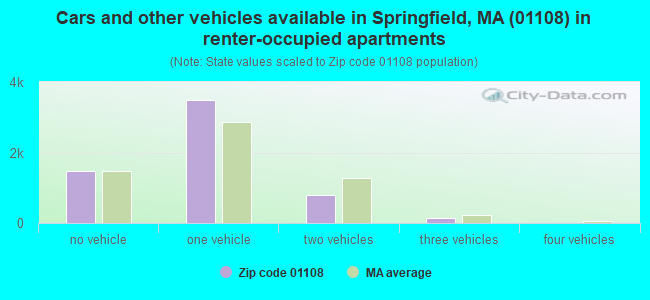
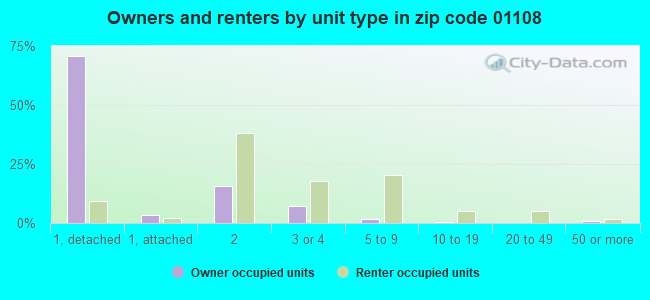
Houses and condos: 11,532 Renter-occupied apartments: 5,893
% of renters here:
55%
State:
38%
March 2022 cost of living index in zip code 01108: 119.6 (more than average, U.S. average is 100)
Land area: 3.7 sq. mi. Water area: 0.2 sq. mi.
Population density: 7,034 people per square mile
(high).
OSM Map
Google Map
MSN Map
OSM Map
General Map
Google Map
MSN Map
OSM Map
Google Map
MSN Map
OSM Map
Google Map
MSN Map
Please wait while loading the map...
Real estate property taxes paid for housing units in 2022:
This zip code:
1.6% ($3,645)
Massachusetts:
1.0% ($5,536)
Median real estate property taxes paid for housing units with mortgages in 2022: $3,682 (1.6%) Median real estate property taxes paid for housing units with no mortgage in 2022: $3,541 (1.7%)
Averages for the 2020 tax year for zip code 01108, filed in 2021:
Average Adjusted Gross Income (AGI) in 2020: $40,049 (Individual Income Tax Returns)
Here:
$40,049
State:
$105,130
Salary/wage: $34,808 (reported on 86.8% of returns)
Here:
$34,808
State:
$82,951
(% of AGI for various income ranges: 1154.4% for AGIs below $25k, 3371.7% for AGIs $25k-50k, 6459.7% for AGIs $50k-75k, 10546.2% for AGIs $75k-100k, 18140.0% for AGIs $100k-200k, 86775.0% for AGIs over 200k)
Taxable interest for individuals: $666 (reported on 14.1% of returns)
This zip code:
$666
Massachusetts:
$2,361
(% of AGI for various income ranges: 4.2% for AGIs below $25k, 4.8% for AGIs $25k-50k, 23.4% for AGIs $50k-75k, 36.2% for AGIs $75k-100k, 67.0% for AGIs $100k-200k, 715.0% for AGIs over 200k)
Ordinary dividends: $3,605 (reported on 6.5% of returns)
Here:
$3,605
State:
$10,365
(% of AGI for various income ranges: 5.8% for AGIs below $25k, 8.2% for AGIs $25k-50k, 24.4% for AGIs $50k-75k, 61.3% for AGIs $75k-100k, 179.7% for AGIs $100k-200k, 6130.0% for AGIs over 200k)
Net capital gain/loss in AGI: +$9,444 (reported on 5.9% of returns)
Here:
+$9,444
State:
+$48,178
(% of AGI for various income ranges: 3.1% for AGIs below $25k, 10.8% for AGIs $25k-50k, 23.4% for AGIs $50k-75k, 92.5% for AGIs $75k-100k, 631.6% for AGIs $100k-200k, 17730.0% for AGIs over 200k)
Profit/loss from business: +$7,807 (reported on 12.1% of returns)
Here:
+$7,807
State:
+$20,792
(% of AGI for various income ranges: 58.8% for AGIs below $25k, 68.7% for AGIs $25k-50k, 173.3% for AGIs $50k-75k, 345.8% for AGIs $75k-100k, 603.5% for AGIs $100k-200k, 6060.0% for AGIs over 200k)
Taxable individual retirement arrangement distribution: $14,449 (reported on 3.9% of returns)
01108:
$14,449
Massachusetts:
$22,790
(% of AGI for various income ranges: 13.8% for AGIs below $25k, 28.8% for AGIs $25k-50k, 88.9% for AGIs $50k-75k, 316.8% for AGIs $75k-100k, 817.3% for AGIs $100k-200k)
Total itemized deductions: $23,485 (reported on 3.8% of returns)
Here:
$23,485
State:
$36,722
(% of AGI for various income ranges: 17.3% for AGIs below $25k, 54.2% for AGIs $25k-50k, 227.3% for AGIs $50k-75k, 440.8% for AGIs $75k-100k, 811.6% for AGIs $100k-200k, 4075.0% for AGIs over 200k)
Charity contributions: $4,944 (reported on 2.8% of returns)
Here:
$4,944
State:
$12,529
(% of AGI for various income ranges: 2.0% for AGIs below $25k, 6.5% for AGIs $25k-50k, 25.3% for AGIs $50k-75k, 47.2% for AGIs $75k-100k, 167.0% for AGIs $100k-200k, 1600.0% for AGIs over 200k)
Taxes paid: $6,943 (reported on 3.9% of returns)
01108:
$6,943
State:
$8,782
(% of AGI for various income ranges: 4.3% for AGIs below $25k, 13.3% for AGIs $25k-50k, 65.8% for AGIs $50k-75k, 160.2% for AGIs $75k-100k, 266.5% for AGIs $100k-200k, 1220.0% for AGIs over 200k)
Earned income credit: $2,451 (reported on 30.0% of returns)
Here:
$2,451
State:
$1,909
(% of AGI for various income ranges: 135.2% for AGIs below $25k, 104.2% for AGIs $25k-50k, 1.4% for AGIs $50k-75k)
Percentage of individuals using paid preparers for their 2020 taxes: 90.5%
Here:
91%
State:
92%
(% for various income ranges: 89.9% for AGIs below $25k, 92.1% for AGIs $25k-50k, 90.3% for AGIs $50k-75k, 88.9% for AGIs $75k-100k, 87.0% for AGIs $100k-200k, 90.0% for AGIs over 200k)
Averages for the 2012 tax year for zip code 01108, filed in 2013:
Average Adjusted Gross Income (AGI) in 2012: $34,537 (Individual Income Tax Returns)
Here:
$34,537
State:
$81,425
Salary/wage: $31,598 (reported on 88.3% of returns)
Here:
$31,598
State:
$64,752
(% of AGI for various income ranges: 79.5% for AGIs below $25k, 87.2% for AGIs $25k-50k, 82.5% for AGIs $50k-75k, 79.8% for AGIs $75k-100k, 79.8% for AGIs $100k-200k, 60.2% for AGIs over 200k)
Taxable interest for individuals: $808 (reported on 19.3% of returns)
This zip code:
$808
Massachusetts:
$2,136
(% of AGI for various income ranges: 0.4% for AGIs below $25k, 0.3% for AGIs $25k-50k, 0.4% for AGIs $50k-75k, 0.5% for AGIs $75k-100k, 0.7% for AGIs $100k-200k, 0.7% for AGIs over 200k)
Ordinary dividends: $2,574 (reported on 8.6% of returns)
Here:
$2,574
State:
$9,473
(% of AGI for various income ranges: 0.5% for AGIs below $25k, 0.3% for AGIs $25k-50k, 0.8% for AGIs $50k-75k, 0.6% for AGIs $75k-100k, 0.9% for AGIs $100k-200k, 1.4% for AGIs over 200k)
Net capital gain/loss in AGI: +$3,531 (reported on 5.5% of returns)
Here:
+$3,531
State:
+$31,437
(% of AGI for various income ranges: 0.3% for AGIs $50k-75k, 0.4% for AGIs $75k-100k, 0.5% for AGIs $100k-200k, 5.3% for AGIs over 200k)
Profit/loss from business: +$11,014 (reported on 11.2% of returns)
Here:
+$11,014
State:
+$20,662
(% of AGI for various income ranges: 7.7% for AGIs below $25k, 2.0% for AGIs $25k-50k, 2.3% for AGIs $50k-75k, 2.3% for AGIs $75k-100k, 3.2% for AGIs $100k-200k, 4.6% for AGIs over 200k)
Taxable individual retirement arrangement distribution: $11,306 (reported on 5.0% of returns)
01108:
$11,306
Massachusetts:
$18,892
(% of AGI for various income ranges: 1.3% for AGIs below $25k, 1.0% for AGIs $25k-50k, 1.6% for AGIs $50k-75k, 2.4% for AGIs $75k-100k, 3.5% for AGIs $100k-200k)
Total itemized deductions: $17,072 (22% of AGI, reported on 19.1% of returns)
Here:
$17,072
State:
$28,907
Here:
21.8% of AGI
State:
18.2% of AGI
(% of AGI for various income ranges: 3.8% for AGIs below $25k, 7.5% for AGIs $25k-50k, 11.8% for AGIs $50k-75k, 11.9% for AGIs $75k-100k, 14.0% for AGIs $100k-200k, 11.8% for AGIs over 200k)
Charity contributions: $2,380 (reported on 14.7% of returns)
Here:
$2,380
State:
$4,208
(% of AGI for various income ranges: 0.2% for AGIs below $25k, 0.7% for AGIs $25k-50k, 1.0% for AGIs $50k-75k, 1.7% for AGIs $75k-100k, 1.9% for AGIs $100k-200k, 1.4% for AGIs over 200k)
Taxes paid: $7,056 (reported on 19.1% of returns)
01108:
$7,056
State:
$13,303
(% of AGI for various income ranges: 0.9% for AGIs below $25k, 2.5% for AGIs $25k-50k, 4.7% for AGIs $50k-75k, 4.9% for AGIs $75k-100k, 6.7% for AGIs $100k-200k, 7.2% for AGIs over 200k)
Earned income credit: $2,539 (reported on 36.4% of returns)
Here:
$2,539
State:
$1,971
(% of AGI for various income ranges: 11.6% for AGIs below $25k, 1.6% for AGIs $25k-50k)
Percentage of individuals using paid preparers for their 2012 taxes: 51.5%
Here:
51%
State:
56%
(% for various income ranges: 49.5% for AGIs below $25k, 50.3% for AGIs $25k-50k, 57.3% for AGIs $50k-75k, 56.5% for AGIs $75k-100k, 60.0% for AGIs $100k-200k, 75.0% for AGIs over 200k)
Averages for the 2004 tax year for zip code 01108, filed in 2005:
Average Adjusted Gross Income (AGI) in 2004: $31,757 (Individual Income Tax Returns)
Here:
$31,757
State:
$62,877
Salary/wage: $29,798 (reported on 89.1% of returns)
Here:
$29,798
State:
$52,969
(% of AGI for various income ranges: 107.5% for AGIs below $10k, 86.1% for AGIs $10k-25k, 89.4% for AGIs $25k-50k, 86.8% for AGIs $50k-75k, 84.0% for AGIs $75k-100k, 64.7% for AGIs over 100k)
Taxable interest for individuals: $1,332 (reported on 31.2% of returns)
This zip code:
$1,332
Massachusetts:
$1,945
(% of AGI for various income ranges: 3.0% for AGIs below $10k, 1.0% for AGIs $10k-25k, 0.8% for AGIs $25k-50k, 1.0% for AGIs $50k-75k, 1.2% for AGIs $75k-100k, 2.6% for AGIs over 100k)
Taxable dividends: $2,573 (reported on 12.4% of returns)
Here:
$2,573
State:
$5,323
(% of AGI for various income ranges: 2.0% for AGIs below $10k, 0.6% for AGIs $10k-25k, 0.5% for AGIs $25k-50k, 0.7% for AGIs $50k-75k, 0.7% for AGIs $75k-100k, 2.5% for AGIs over 100k)
Net capital gain/loss: +$10,386 (reported on 9.4% of returns)
Here:
+$10,386
State:
+$20,377
(% of AGI for various income ranges: -0.4% for AGIs below $10k, 0.1% for AGIs $10k-25k, 0.3% for AGIs $25k-50k, 1.0% for AGIs $50k-75k, 1.1% for AGIs $75k-100k, 14.0% for AGIs over 100k)
Profit/loss from business: +$8,546 (reported on 10.4% of returns)
Here:
+$8,546
State:
+$17,837
(% of AGI for various income ranges: 9.5% for AGIs below $10k, 3.7% for AGIs $10k-25k, 1.4% for AGIs $25k-50k, 1.8% for AGIs $50k-75k, 3.7% for AGIs $75k-100k, 3.8% for AGIs over 100k)
IRA payment deduction: $2,490 (reported on 1.9% of returns)
01108:
$2,490
Massachusetts:
$3,100
(% of AGI for various income ranges: 0.2% for AGIs $10k-25k, 0.2% for AGIs $25k-50k, 0.2% for AGIs $50k-75k, 0.1% for AGIs $75k-100k, 0.1% for AGIs over 100k)
Self-employed pension: $10,971 (reported on 0.3% of returns)
Here:
$10,971
Massachusetts:
$14,516
Total itemized deductions: $14,705 (23% of AGI, reported on 22.7% of returns)
Here:
$14,705
State:
$22,573
Here:
22.5% of AGI
State:
19.5% of AGI
(% of AGI for various income ranges: 5.9% for AGIs below $10k, 5.8% for AGIs $10k-25k, 9.4% for AGIs $25k-50k, 12.8% for AGIs $50k-75k, 13.8% for AGIs $75k-100k, 13.0% for AGIs over 100k)
Charity contributions deductions: $2,213 (3% of AGI, reported on 19.6% of returns)
Here:
$2,213
State:
$3,295
Here:
3.2% of AGI
State:
2.7% of AGI
(% of AGI for various income ranges: 0.4% for AGIs below $10k, 0.5% for AGIs $10k-25k, 1.0% for AGIs $25k-50k, 1.6% for AGIs $50k-75k, 1.9% for AGIs $75k-100k, 2.4% for AGIs over 100k)
Total tax: $4,413 (reported on 65.1% of returns)
01108:
$4,413
State:
$11,494
(% of AGI for various income ranges: 2.6% for AGIs below $10k, 3.4% for AGIs $10k-25k, 6.8% for AGIs $25k-50k, 9.4% for AGIs $50k-75k, 11.3% for AGIs $75k-100k, 17.2% for AGIs over 100k)
Earned income credit: $1,815 (reported on 27.8% of returns)
Here:
$1,815
State:
$1,518
Percentage of individuals using paid preparers for their 2004 taxes: 59.3%
Here:
59%
State:
58%
(% for various income ranges: 57.6% for AGIs below $10k, 61.2% for AGIs $10k-25k, 57.8% for AGIs $25k-50k, 58.2% for AGIs $50k-75k, 64.8% for AGIs $75k-100k, 63.8% for AGIs over 100k)
Likely homosexual households (counted as self-reported same-sex unmarried-partner households)
Lesbian couples: 0.4% of all households
Gay men: 0.1% of all households
Household received Food Stamps/SNAP in the past 12 months: 3,686 Household did not receive Food Stamps/SNAP in the past 12 months: 7,415
Women who had a birth in the past 12 months: 480 (278 now married, 185 unmarried) Women who did not have a birth in the past 12 months: 6,458 (1,713 now married, 4,786 unmarried)
Housing units in zip code 01108 with a mortgage: 3,450 (242 second mortgage, 196 both second mortgage and home equity loan) Houses without a mortgage: 91
Median monthly owner costs for units with a mortgage: $1,743 Median monthly owner costs for units without a mortgage: $723
Residents with income below the poverty level in 2022:
This zip code:
29.2%
Whole state:
10.4%
Residents with income below 50% of the poverty level in 2022:
This zip code:
18.6%
Whole state:
5.1%
Median number of rooms in houses and condos:
Here:
6.1
State:
6.5
Median number of rooms in apartments:
Here:
4.8
State:
4.0
Notable locations in this zip code not listed on our city pages
Notable locations in zip code 01108: Springfield Fire Department Station 3 (A), White Street School Library Media Center (B), Sumner Avenue School Library Media Center (C), Alice B Beal School Library (D), Forest Park Branch Springfield City Library (E), Sinai Temple Library (F). Display/hide their locations on the map
Churches in zip code 01108 include: Word of Life Ministries Church (A), Trinity United Methodist Church (B), Springfield Wesleyan Church (C), Saint Barnabas and All Saints Church (D), Mount Calvary Church (E), Immaculate Conception Parish Church (F), Holy Name Church (G), Harvest Fellowship Church (H), First Park Memorial Baptist Church (I). Display/hide their locations on the map
In group quarters: 117 (-1 institutionalized population)
Size of family households: 2,356 2-persons, 1,605 3-persons, 1,090 4-persons, 658 5-persons, 162 6-persons, 149 7-or-more-persons
Size of nonfamily households: 3,532 1-person, 1,052 2-persons, 141 3-persons
2,877 married couples with children.
2,552 single-parent households (1,138 men, 1,414 women).
57.5% of residents of 01108 zip code speak English at home.
29.9% of residents speak Spanish at home (59% very well, 21% well, 16% not well, 4% not at all).
3.9% of residents speak other Indo-European language at home (42% very well, 17% well, 37% not well, 4% not at all).
4.5% of residents speak Asian or Pacific Island language at home (28% very well, 38% well, 30% not well, 4% not at all).
3.8% of residents speak other language at home (54% very well, 10% well, 17% not well, 18% not at all).
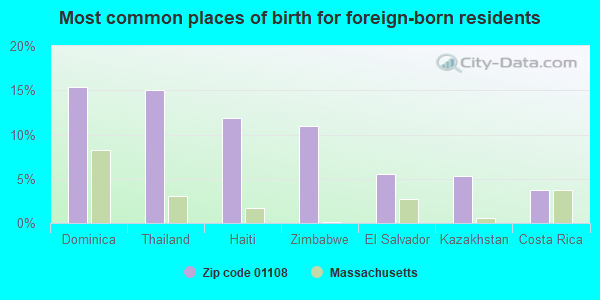
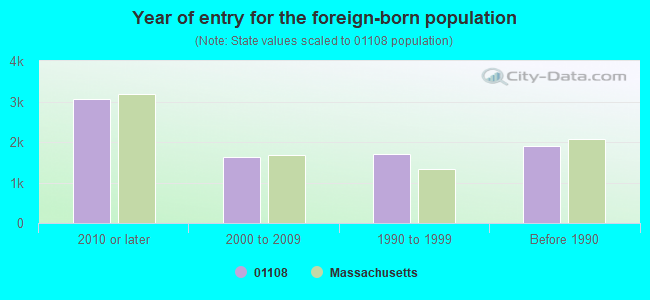
Foreign born population: 4,002 (15.3%) (47.1% of them are naturalized citizens)
Facilities with environmental interests located in this zip code:
ALICE B BEAL ELEM (285 TIFFANY STREET in SPRINGFIELD, MA)
(National Center for Education Statistics) - STATE ID-281175 Organizations: SPRINGFIELD (SCHOOL DISTRICT)
BELMONT LAUNDRY AND DRY CLEANERS (333 BELMONT AVENUE in SPRINGFIELD, MA)
AIR MINOR (AIRS/AFS) CRITERIA AND HAZARDOUS AIR POLLUTANT INVENTORY (Inventory of air pollution sources) Conditionally Exempt Small Quantity Generators, less than 100 kg/month of hazardous waste (Resource Conservation and Recovery Act (tracking hazardous waste)) - notification Business SIC classification: GARMENT PRESSING, AND AGENTS FOR LAUNDRIES AND DRYCLEANERS
PARK CLEANERS, INC (262 ALLEN STREET in SPRINGFIELD, MA)
AIR MINOR (AIRS/AFS) CRITERIA AND HAZARDOUS AIR POLLUTANT INVENTORY (Inventory of air pollution sources) Small Quantity Generators, between 100 kg and 1000 kg of hazardous waste/month (Resource Conservation and Recovery Act (tracking hazardous waste)) - notification Business SIC classification: POWER LAUNDRIES, FAMILY AND COMMERCIAL Alternative names: PARK CLEANERS & DYER
LEONARD S AUTO REPAIR (288 ALLEN in SPRINGFIELD, MA)
(Resource Conservation and Recovery Act (tracking hazardous waste)) Business NAICS classification: OTHER AUTOMOTIVE MECHANICAL AND ELECTRICAL REPAIR AND MAINTENANCE. Organizations: LEONARDS AUTO REPAIR INC (CONTACT/OPERATOR)
, LEONARD DESMARAIF (CONTACT/OWNER)
Alternative names: LEONARDS AUTO REPAIR INC
ADVANCED LABORATORIES INC (1 ALLEN STREET in SPRINGFIELD, MA)
(Resource Conservation and Recovery Act (tracking hazardous waste)) Business NAICS classification: MEDICINAL AND BOTANICAL MANUFACTURING.; SOAP AND OTHER DETERGENT MANUFACTURING.
ATLAS AUTO BODY INC (1 BELMONT AVE in SPRINGFIELD, MA)
(Resource Conservation and Recovery Act (tracking hazardous waste))
MILL ST AUTO BODY INC (289 MILL ST in SPRINGFIELD, MA)
Conditionally Exempt Small Quantity Generators, less than 100 kg/month of hazardous waste (Resource Conservation and Recovery Act (tracking hazardous waste)) - notification Organizations: ADOLFO CRESPO (CONTACT/OWNER)
Alternative names: A C AUTO
AL GRIMALDIS OIL & BURNER SERVICE INC (295 ALLEN ST in SPRINGFIELD, MA)
Conditionally Exempt Small Quantity Generators, less than 100 kg/month of hazardous waste (Resource Conservation and Recovery Act (tracking hazardous waste)) - notification Organizations: ALFONSO M GRIMALDI (CONTACT/OWNER)
Alternative names: GRIMALDI AL OIL & BURNER SERVICE
BAILEY MOTORS (321 ALLEN ST in SPRINGFIELD, MA)
Conditionally Exempt Small Quantity Generators, less than 100 kg/month of hazardous waste (Resource Conservation and Recovery Act (tracking hazardous waste)) - notification Organizations: LEO J BAILEY (CONTACT/OWNER)
MIRANDA AUTO BODY (289-291 MILL ST in SPRINGFIELD, MA)
Conditionally Exempt Small Quantity Generators, less than 100 kg/month of hazardous waste (Resource Conservation and Recovery Act (tracking hazardous waste)) - notification Business NAICS classification: HOME HEALTH EQUIPMENT RENTAL. Organizations: RICARDO MIRANDA (CONTACT/OWNER)
BALISE COLLISION REPAIR CENTER (235 MILL ST in SPRINGFIELD, MA)
Small Quantity Generators, between 100 kg and 1000 kg of hazardous waste/month (Resource Conservation and Recovery Act (tracking hazardous waste)) - notification Alternative names: BALISE AUTO BODY CO INC
Housing units lacking complete plumbing facilities: 2.3% Housing units lacking complete kitchen facilities: 2.0%
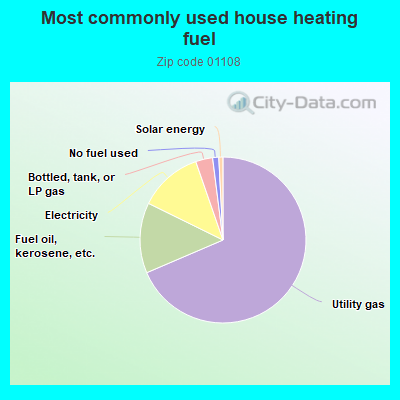
68.5%Utility gas
13.7%Fuel oil, kerosene, etc.
12.4%Electricity
3.3%Bottled, tank, or LP gas
1.2%No fuel used
0.8%Solar energy
Population in 1990: 25,519. Population change in the 1990s: +309 (+1.2%).
Place of birth for U.S.-born residents:
This state: 13,392
Northeast: 2,873
Midwest: 678
South: 844
West: 97
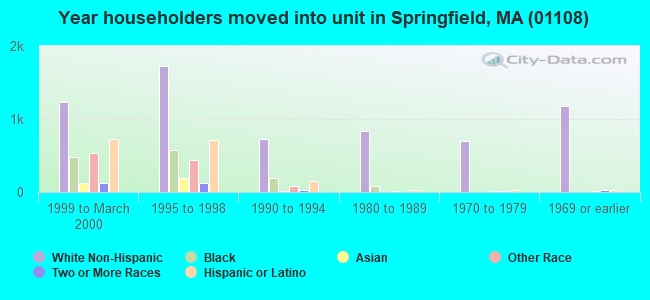
48% of the 01108 zip code residents lived in the same house 5 years ago. Out of people who lived in different houses, 77% lived in this county. Out of people who lived in different counties, 50% lived in Massachusetts.
93% of the 01108 zip code residents lived in the same house 1 year ago. Out of people who lived in different houses, 67% moved from this county. Out of people who lived in different houses, 16% moved from different county within same state. Out of people who lived in different houses, 4% moved from different state. Out of people who lived in different houses, 10% moved from abroad.
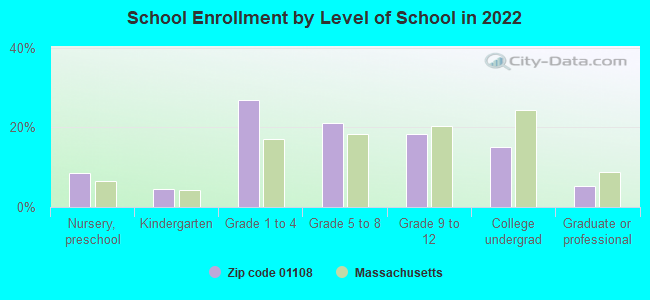
Private vs. public school enrollment:
Students in private schools in grades 1 to 8 (elementary and middle school): 338
Here:
12.6%
Massachusetts:
10.3%
Students in private schools in grades 9 to 12 (high school): 96
Here:
9.4%
Massachusetts:
12.3%
Students in private undergraduate colleges: 137
Here:
16.8%
Massachusetts:
51.2%
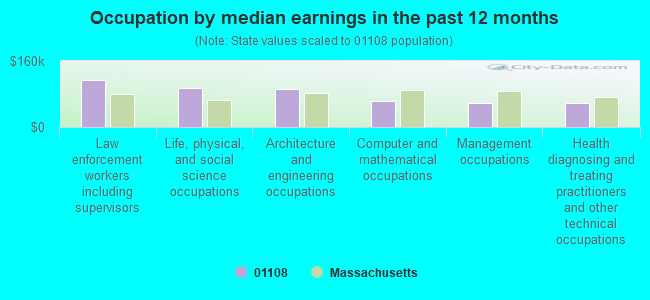
Occupation by median earnings in the past 12 months ($)
114,517Law enforcement workers including supervisors
94,432Life, physical, and social science occupations
91,806Architecture and engineering occupations
62,419Computer and mathematical occupations
57,588Management occupations
57,294Health diagnosing and treating practitioners and other technical occupations
Companies with federal contracts located in this zip code (SPRINGFIELD, MA):
WILLIS, UHIA (199 BELMONT AVE STE 3 L; small business) : $99,523 in 7 contractsfrom 2004 to 2005
Contracts for Gas Turbines and Jet Engines, Aircraft; Prime Moving, and Components, Miscellaneous Aircraft Accessories and Components, Nails, Machine Keys, and Pins, Airframe Structural Components, and moreby Defense Logistics Agency Signed by year:2000: $0; 2001: $0; 2002: $0; 2003: $0; 2004: $7,878; 2005: $91,645; 2006: $0.
Biggest contracts:
$46,071 with Defense Logistics Agency for Gas Turbines and Jet Engines, Aircraft; Prime Moving, and Components. Signed on 2005-05-20. Completion date: 2005-09-17.
$16,435 with Defense Logistics Agency for Miscellaneous Aircraft Accessories and Components. Signed on 2005-05-13. Completion date: 2005-09-17.
$12,933 with Defense Logistics Agency for Nails, Machine Keys, and Pins. Signed on 2005-04-07. Completion date: 2005-08-06.
$7,878 with Defense Logistics Agency for Airframe Structural Components. Taking place in CA. Signed on 2004-11-22. Completion date: 2005-03-30.
ANDERSEN & SCOLARI, INC (36 AMITY COURT; small business) : $58,160 in 5 contractsfrom 2002 to 2003
Contracts for Maintenance, Repair or Alteration of Real Property -- Other Residential Buildings, Maintenance, Repair or Alteration of Real Property -- Other Airfield Structures, Maintenance, Repair or Alteration of Real Property -- Fuel Supply Facilities, Maintenance, Repair or Alteration of Real Property -- Restoration of real property, and moreby Air Force Signed by year:2000: $0; 2001: $0; 2002: $36,520; 2003: $21,640; 2004: $0; 2005: $0; 2006: $0.
Biggest contracts:
$21,950 with Air Force for Maintenance, Repair or Alteration of Real Property -- Other Residential Buildings. Signed on 2002-09-05. Completion date: 2002-11-04.
$13,650 with Air Force for Maintenance, Repair or Alteration of Real Property -- Other Airfield Structures. Signed on 2003-09-29. Completion date: 2003-12-29.
$11,685 with Air Force for Maintenance, Repair or Alteration of Real Property -- Fuel Supply Facilities. Signed on 2002-04-24. Completion date: 2002-06-07.
$7,990 with Air Force for Maintenance, Repair or Alteration of Real Property -- Restoration of real property. Signed on 2003-09-30. Completion date: 2003-10-30.
BAYSTATE FENCE COMPANY (281 COOPER STREET; small business)
$13,500 with Air Force for Maintenance, Repair or Alteration of Real Property -- Other Non-Building Facilities. Signed on 2001-03-28. Completion date: 2001-06-25.
AERO-BOND CORPORATION (1 ALLEN STREET, BLDG # 212; small business) : $11,850 in 2 contractsfrom 2004 to 2006
$12,000 with Army for Airframe Structural Components. Signed on 2004-09-14. Completion date: 2005-06-15.
-$150, same as above.Signed on 2006-02-15. Completion date: 2006-08-31.
Top industries in this zip code by the number of employees in 2005:
2002 - 2018 National Fire Incident Reporting System (NFIRS) incidents
According to the data from the years 2002 - 2018 the average number of fires per year is 114. The highest number of reported fires - 159 took place in 2007, and the least - 68 in 2012. The data has a dropping trend.
When looking into fire subcategories, the most reports belonged to: Structure Fires (65.5%), and Outside Fires (21.6%).
Fire incident types reported to NFIRS in Zip Code 01108


 Nearest zip codes: 01105, 01106, 01118, 01103, 01109, 01104.


 According to the data from the years 2002 - 2018 the average number of fires per year is 114. The highest number of reported fires - 159 took place in 2007, and the least - 68 in 2012. The data has a dropping trend.
 When looking into fire subcategories, the most reports belonged to: Structure Fires (65.5%), and Outside Fires (21.6%).