Estimated zip code population in 2022: 12,439 Zip code population in 2010: 11,611 Zip code population in 2000: 11,333
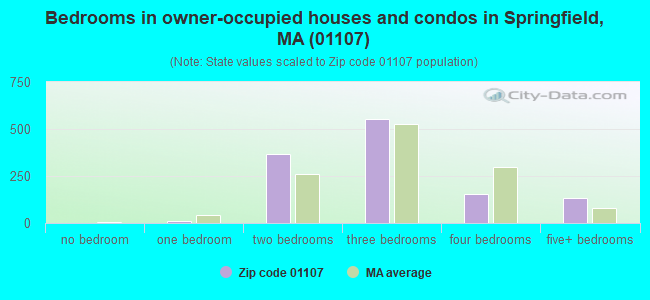
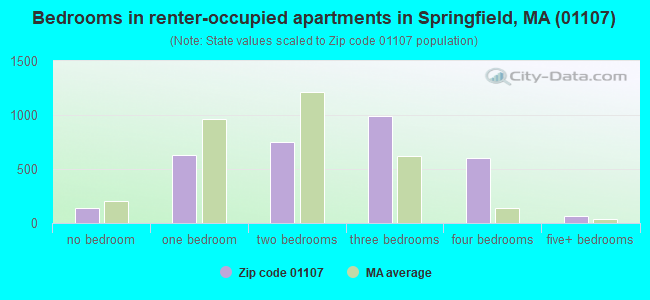
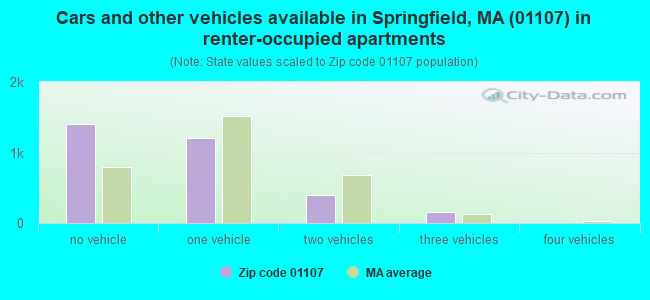
Houses and condos: 4,766 Renter-occupied apartments: 3,174
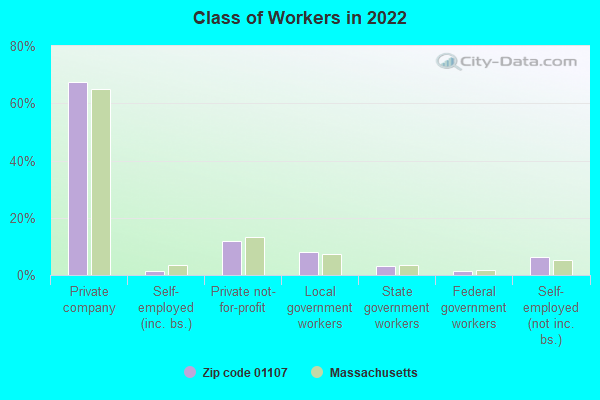
% of renters here:
72%
State:
38%
March 2022 cost of living index in zip code 01107: 121.7 (high, U.S. average is 100)
Land area: 1.5 sq. mi. Water area: 0.0 sq. mi.
Population density: 8,253 people per square mile
(high).
OSM Map
Google Map
MSN Map
OSM Map
General Map
Google Map
MSN Map
OSM Map
Google Map
MSN Map
OSM Map
Google Map
MSN Map
Please wait while loading the map...
Real estate property taxes paid for housing units in 2022:
This zip code:
1.6% ($3,266)
Massachusetts:
1.0% ($5,536)
Median real estate property taxes paid for housing units with mortgages in 2022: $2,624 (1.2%) Median real estate property taxes paid for housing units with no mortgage in 2022: $3,843 (2.0%)
Business Search- 14 Million verified businesses
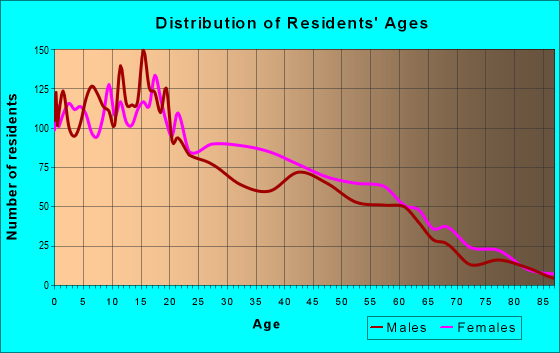
Males: 6,078
(48.9%)
Females: 6,360
(51.1%)
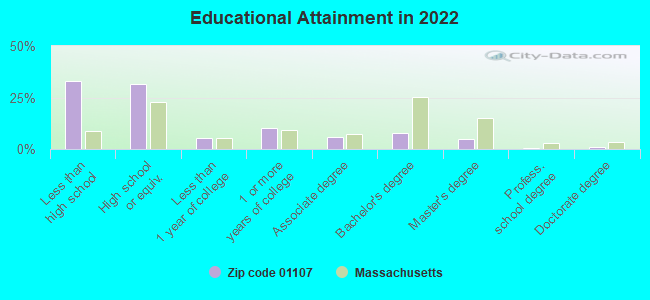
For population 25 years and over in 01107:
High school or higher: 66.3%
Bachelor's degree or higher: 13.9%
Graduate or professional degree: 6.2%
Unemployed: 12.3%
Mean travel time to work (commute): 18.3 minutes
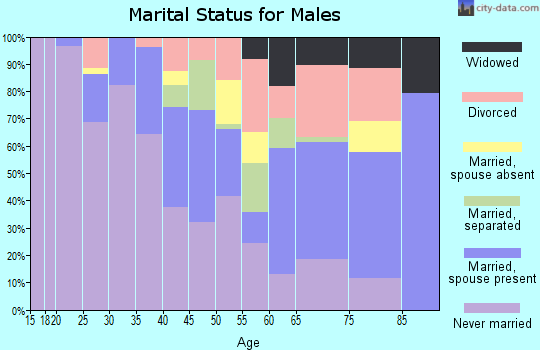
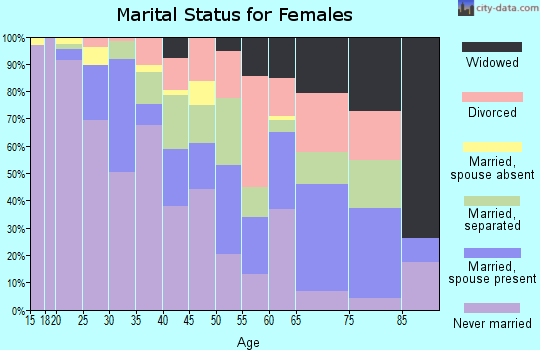
For population 15 years and over in 01107:
Never married: 60.3%
Now married: 28.0%
Separated: 2.3%
Widowed: 4.9%
Divorced: 4.5%
Zip code 01107 compared to state average:
Median household income significantly below state average.
Median house value significantly below state average.
Unemployed percentage significantly above state average.
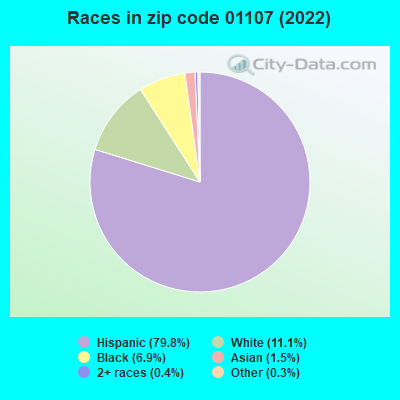
Hispanic race population percentage significantly above state average.
Median age significantly below state average.
Renting percentage above state average.
Percentage of population with a bachelor's degree or higher significantly below state average.
Averages for the 2020 tax year for zip code 01107, filed in 2021:
Average Adjusted Gross Income (AGI) in 2020: $36,131 (Individual Income Tax Returns)
Here:
$36,131
State:
$105,130
Salary/wage: $31,705 (reported on 89.2% of returns)
Here:
$31,705
State:
$82,951
(% of AGI for various income ranges: 1184.1% for AGIs below $25k, 3499.7% for AGIs $25k-50k, 6426.9% for AGIs $50k-75k, 10437.5% for AGIs $75k-100k, 16176.7% for AGIs $100k-200k)
Taxable interest for individuals: $420 (reported on 10.4% of returns)
This zip code:
$420
Massachusetts:
$2,361
(% of AGI for various income ranges: 2.2% for AGIs below $25k, 3.2% for AGIs $25k-50k, 6.3% for AGIs $50k-75k, 17.5% for AGIs $75k-100k, 54.4% for AGIs $100k-200k)
Ordinary dividends: $1,750 (reported on 4.1% of returns)
Here:
$1,750
State:
$10,365
(% of AGI for various income ranges: 1.8% for AGIs below $25k, 4.1% for AGIs $25k-50k, 13.1% for AGIs $50k-75k, 22.5% for AGIs $75k-100k, 175.6% for AGIs $100k-200k)
Net capital gain/loss in AGI: +$8,494 (reported on 4.1% of returns)
Here:
+$8,494
State:
+$48,178
(% of AGI for various income ranges: 2.7% for AGIs below $25k, 4.3% for AGIs $25k-50k, 15.1% for AGIs $50k-75k, 311.7% for AGIs $75k-100k, 422.2% for AGIs $100k-200k)
Profit/loss from business: +$7,978 (reported on 9.4% of returns)
Here:
+$7,978
State:
+$20,792
(% of AGI for various income ranges: 63.1% for AGIs below $25k, 52.0% for AGIs $25k-50k, 154.3% for AGIs $50k-75k, 242.5% for AGIs $75k-100k, 841.1% for AGIs $100k-200k)
Taxable individual retirement arrangement distribution: $12,262 (reported on 1.8% of returns)
01107:
$12,262
Massachusetts:
$22,790
(% of AGI for various income ranges: 7.5% for AGIs below $25k, 17.3% for AGIs $25k-50k, 522.5% for AGIs $75k-100k)
Total itemized deductions: $23,350 (reported on 2.3% of returns)
Here:
$23,350
State:
$36,722
(% of AGI for various income ranges: 36.9% for AGIs $25k-50k, 143.1% for AGIs $50k-75k, 543.3% for AGIs $75k-100k, 747.8% for AGIs $100k-200k)
Charity contributions: $4,400 (reported on 1.8% of returns)
Here:
$4,400
State:
$12,529
(% of AGI for various income ranges: 11.2% for AGIs $25k-50k, 79.2% for AGIs $75k-100k, 113.3% for AGIs $100k-200k)
Taxes paid: $7,760 (reported on 2.3% of returns)
01107:
$7,760
State:
$8,782
(% of AGI for various income ranges: 11.5% for AGIs $25k-50k, 42.6% for AGIs $50k-75k, 195.8% for AGIs $75k-100k, 258.9% for AGIs $100k-200k)
Earned income credit: $2,514 (reported on 35.5% of returns)
Here:
$2,514
State:
$1,909
(% of AGI for various income ranges: 151.0% for AGIs below $25k, 113.1% for AGIs $25k-50k)
Percentage of individuals using paid preparers for their 2020 taxes: 93.5%
Here:
94%
State:
92%
(% for various income ranges: 93.1% for AGIs below $25k, 94.5% for AGIs $25k-50k, 93.3% for AGIs $50k-75k, 94.4% for AGIs $75k-100k, 86.7% for AGIs $100k-200k, 100.0% for AGIs over 200k)
Averages for the 2012 tax year for zip code 01107, filed in 2013:
Average Adjusted Gross Income (AGI) in 2012: $28,597 (Individual Income Tax Returns)
Here:
$28,597
State:
$81,425
Salary/wage: $26,686 (reported on 92.3% of returns)
Here:
$26,686
State:
$64,752
(% of AGI for various income ranges: 86.5% for AGIs below $25k, 91.8% for AGIs $25k-50k, 86.3% for AGIs $50k-75k, 80.4% for AGIs $75k-100k, 111.9% for AGIs $100k-200k)
Taxable interest for individuals: $552 (reported on 13.2% of returns)
This zip code:
$552
Massachusetts:
$2,136
(% of AGI for various income ranges: 0.2% for AGIs below $25k, 0.2% for AGIs $25k-50k, 0.1% for AGIs $50k-75k, 0.7% for AGIs $75k-100k, 0.4% for AGIs $100k-200k)
Ordinary dividends: $2,041 (reported on 4.5% of returns)
Here:
$2,041
State:
$9,473
(% of AGI for various income ranges: 0.1% for AGIs below $25k, 0.2% for AGIs $25k-50k, 0.3% for AGIs $50k-75k, 0.9% for AGIs $75k-100k, 0.7% for AGIs $100k-200k)
Net capital gain/loss in AGI: +$400 (reported on 2.9% of returns)
Here:
+$400
State:
+$31,437
(% of AGI for various income ranges: 0.4% for AGIs $100k-200k)
Profit/loss from business: +$8,477 (reported on 8.2% of returns)
Here:
+$8,477
State:
+$20,662
(% of AGI for various income ranges: 5.0% for AGIs below $25k, 1.1% for AGIs $25k-50k, 2.5% for AGIs $50k-75k, 2.8% for AGIs $100k-200k)
Taxable individual retirement arrangement distribution: $10,922 (reported on 2.4% of returns)
01107:
$10,922
Massachusetts:
$18,892
(% of AGI for various income ranges: 0.4% for AGIs below $25k, 1.3% for AGIs $25k-50k, 4.8% for AGIs $75k-100k)
Total itemized deductions: $16,659 (24% of AGI, reported on 14.3% of returns)
Here:
$16,659
State:
$28,907
Here:
23.9% of AGI
State:
18.2% of AGI
(% of AGI for various income ranges: 4.3% for AGIs below $25k, 6.5% for AGIs $25k-50k, 9.7% for AGIs $50k-75k, 13.7% for AGIs $75k-100k, 13.4% for AGIs $100k-200k, 13.9% for AGIs over 200k)
Charity contributions: $2,119 (reported on 9.5% of returns)
Here:
$2,119
State:
$4,208
(% of AGI for various income ranges: 0.2% for AGIs below $25k, 0.4% for AGIs $25k-50k, 0.9% for AGIs $50k-75k, 1.2% for AGIs $75k-100k, 1.2% for AGIs $100k-200k, 2.2% for AGIs over 200k)
Taxes paid: $6,407 (reported on 14.3% of returns)
01107:
$6,407
State:
$13,303
(% of AGI for various income ranges: 0.8% for AGIs below $25k, 2.2% for AGIs $25k-50k, 3.5% for AGIs $50k-75k, 5.7% for AGIs $75k-100k, 6.6% for AGIs $100k-200k, 7.7% for AGIs over 200k)
Earned income credit: $2,631 (reported on 45.5% of returns)
Here:
$2,631
State:
$1,971
(% of AGI for various income ranges: 13.1% for AGIs below $25k, 2.1% for AGIs $25k-50k)
Percentage of individuals using paid preparers for their 2012 taxes: 55.3%
Here:
55%
State:
56%
(% for various income ranges: 52.6% for AGIs below $25k, 58.3% for AGIs $25k-50k, 61.5% for AGIs $50k-75k, 63.6% for AGIs $75k-100k, 72.7% for AGIs $100k-200k)
Averages for the 2004 tax year for zip code 01107, filed in 2005:
Average Adjusted Gross Income (AGI) in 2004: $26,191 (Individual Income Tax Returns)
Here:
$26,191
State:
$62,877
Salary/wage: $24,123 (reported on 92.3% of returns)
Here:
$24,123
State:
$52,969
(% of AGI for various income ranges: 100.5% for AGIs below $10k, 88.8% for AGIs $10k-25k, 91.1% for AGIs $25k-50k, 85.2% for AGIs $50k-75k, 87.3% for AGIs $75k-100k, 64.1% for AGIs over 100k)
Taxable interest for individuals: $1,067 (reported on 19.5% of returns)
This zip code:
$1,067
Massachusetts:
$1,945
(% of AGI for various income ranges: 1.6% for AGIs below $10k, 0.7% for AGIs $10k-25k, 0.6% for AGIs $25k-50k, 0.4% for AGIs $50k-75k, 0.3% for AGIs $75k-100k, 1.5% for AGIs over 100k)
Taxable dividends: $2,036 (reported on 6.8% of returns)
Here:
$2,036
State:
$5,323
(% of AGI for various income ranges: 0.7% for AGIs below $10k, 0.3% for AGIs $10k-25k, 0.3% for AGIs $25k-50k, 0.2% for AGIs $50k-75k, 0.4% for AGIs $75k-100k, 1.6% for AGIs over 100k)
Net capital gain/loss: +$10,439 (reported on 5.2% of returns)
Here:
+$10,439
State:
+$20,377
(% of AGI for various income ranges: 0.1% for AGIs below $10k, 0.1% for AGIs $10k-25k, 0.5% for AGIs $25k-50k, 1.6% for AGIs $50k-75k, 0.1% for AGIs $75k-100k, 9.1% for AGIs over 100k)
Profit/loss from business: +$7,198 (reported on 8.5% of returns)
Here:
+$7,198
State:
+$17,837
(% of AGI for various income ranges: 2.2% for AGIs below $10k, 3.5% for AGIs $10k-25k, 1.8% for AGIs $25k-50k, 1.9% for AGIs $50k-75k, 3.3% for AGIs over 100k)
IRA payment deduction: $2,320 (reported on 0.7% of returns)
01107:
$2,320
Massachusetts:
$3,100
Total itemized deductions: $14,616 (22% of AGI, reported on 15.5% of returns)
Here:
$14,616
State:
$22,573
Here:
21.7% of AGI
State:
19.5% of AGI
(% of AGI for various income ranges: 2.1% for AGIs below $10k, 3.9% for AGIs $10k-25k, 7.2% for AGIs $25k-50k, 12.0% for AGIs $50k-75k, 13.6% for AGIs $75k-100k, 14.1% for AGIs over 100k)
Charity contributions deductions: $2,699 (4% of AGI, reported on 13.1% of returns)
Here:
$2,699
State:
$3,295
Here:
3.8% of AGI
State:
2.7% of AGI
(% of AGI for various income ranges: 0.5% for AGIs $10k-25k, 0.8% for AGIs $25k-50k, 1.3% for AGIs $50k-75k, 1.4% for AGIs $75k-100k, 3.7% for AGIs over 100k)
Total tax: $3,788 (reported on 55.5% of returns)
01107:
$3,788
State:
$11,494
(% of AGI for various income ranges: 1.5% for AGIs below $10k, 3.0% for AGIs $10k-25k, 6.0% for AGIs $25k-50k, 9.1% for AGIs $50k-75k, 10.4% for AGIs $75k-100k, 17.8% for AGIs over 100k)
Earned income credit: $1,848 (reported on 40.5% of returns)
Here:
$1,848
State:
$1,518
Percentage of individuals using paid preparers for their 2004 taxes: 65.2%
Here:
65%
State:
58%
(% for various income ranges: 62.5% for AGIs below $10k, 69.0% for AGIs $10k-25k, 60.0% for AGIs $25k-50k, 70.8% for AGIs $50k-75k, 73.2% for AGIs $75k-100k, 68.6% for AGIs over 100k)
Household received Food Stamps/SNAP in the past 12 months: 2,600 Household did not receive Food Stamps/SNAP in the past 12 months: 2,137
Women who had a birth in the past 12 months: 122 (45 now married, 69 unmarried) Women who did not have a birth in the past 12 months: 3,346 (783 now married, 2,590 unmarried)
Housing units in zip code 01107 with a mortgage: 776 Median monthly owner costs for units with a mortgage: $1,424 Median monthly owner costs for units without a mortgage: $770
Residents with income below the poverty level in 2022:
This zip code:
42.6%
Whole state:
10.4%
Residents with income below 50% of the poverty level in 2022:
This zip code:
21.5%
Whole state:
5.1%
Median number of rooms in houses and condos:
Here:
6.2
State:
6.5
Median number of rooms in apartments:
Here:
4.7
State:
4.0
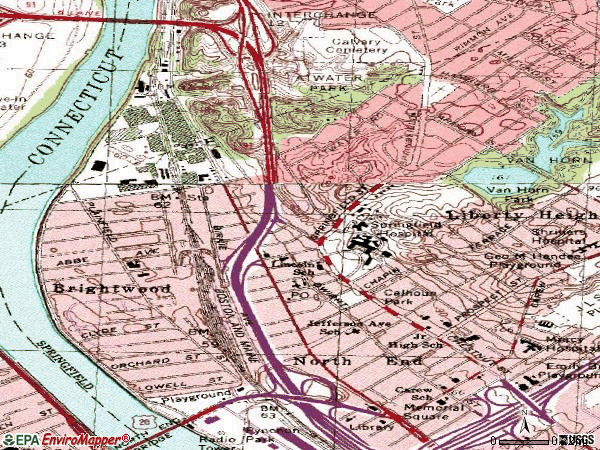
Notable locations in this zip code not listed on our city pages
Notable locations in zip code 01107: Baystate Medical Center Health Sciences Library (A), Springfield Fire Department Station 10 (B), Gerena Community School Library (C). Display/hide their locations on the map
Churches in zip code 01107 include: Spanish Christian Church (A), Spanish Apostolate All Souls Church (B), Saint Thomas Aquinas Church (C), Mount Calvary Baptist Church (D), Kingdom Hall of Jehovahs Witnesses (E), Iglesia Bautista Sinai (F), Holy Ghost Temple (G), Daniels New Bethel Church (H), Alpha and Omega Ministry Church (I). Display/hide their locations on the map
969 married couples with children.
2,421 single-parent households (252 men, 2,169 women).
35.2% of residents of 01107 zip code speak English at home.
62.7% of residents speak Spanish at home (55% very well, 15% well, 20% not well, 9% not at all).
0.5% of residents speak other Indo-European language at home (81% very well, 19% well).
0.8% of residents speak Asian or Pacific Island language at home (51% very well, 49% well).
0.7% of residents speak other language at home (85% very well, 8% well, 8% not well).
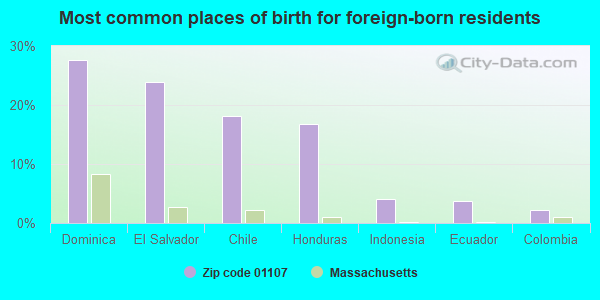
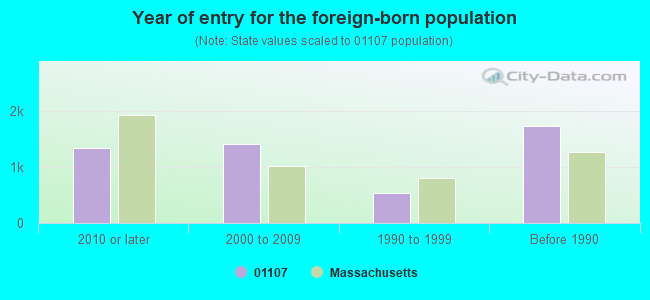
Foreign born population: 1,483 (11.9%) (34.9% of them are naturalized citizens)
Facilities with environmental interests located in this zip code:
ASSOCIATED ELECTRO MECHANICS INC (185 ROWLAND STREET in SPRINGFIELD, MA)
AIR MINOR (AIRS/AFS) CRITERIA AND HAZARDOUS AIR POLLUTANT INVENTORY (Inventory of air pollution sources) Small Quantity Generators, between 100 kg and 1000 kg of hazardous waste/month (Resource Conservation and Recovery Act (tracking hazardous waste)) - notification TRI REPORTER (Tracking of toxic chemicals releasing facilities) Business SIC classification: FABRICATED METAL PRODUCTS Organizations: ASSOC ELECTRO MECH (CONTACT/OPERATOR)
, SMELEWICZ FRANK (CONTACT/OWNER)
Alternative names: ASSOC ELECTRO MECH
BRIGHTWOOD SCHOOL (471 PLAINFIELD STREET in SPRINGFIELD, MA)
(National Center for Education Statistics) - STATE ID-281025 Organizations: SPRINGFIELD (SCHOOL DISTRICT)
LINCOLN ELEMENTARY SCHOOL (732 CHESTNUT STREET in SPRINGFIELD, MA)
(National Center for Education Statistics) - STATE ID-281120 Organizations: SPRINGFIELD (SCHOOL DISTRICT)
BAYSTATE HEALTH INC (759 CHESTNUT ST in SPRINGFIELD, MA)
AIR SYNTHETIC MINOR (AIRS/AFS) CRITERIA AND HAZARDOUS AIR POLLUTANT INVENTORY (Inventory of air pollution sources) Conditionally Exempt Small Quantity Generators, less than 100 kg/month of hazardous waste (Resource Conservation and Recovery Act (tracking hazardous waste)) - notification Business SIC classification: GENERAL MEDICAL AND SURGICAL HOSPITALS Organizations: BAYSTATE MEDICAL CENTER (CONTACT/OPERATOR)
, NON PROFIT PRIVATE TRUSTEESHIP (CONTACT/OWNER)
Alternative names: BAYSTATE MEDICAL CEN, DBA BAYSTATE MEDICAL CENTER?
EASCO HAND TOOLS-PLT (38 WALTER STREET in SPRINGFIELD, MA)
AIR MINOR (AIRS/AFS) (Resource Conservation and Recovery Act (tracking hazardous waste)) Business SIC classification: IRON AND STEEL FORGINGS Business NAICS classification: METAL STAMPING.; HAND AND EDGE TOOL MANUFACTURING.; SAW BLADE AND HANDSAW MANUFACTURING. Alternative names: EASCO HAND TOOLS INC
LEN TEX (297 PLAINFIELD ST in SPRINGFIELD, MA)
AIR MINOR (AIRS/AFS) (Resource Conservation and Recovery Act (tracking hazardous waste)) Business SIC classification: FABRICATED RUBBER PRODUCTS
BRIGHTWOOD TOWING (118 FISK AVE in SPRINGFIELD, MA)
(Resource Conservation and Recovery Act (tracking hazardous waste)) Organizations: RAYMOND A FORGET (CONTACT/OWNER)
MACS AUTOMOTIVE SPECIALTIES (51 DOVER ST in SPRINGFIELD, MA)
(Resource Conservation and Recovery Act (tracking hazardous waste)) Business NAICS classification: GENERAL AUTOMOTIVE REPAIR. Organizations: ROBERT MACINNIS (CONTACT/OWNER)
BAYSTATE MEDICAL CENTER (39 PRATT ST in SPRINGFIELD, MA)
Conditionally Exempt Small Quantity Generators, less than 100 kg/month of hazardous waste (Resource Conservation and Recovery Act (tracking hazardous waste)) - notification Organizations: BAYSTATE HEALTH SYSTEMS INC (CONTACT/OWNER)
NORTHEND AUTO BODY INC (1304 DWIGHT ST in SPRINGFIELD, MA)
Conditionally Exempt Small Quantity Generators, less than 100 kg/month of hazardous waste (Resource Conservation and Recovery Act (tracking hazardous waste)) - notification Organizations: J CICCHETTI & M DUTKIEWICZ (CONTACT/OWNER)
LEIGH J T & CO INC (149 WASON AVE in SPRINGFIELD, MA)
(Resource Conservation and Recovery Act (tracking hazardous waste))
COACH BUILDERS INC (2273 MAIN ST in SPRINGFIELD, MA)
Conditionally Exempt Small Quantity Generators, less than 100 kg/month of hazardous waste (Resource Conservation and Recovery Act (tracking hazardous waste)) - notification
Housing units lacking complete plumbing facilities: 1.2% Housing units lacking complete kitchen facilities: 1.1%
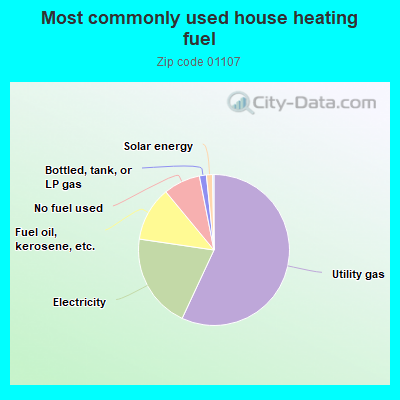
57.0%Utility gas
20.4%Electricity
11.7%Fuel oil, kerosene, etc.
7.9%No fuel used
1.5%Bottled, tank, or LP gas
1.3%Solar energy
Population in 1990: 12,739.
Place of birth for U.S.-born residents:
This state: 5,555
Northeast: 1,371
Midwest: 23
South: 315
West: 55
50% of the 01107 zip code residents lived in the same house 5 years ago. Out of people who lived in different houses, 81% lived in this county. Out of people who lived in different counties, 50% lived in Massachusetts.
92% of the 01107 zip code residents lived in the same house 1 year ago. Out of people who lived in different houses, 58% moved from this county. Out of people who lived in different houses, 7% moved from different county within same state. Out of people who lived in different houses, 33% moved from different state. Out of people who lived in different houses, 3% moved from abroad.
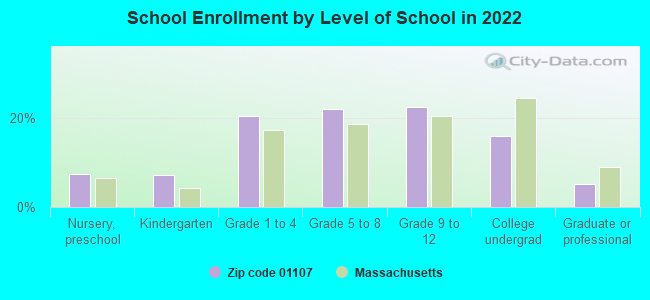
Private vs. public school enrollment:
Students in private schools in grades 1 to 8 (elementary and middle school): 6
Here:
0.4%
Massachusetts:
10.3%
Students in private schools in grades 9 to 12 (high school): 58
Here:
7.0%
Massachusetts:
12.3%
Students in private undergraduate colleges: 213
Here:
35.6%
Massachusetts:
51.2%
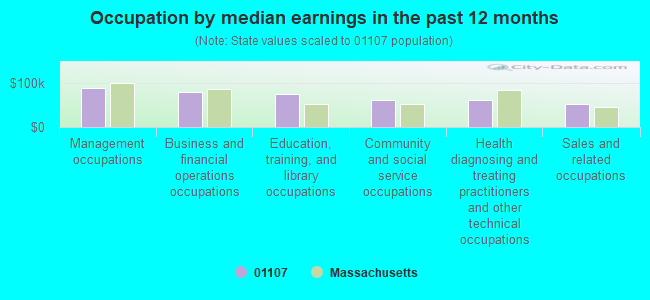
Occupation by median earnings in the past 12 months ($)
88,553Management occupations
77,802Business and financial operations occupations
75,247Education, training, and library occupations
61,398Community and social service occupations
60,024Health diagnosing and treating practitioners and other technical occupations
52,116Sales and related occupations
Companies with federal contracts located in this zip code:
ALLIED FIRE PROTECTION, INC (11 EAST FISK AVENUE in SPRINGFIELD, MA; small business)
$12,400 with Air Force for Maintenance, Repair or Alteration of Real Property -- Miscellaneous Buildings. Signed on 2000-04-18. Completion date: 2000-05-24.
CURTIS UNIVERSAL JOINT CO INC (4 BIRNIE AVE in SPRINGFIELD, MA; small business) : $6,444 in 4 contractsfrom 2004 to 2005
$2,760 with Navy for Hose, Pipe, Tube, Lubrication, and Railing Fittings. Signed on 2005-05-20. Completion date: 2005-06-06.
$2,129 with Navy for Vehicular Power Transmission Components. Signed on 2004-08-26. Completion date: 2004-08-31.
$1,418 with Navy for Torque Converters and Speed Changers. Signed on 2005-09-24. Completion date: 2005-11-11.
$137 with Navy for Vehicular Power Transmission Components. Taking place in VA. Signed on 2004-08-04. Completion date: 2004-08-05.
Top industries in this zip code by the number of employees in 2005:
Health Care and Social Assistance: Offices of Physicians (except Mental Health Specialists) (100-249 employees: 1 establishment, 50-99 employees: 2 establishments, 20-49 employees: 9 establishments, 10-19 employees: 9 establishments, 5-9 employees: 6 establishments, 1-4 employees: 8 establishments)
Management of Companies and Enterprises: Corporate, Subsidiary, and Regional Managing Offices (50-99: 2, 20-49: 1)
Health Care and Social Assistance: Other Individual and Family Services (50-99: 1)
Information: Cable and Other Program Distribution (50-99: 1)
Accommodation and Food Services: Limited-Service Restaurants (20-49: 2, 1-4: 2)
Health Care and Social Assistance: Diagnostic Imaging Centers (20-49: 1, 10-19: 2)
Construction: Plumbing, Heating, and Air-Conditioning Contractors (20-49: 1, 10-19: 1)
People in group quarters in 2010:
58 people in emergency and transitional shelters (with sleeping facilities) for people experiencing homelessness
13 people in group homes for juveniles (non-correctional)
9 people in residential treatment centers for juveniles (non-correctional)
8 people in group homes intended for adults
2 people in other noninstitutional facilities
People in group quarters in 2000:
38 people in other noninstitutional group quarters
8 people in short-term care, detention or diagnostic centers for delinquent children
4 people in homes for the mentally retarded
Fatal accident statistics in 2013:
Fatal accident count: 2
Vehicles involved in fatal accidents: 3
Fatal accidents caused by drunken drivers: 1
Fatalities: 2
Persons involved in fatal accidents: 4
Pedestrians involved in fatal accidents: 1
Fatal accident statistics in 2011:
Fatal accident count: 1
Vehicles involved in fatal accidents: 1
Fatal accidents caused by drunken drivers: 0
Fatalities: 1
Persons involved in fatal accidents: 2
Pedestrians involved in fatal accidents: 0
Home Mortgage Disclosure Act Aggregated Statistics For Year 2009 (Based on 2 full and 8 partial tracts)
A) FHA, FSA/RHS & VA Home Purchase Loans
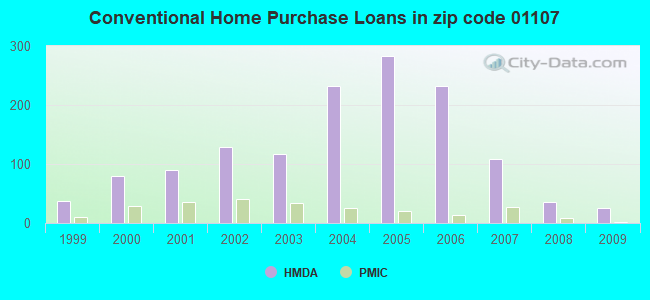
B) Conventional Home Purchase Loans
C) Refinancings
D) Home Improvement Loans
E) Loans on Dwellings For 5+ Families
F) Non-occupant Loans on < 5 Family Dwellings (A B C & D)
G) Loans On Manufactured Home Dwelling (A B C & D)
Number
Average Value
Number
Average Value
Number
Average Value
Number
Average Value
Number
Average Value
Number
Average Value
Number
Average Value
LOANS ORIGINATED
35
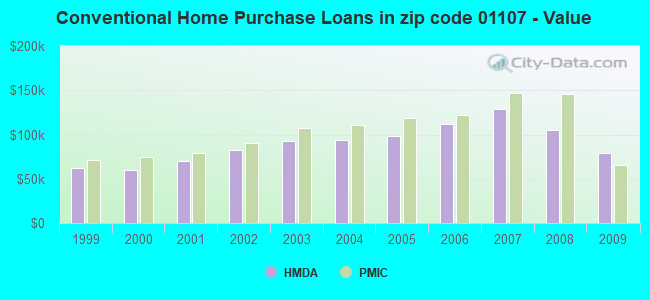
$134,039
26
$78,904
56
$115,109
10
$48,605
5
$608,082
15
$88,473
0
$0
APPLICATIONS APPROVED, NOT ACCEPTED
2
$86,970
2
$71,100
10
$167,187
2
$33,105
0
$0
0
$0
0
$0
APPLICATIONS DENIED
6
$125,138
9
$102,582
66
$123,480
17
$38,260
1
$3,520
9
$77,182
2
$5,560
APPLICATIONS WITHDRAWN
6
$108,352
4
$53,218
26
$147,945
4
$63,018
0
$0
4
$84,918
0
$0
FILES CLOSED FOR INCOMPLETENESS
0
$0
0
$0
8
$94,426
0
$0
0
$0
0
$0
0
$0
Aggregated Statistics For Year 2008 (Based on 2 full and 8 partial tracts)
A) FHA, FSA/RHS & VA Home Purchase Loans
B) Conventional Home Purchase Loans
C) Refinancings
D) Home Improvement Loans
E) Loans on Dwellings For 5+ Families
F) Non-occupant Loans on < 5 Family Dwellings (A B C & D)
G) Loans On Manufactured Home Dwelling (A B C & D)
Number
Average Value
Number
Average Value
Number
Average Value
Number
Average Value
Number
Average Value
Number
Average Value
Number
Average Value
LOANS ORIGINATED
19
$142,216
36
$105,220
62
$126,607
20
$52,754
1
$232,520
15
$116,447
0
$0
APPLICATIONS APPROVED, NOT ACCEPTED
0
$0
2
$104,825
19
$137,901
8
$47,951
0
$0
4
$95,892
0
$0
APPLICATIONS DENIED
7
$117,424
17
$92,144
119
$139,892
53
$32,367
0
$0
14
$95,656
1
$4,030
APPLICATIONS WITHDRAWN
2
$176,570
8
$93,798
26
$122,008
2
$68,560
0
$0
1
$142,630
0
$0
FILES CLOSED FOR INCOMPLETENESS
0
$0
2
$167,835
14
$127,115
1
$99,820
0
$0
0
$0
0
$0
Aggregated Statistics For Year 2007 (Based on 2 full and 8 partial tracts)
A) FHA, FSA/RHS & VA Home Purchase Loans
B) Conventional Home Purchase Loans
C) Refinancings
D) Home Improvement Loans
E) Loans on Dwellings For 5+ Families
F) Non-occupant Loans on < 5 Family Dwellings (A B C & D)
Number
Average Value
Number
Average Value
Number
Average Value
Number
Average Value
Number
Average Value
Number
Average Value
LOANS ORIGINATED
8
$187,408
108
$128,433
130
$127,359
36
$51,931
9
$740,276
39
$148,982
APPLICATIONS APPROVED, NOT ACCEPTED
0
$0
21
$150,844
51
$136,496
8
$86,780
1
$279,030
25
$135,778
APPLICATIONS DENIED
2
$189,680
74
$152,374
239
$137,555
84
$38,429
2
$304,335
54
$144,846
APPLICATIONS WITHDRAWN
0
$0
14
$157,422
92
$135,613
5
$108,092
1
$450,940
8
$165,982
FILES CLOSED FOR INCOMPLETENESS
1
$79,740
7
$117,726
21
$139,802
0
$0
0
$0
2
$83,975
Aggregated Statistics For Year 2006 (Based on 2 full and 8 partial tracts)
A) FHA, FSA/RHS & VA Home Purchase Loans
B) Conventional Home Purchase Loans
C) Refinancings
D) Home Improvement Loans
E) Loans on Dwellings For 5+ Families
F) Non-occupant Loans on < 5 Family Dwellings (A B C & D)
G) Loans On Manufactured Home Dwelling (A B C & D)
Number
Average Value
Number
Average Value
Number
Average Value
Number
Average Value
Number
Average Value
Number
Average Value
Number
Average Value
LOANS ORIGINATED
6
$131,543
233
$111,679
261
$117,408
40
$46,716
5
$763,560
103
$119,805
0
$0
APPLICATIONS APPROVED, NOT ACCEPTED
0
$0
34
$113,669
33
$107,976
9
$49,883
0
$0
21
$120,430
0
$0
APPLICATIONS DENIED
1
$166,320
96
$115,362
292
$119,441
68
$35,771
3
$425,147
65
$114,619
4
$49,540
APPLICATIONS WITHDRAWN
2
$150,050
22
$126,862
163
$256,825
14
$85,254
0
$0
27
$138,163
0
$0
FILES CLOSED FOR INCOMPLETENESS
0
$0
15
$113,053
39
$124,894
3
$46,887
0
$0
7
$160,137
0
$0
Aggregated Statistics For Year 2005 (Based on 2 full and 8 partial tracts)
A) FHA, FSA/RHS & VA Home Purchase Loans
B) Conventional Home Purchase Loans
C) Refinancings
D) Home Improvement Loans
E) Loans on Dwellings For 5+ Families
F) Non-occupant Loans on < 5 Family Dwellings (A B C & D)
G) Loans On Manufactured Home Dwelling (A B C & D)
Number
Average Value
Number
Average Value
Number
Average Value
Number
Average Value
Number
Average Value
Number
Average Value
Number
Average Value
LOANS ORIGINATED
8
$159,099
283
$97,953
280
$116,574
51
$66,973
5
$398,194
139
$112,769
0
$0
APPLICATIONS APPROVED, NOT ACCEPTED
3
$124,433
53
$92,912
58
$110,510
12
$42,622
0
$0
19
$94,317
0
$0
APPLICATIONS DENIED
0
$0
144
$94,880
251
$114,187
104
$35,023
4
$1,775,265
104
$72,335
10
$11,236
APPLICATIONS WITHDRAWN
2
$140,660
88
$93,233
204
$114,057
20
$231,890
0
$0
38
$91,575
0
$0
FILES CLOSED FOR INCOMPLETENESS
0
$0
12
$86,364
40
$121,492
0
$0
0
$0
4
$112,820
0
$0
Aggregated Statistics For Year 2004 (Based on 2 full and 8 partial tracts)
A) FHA, FSA/RHS & VA Home Purchase Loans
B) Conventional Home Purchase Loans
C) Refinancings
D) Home Improvement Loans
E) Loans on Dwellings For 5+ Families
F) Non-occupant Loans on < 5 Family Dwellings (A B C & D)
G) Loans On Manufactured Home Dwelling (A B C & D)
Number
Average Value
Number
Average Value
Number
Average Value
Number
Average Value
Number
Average Value
Number
Average Value
Number
Average Value
LOANS ORIGINATED
7
$143,969
232
$93,824
252
$102,109
58
$53,889
12
$356,941
136
$94,621
1
$100,640
APPLICATIONS APPROVED, NOT ACCEPTED
2
$89,885
36
$108,187
63
$99,919
9
$21,561
0
$0
28
$91,264
0
$0
APPLICATIONS DENIED
9
$127,324
66
$99,964
190
$92,232
93
$27,113
3
$126,183
72
$65,645
5
$49,514
APPLICATIONS WITHDRAWN
2
$117,880
26
$104,950
210
$104,497
5
$72,236
2
$336,355
28
$108,949
0
$0
FILES CLOSED FOR INCOMPLETENESS
1
$78,210
0
$0
35
$107,097
4
$72,430
0
$0
7
$102,249
0
$0
Aggregated Statistics For Year 2003 (Based on 2 full and 8 partial tracts)
A) FHA, FSA/RHS & VA Home Purchase Loans
B) Conventional Home Purchase Loans
C) Refinancings
D) Home Improvement Loans
E) Loans on Dwellings For 5+ Families
F) Non-occupant Loans on < 5 Family Dwellings (A B C & D)
Number
Average Value
Number
Average Value
Number
Average Value
Number
Average Value
Number
Average Value
Number
Average Value
LOANS ORIGINATED
20
$110,763
117
$92,555
293
$90,506
23
$28,485
1
$394,670
67
$78,783
APPLICATIONS APPROVED, NOT ACCEPTED
7
$107,677
25
$96,898
61
$92,901
2
$20,085
0
$0
20
$84,786
APPLICATIONS DENIED
6
$107,462
51
$102,421
178
$90,419
31
$21,125
8
$203,286
29
$134,964
APPLICATIONS WITHDRAWN
4
$103,342
30
$91,456
125
$93,391
2
$55,900
0
$0
28
$85,410
FILES CLOSED FOR INCOMPLETENESS
2
$97,540
3
$93,887
12
$102,262
0
$0
0
$0
2
$126,985
Aggregated Statistics For Year 2002 (Based on 2 full and 8 partial tracts)
A) FHA, FSA/RHS & VA Home Purchase Loans
B) Conventional Home Purchase Loans
C) Refinancings
D) Home Improvement Loans
E) Loans on Dwellings For 5+ Families
F) Non-occupant Loans on < 5 Family Dwellings (A B C & D)
Number
Average Value
Number
Average Value
Number
Average Value
Number
Average Value
Number
Average Value
Number
Average Value
LOANS ORIGINATED
36
$98,790
128
$83,034
211
$80,443
17
$20,294
4
$1,106,115
68
$72,455
APPLICATIONS APPROVED, NOT ACCEPTED
6
$101,988
22
$73,323
42
$87,562
6
$14,853
0
$0
13
$68,614
APPLICATIONS DENIED
8
$76,696
40
$67,517
114
$78,485
48
$18,428
2
$122,570
24
$72,788
APPLICATIONS WITHDRAWN
8
$80,146
21
$85,324
53
$83,556
9
$16,096
0
$0
6
$66,698
FILES CLOSED FOR INCOMPLETENESS
1
$103,030
14
$70,641
15
$82,243
0
$0
0
$0
7
$49,186
Aggregated Statistics For Year 2001 (Based on 2 full and 8 partial tracts)
A) FHA, FSA/RHS & VA Home Purchase Loans
B) Conventional Home Purchase Loans
C) Refinancings
D) Home Improvement Loans
E) Loans on Dwellings For 5+ Families
F) Non-occupant Loans on < 5 Family Dwellings (A B C & D)
Number
Average Value
Number
Average Value
Number
Average Value
Number
Average Value
Number
Average Value
Number
Average Value
LOANS ORIGINATED
42
$87,679
90
$69,825
123
$78,896
16
$15,271
4
$73,888
25
$69,958
APPLICATIONS APPROVED, NOT ACCEPTED
3
$93,700
14
$72,209
23
$67,358
3
$12,367
0
$0
7
$64,411
APPLICATIONS DENIED
12
$76,318
25
$65,520
154
$62,487
37
$17,557
0
$0
9
$59,517
APPLICATIONS WITHDRAWN
2
$116,440
8
$60,669
72
$73,783
5
$44,748
0
$0
7
$70,019
FILES CLOSED FOR INCOMPLETENESS
0
$0
0
$0
14
$75,489
3
$6,763
0
$0
2
$54,810
Aggregated Statistics For Year 2000 (Based on 2 full and 8 partial tracts)
A) FHA, FSA/RHS & VA Home Purchase Loans
B) Conventional Home Purchase Loans
C) Refinancings
D) Home Improvement Loans
F) Non-occupant Loans on < 5 Family Dwellings (A B C & D)
Number
Average Value
Number
Average Value
Number
Average Value
Number
Average Value
Number
Average Value
LOANS ORIGINATED
40
$76,110
79
$59,782
50
$64,155
34
$17,884
21
$53,183
APPLICATIONS APPROVED, NOT ACCEPTED
5
$83,712
17
$64,941
20
$52,550
17
$23,511
6
$53,233
APPLICATIONS DENIED
10
$80,659
29
$62,154
96
$61,501
78
$19,716
25
$58,884
APPLICATIONS WITHDRAWN
3
$92,887
12
$64,630
64
$59,524
4
$12,108
3
$50,317
FILES CLOSED FOR INCOMPLETENESS
2
$94,670
0
$0
13
$63,562
1
$10,250
3
$57,857
Aggregated Statistics For Year 1999 (Based on 1 full and 4 partial tracts)
A) FHA, FSA/RHS & VA Home Purchase Loans
B) Conventional Home Purchase Loans
C) Refinancings
D) Home Improvement Loans
F) Non-occupant Loans on < 5 Family Dwellings (A B C & D)
2002 - 2018 National Fire Incident Reporting System (NFIRS) incidents
Based on the data from the years 2002 - 2018 the average number of fires per year is 65. The highest number of reported fires - 135 took place in 2002, and the least - 23 in 2013. The data has a decreasing trend.
When looking into fire subcategories, the most reports belonged to: Structure Fires (56.0%), and Outside Fires (28.8%).
Fire incident types reported to NFIRS in Zip Code 01107


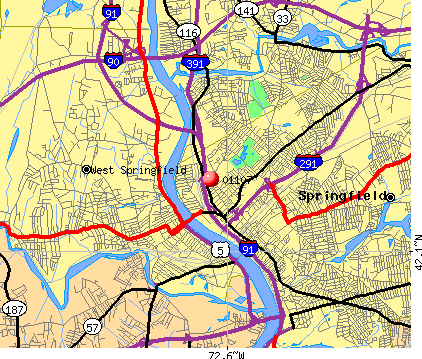 Nearest zip codes: 01199, 01103, 01013, 01105, 01089, 01104.


 Based on the data from the years 2002 - 2018 the average number of fires per year is 65. The highest number of reported fires - 135 took place in 2002, and the least - 23 in 2013. The data has a decreasing trend.
 When looking into fire subcategories, the most reports belonged to: Structure Fires (56.0%), and Outside Fires (28.8%).