Estimated zip code population in 2022: 2,889 Zip code population in 2010: 3,310 Zip code population in 2000: 2,959
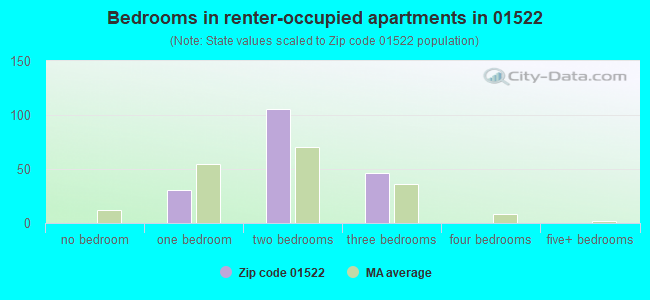
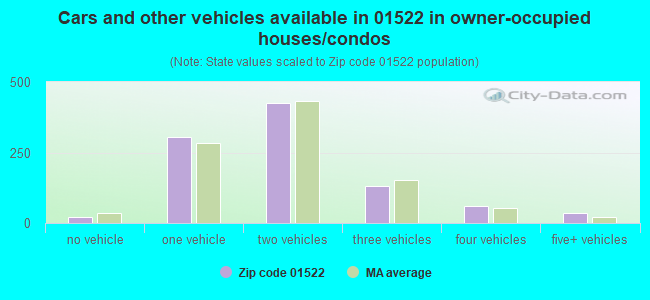
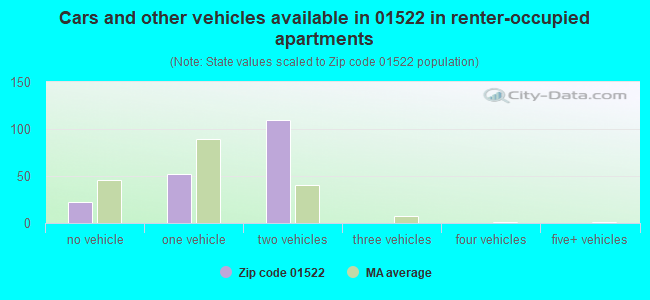
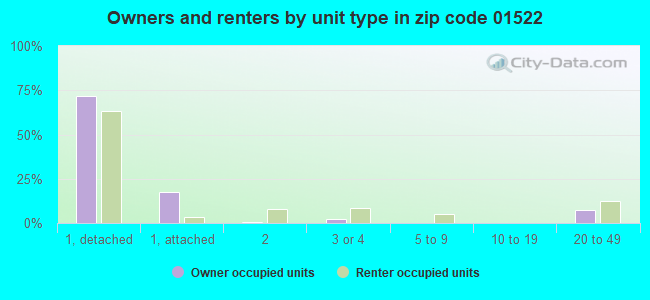
Houses and condos: 1,213 Renter-occupied apartments: 183
% of renters here:
16%
State:
38%
March 2022 cost of living index in zip code 01522: 124.2 (high, U.S. average is 100)
Land area: 16.4 sq. mi. Water area: 0.5 sq. mi.
Population density: 176 people per square mile
(very low).
OSM Map
Google Map
MSN Map
OSM Map
General Map
Google Map
MSN Map
OSM Map
Google Map
MSN Map
OSM Map
Google Map
MSN Map
Please wait while loading the map...
Real estate property taxes paid for housing units in 2022:
This zip code:
1.2% ($5,383)
Massachusetts:
1.0% ($5,536)
Median real estate property taxes paid for housing units with mortgages in 2022: $5,530 (1.2%) Median real estate property taxes paid for housing units with no mortgage in 2022: $5,003 (1.2%)
Business Search- 14 Million verified businesses
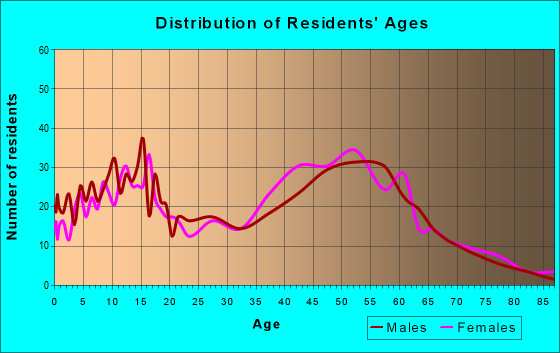
Males: 1,547
(53.5%)
Females: 1,342
(46.5%)
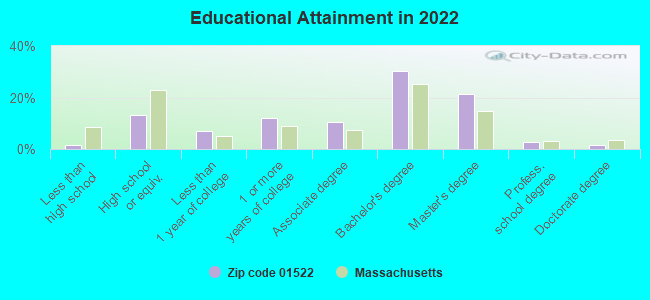
For population 25 years and over in 01522:
High school or higher: 98.5%
Bachelor's degree or higher: 55.9%
Graduate or professional degree: 25.7%
Unemployed: 3.9%
Mean travel time to work (commute): 28.3 minutes
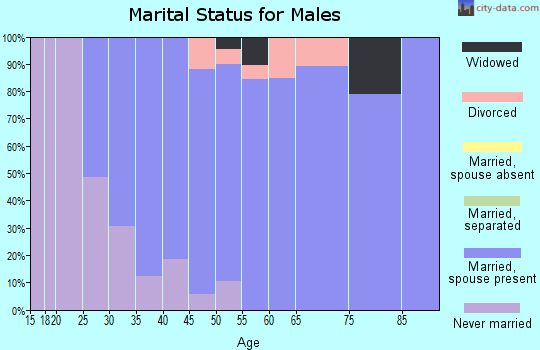
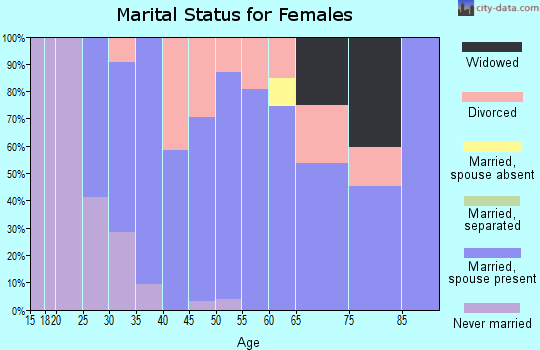
For population 15 years and over in 01522:
Never married: 35.2%
Now married: 52.7%
Separated: 0.3%
Widowed: 4.6%
Divorced: 7.1%
Zip code 01522 compared to state average:
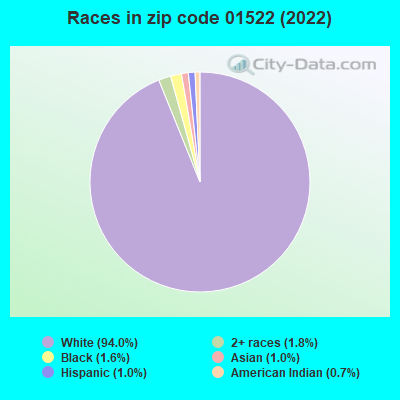
Black race population percentage significantly below state average.
Hispanic race population percentage significantly below state average.
Foreign-born population percentage significantly below state average.
Renting percentage significantly below state average.
Length of stay since moving in significantly above state average.
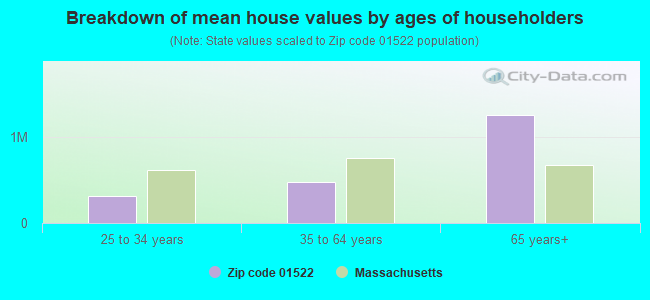
Estimated median house/condo value in 2022: $431,826
01522:
$431,826
Massachusetts:
$534,700
According to our research of Massachusetts and other state lists, there were 2 registered sex offenders living in 01522 zip code as of April 27, 2024. The ratio of all residents to sex offenders in zip code 01522 is 1,714 to 1. The ratio of registered sex offenders to all residents in this zip code is near the state average.
Median resident age:
This zip code:
42.5 years
Massachusetts median age:
40.3 years
Average household size:
This zip code:
2.5 people
Massachusetts:
2.4 people
Averages for the 2020 tax year for zip code 01522, filed in 2021:
Average Adjusted Gross Income (AGI) in 2020: $91,330 (Individual Income Tax Returns)
Here:
$91,330
State:
$105,130
Salary/wage: $82,708 (reported on 83.6% of returns)
Here:
$82,708
State:
$82,951
(% of AGI for various income ranges: 1235.4% for AGIs below $25k, 3864.8% for AGIs $25k-50k, 6409.5% for AGIs $50k-75k, 9900.0% for AGIs $75k-100k, 18578.9% for AGIs $100k-200k, 77220.0% for AGIs over 200k)
Taxable interest for individuals: $791 (reported on 50.3% of returns)
This zip code:
$791
Massachusetts:
$2,361
(% of AGI for various income ranges: 21.2% for AGIs below $25k, 39.6% for AGIs $25k-50k, 17.4% for AGIs $50k-75k, 70.8% for AGIs $75k-100k, 94.3% for AGIs $100k-200k, 408.0% for AGIs over 200k)
Ordinary dividends: $3,157 (reported on 25.1% of returns)
Here:
$3,157
State:
$10,365
(% of AGI for various income ranges: 37.5% for AGIs below $25k, 50.9% for AGIs $25k-50k, 67.4% for AGIs $50k-75k, 123.3% for AGIs $75k-100k, 193.6% for AGIs $100k-200k, 854.0% for AGIs over 200k)
Net capital gain/loss in AGI: +$9,632 (reported on 24.0% of returns)
Here:
+$9,632
State:
+$48,178
(% of AGI for various income ranges: 14.6% for AGIs below $25k, 10.9% for AGIs $25k-50k, 83.7% for AGIs $50k-75k, 191.7% for AGIs $75k-100k, 263.2% for AGIs $100k-200k, 6104.0% for AGIs over 200k)
Profit/loss from business: +$14,885 (reported on 14.8% of returns)
Here:
+$14,885
State:
+$20,792
(% of AGI for various income ranges: 131.2% for AGIs below $25k, 217.0% for AGIs $25k-50k, 286.8% for AGIs $50k-75k, 353.3% for AGIs $75k-100k, 367.1% for AGIs $100k-200k, 2416.0% for AGIs over 200k)
Taxable individual retirement arrangement distribution: $17,757 (reported on 11.5% of returns)
01522:
$17,757
Massachusetts:
$22,790
(% of AGI for various income ranges: 98.8% for AGIs below $25k, 134.8% for AGIs $25k-50k, 286.3% for AGIs $50k-75k, 585.8% for AGIs $75k-100k, 691.1% for AGIs $100k-200k)
Total itemized deductions: $23,589 (reported on 15.3% of returns)
Here:
$23,589
State:
$36,722
(% of AGI for various income ranges: 286.1% for AGIs $25k-50k, 537.4% for AGIs $50k-75k, 1035.0% for AGIs $75k-100k, 780.7% for AGIs $100k-200k, 2996.0% for AGIs over 200k)
Charity contributions: $4,195 (reported on 11.5% of returns)
Here:
$4,195
State:
$12,529
(% of AGI for various income ranges: 56.3% for AGIs $50k-75k, 75.0% for AGIs $75k-100k, 131.8% for AGIs $100k-200k, 630.0% for AGIs over 200k)
Taxes paid: $8,215 (reported on 14.8% of returns)
01522:
$8,215
State:
$8,782
(% of AGI for various income ranges: 76.1% for AGIs $25k-50k, 168.4% for AGIs $50k-75k, 331.7% for AGIs $75k-100k, 294.6% for AGIs $100k-200k, 1000.0% for AGIs over 200k)
Earned income credit: $1,688 (reported on 4.4% of returns)
Here:
$1,688
State:
$1,909
(% of AGI for various income ranges: 31.2% for AGIs below $25k, 26.1% for AGIs $25k-50k)
Percentage of individuals using paid preparers for their 2020 taxes: 91.8%
Here:
92%
State:
92%
(% for various income ranges: 85.7% for AGIs below $25k, 90.9% for AGIs $25k-50k, 92.3% for AGIs $50k-75k, 100.0% for AGIs $75k-100k, 93.6% for AGIs $100k-200k, 93.8% for AGIs over 200k)
Averages for the 2012 tax year for zip code 01522, filed in 2013:
Average Adjusted Gross Income (AGI) in 2012: $71,921 (Individual Income Tax Returns)
Here:
$71,921
State:
$81,425
Salary/wage: $67,213 (reported on 86.3% of returns)
Here:
$67,213
State:
$64,752
(% of AGI for various income ranges: 73.6% for AGIs below $25k, 76.3% for AGIs $25k-50k, 77.8% for AGIs $50k-75k, 80.0% for AGIs $75k-100k, 83.6% for AGIs $100k-200k, 79.9% for AGIs over 200k)
Taxable interest for individuals: $756 (reported on 52.4% of returns)
This zip code:
$756
Massachusetts:
$2,136
(% of AGI for various income ranges: 1.2% for AGIs below $25k, 0.6% for AGIs $25k-50k, 0.6% for AGIs $50k-75k, 0.3% for AGIs $75k-100k, 0.7% for AGIs $100k-200k, 0.2% for AGIs over 200k)
Ordinary dividends: $2,633 (reported on 25.6% of returns)
Here:
$2,633
State:
$9,473
(% of AGI for various income ranges: 2.7% for AGIs below $25k, 1.2% for AGIs $25k-50k, 0.9% for AGIs $50k-75k, 0.7% for AGIs $75k-100k, 0.8% for AGIs $100k-200k, 1.0% for AGIs over 200k)
Net capital gain/loss in AGI: +$2,900 (reported on 19.0% of returns)
Here:
+$2,900
State:
+$31,437
(% of AGI for various income ranges: 1.3% for AGIs $100k-200k, 1.5% for AGIs over 200k)
Profit/loss from business: +$15,372 (reported on 14.9% of returns)
Here:
+$15,372
State:
+$20,662
(% of AGI for various income ranges: 9.5% for AGIs below $25k, 4.3% for AGIs $25k-50k, 4.2% for AGIs $50k-75k, 3.5% for AGIs $75k-100k, 3.3% for AGIs $100k-200k)
Taxable individual retirement arrangement distribution: $13,776 (reported on 10.1% of returns)
01522:
$13,776
Massachusetts:
$18,892
(% of AGI for various income ranges: 5.1% for AGIs below $25k, 2.3% for AGIs $25k-50k, 1.7% for AGIs $50k-75k, 3.5% for AGIs $75k-100k, 1.9% for AGIs $100k-200k)
Total itemized deductions: $21,339 (19% of AGI, reported on 51.8% of returns)
Here:
$21,339
State:
$28,907
Here:
19.4% of AGI
State:
18.2% of AGI
(% of AGI for various income ranges: 20.8% for AGIs below $25k, 11.3% for AGIs $25k-50k, 17.1% for AGIs $50k-75k, 17.9% for AGIs $75k-100k, 16.1% for AGIs $100k-200k, 11.2% for AGIs over 200k)
Charity contributions: $1,986 (reported on 42.3% of returns)
Here:
$1,986
State:
$4,208
(% of AGI for various income ranges: 0.9% for AGIs below $25k, 0.9% for AGIs $25k-50k, 0.9% for AGIs $50k-75k, 1.3% for AGIs $75k-100k, 1.3% for AGIs $100k-200k, 1.1% for AGIs over 200k)
Taxes paid: $10,141 (reported on 51.8% of returns)
01522:
$10,141
State:
$13,303
(% of AGI for various income ranges: 7.1% for AGIs below $25k, 4.2% for AGIs $25k-50k, 7.1% for AGIs $50k-75k, 7.7% for AGIs $75k-100k, 8.0% for AGIs $100k-200k, 7.1% for AGIs over 200k)
Earned income credit: $1,473 (reported on 6.5% of returns)
Here:
$1,473
State:
$1,971
(% of AGI for various income ranges: 2.2% for AGIs below $25k, 0.5% for AGIs $25k-50k)
Percentage of individuals using paid preparers for their 2012 taxes: 50.6%
Here:
51%
State:
56%
(% for various income ranges: 42.0% for AGIs below $25k, 50.0% for AGIs $25k-50k, 60.9% for AGIs $50k-75k, 55.0% for AGIs $75k-100k, 52.6% for AGIs $100k-200k, 57.1% for AGIs over 200k)
Averages for the 2004 tax year for zip code 01522, filed in 2005:
Average Adjusted Gross Income (AGI) in 2004: $61,754 (Individual Income Tax Returns)
Here:
$61,754
State:
$62,877
Salary/wage: $56,275 (reported on 88.0% of returns)
Here:
$56,275
State:
$52,969
(% of AGI for various income ranges: 101.4% for AGIs below $10k, 71.5% for AGIs $10k-25k, 76.4% for AGIs $25k-50k, 86.5% for AGIs $50k-75k, 90.2% for AGIs $75k-100k, 75.4% for AGIs over 100k)
Taxable interest for individuals: $1,060 (reported on 65.8% of returns)
This zip code:
$1,060
Massachusetts:
$1,945
(% of AGI for various income ranges: 4.5% for AGIs below $10k, 2.2% for AGIs $10k-25k, 1.0% for AGIs $25k-50k, 0.6% for AGIs $50k-75k, 0.4% for AGIs $75k-100k, 1.5% for AGIs over 100k)
Taxable dividends: $1,722 (reported on 30.3% of returns)
Here:
$1,722
State:
$5,323
(% of AGI for various income ranges: 2.8% for AGIs below $10k, 0.7% for AGIs $10k-25k, 1.3% for AGIs $25k-50k, 0.4% for AGIs $50k-75k, 0.5% for AGIs $75k-100k, 1.0% for AGIs over 100k)
Net capital gain/loss: +$5,778 (reported on 25.1% of returns)
Here:
+$5,778
State:
+$20,377
(% of AGI for various income ranges: -3.2% for AGIs below $10k, 0.8% for AGIs $10k-25k, -0.1% for AGIs $25k-50k, -0.1% for AGIs $50k-75k, 0.2% for AGIs $75k-100k, 4.8% for AGIs over 100k)
Profit/loss from business: +$15,567 (reported on 16.3% of returns)
Here:
+$15,567
State:
+$17,837
(% of AGI for various income ranges: 0.9% for AGIs below $10k, 6.1% for AGIs $10k-25k, 7.6% for AGIs $25k-50k, 2.8% for AGIs $50k-75k, 5.3% for AGIs $75k-100k, 3.2% for AGIs over 100k)
IRA payment deduction: $3,469 (reported on 3.3% of returns)
01522:
$3,469
Massachusetts:
$3,100
Self-employed pension: $9,105 (reported on 1.3% of returns)
Here:
$9,105
Massachusetts:
$14,516
Total itemized deductions: $19,548 (21% of AGI, reported on 53.1% of returns)
Here:
$19,548
State:
$22,573
Here:
20.6% of AGI
State:
19.5% of AGI
(% of AGI for various income ranges: 16.4% for AGIs below $10k, 10.7% for AGIs $10k-25k, 14.4% for AGIs $25k-50k, 18.7% for AGIs $50k-75k, 20.1% for AGIs $75k-100k, 16.0% for AGIs over 100k)
Charity contributions deductions: $1,977 (2% of AGI, reported on 48.3% of returns)
Here:
$1,977
State:
$3,295
Here:
2.1% of AGI
State:
2.7% of AGI
(% of AGI for various income ranges: 1.1% for AGIs $10k-25k, 1.0% for AGIs $25k-50k, 1.5% for AGIs $50k-75k, 1.7% for AGIs $75k-100k, 1.7% for AGIs over 100k)
Total tax: $8,882 (reported on 83.5% of returns)
01522:
$8,882
State:
$11,494
(% of AGI for various income ranges: 2.5% for AGIs below $10k, 5.1% for AGIs $10k-25k, 8.6% for AGIs $25k-50k, 8.7% for AGIs $50k-75k, 10.0% for AGIs $75k-100k, 15.5% for AGIs over 100k)
Earned income credit: $1,082 (reported on 4.8% of returns)
Here:
$1,082
State:
$1,518
Percentage of individuals using paid preparers for their 2004 taxes: 51.4%
Here:
51%
State:
58%
(% for various income ranges: 40.1% for AGIs below $10k, 47.1% for AGIs $10k-25k, 51.8% for AGIs $25k-50k, 60.2% for AGIs $50k-75k, 56.7% for AGIs $75k-100k, 54.1% for AGIs over 100k)
Household received Food Stamps/SNAP in the past 12 months: 36 Household did not receive Food Stamps/SNAP in the past 12 months: 1,100
Women who had a birth in the past 12 months: 37 (32 now married, 5 unmarried) Women who did not have a birth in the past 12 months: 626 (276 now married, 347 unmarried)
Housing units in zip code 01522 with a mortgage: 631 (44 second mortgage, 7 home equity loan, 30 both second mortgage and home equity loan) Houses without a mortgage: 56
Median monthly owner costs for units with a mortgage: $2,137 Median monthly owner costs for units without a mortgage: $906
Residents with income below the poverty level in 2022:
This zip code:
6.2%
Whole state:
10.4%
Residents with income below 50% of the poverty level in 2022:
This zip code:
4.1%
Whole state:
5.1%
Median number of rooms in houses and condos:
Here:
6.5
State:
6.5
Median number of rooms in apartments:
Here:
4.2
State:
4.0
Notable locations in this zip code not listed on our city pages
Notable locations in zip code 01522: Holden Hills Country Club (A), Fairbrook Country Club (B), Holden Fire Department Station 1 Headquarters (C). Display/hide their locations on the map
Lakes and reservoirs: Poutwater Pond (A), Maple Spring Pond (B), Eagle Lake (C), Quinapoxet Reservoir (D), Stump Pond (E), Cournoyer Pond (F). Display/hide their locations on the map
Streams, rivers, and creeks: Muschopauge Brook (A), Worcester Brook (B), Asnebumskit Brook (C), Ball Brook (D), Cold Brook (E), Governor Brook (F), Trout Brook (G), Warren Tannery Brook (H). Display/hide their locations on the map
In group quarters: 5 (-1 institutionalized population)
Size of family households: 288 2-persons, 115 3-persons, 204 4-persons, 31 5-persons, 39 6-persons, 30 7-or-more-persons
Size of nonfamily households: 372 1-person, 71 2-persons, 9 3-persons
540 married couples with children.
58 single-parent households (17 men, 41 women).
90.5% of residents of 01522 zip code speak English at home.
0.4% of residents speak Spanish at home (50% very well, 50% well).
7.6% of residents speak other Indo-European language at home (73% very well, 24% well, 3% not well).
0.4% of residents speak Asian or Pacific Island language at home (100% well).
Foreign born population: 200 (6.9%) (35.1% of them are naturalized citizens)
This zip code:
6.9%
Whole state:
18.0%
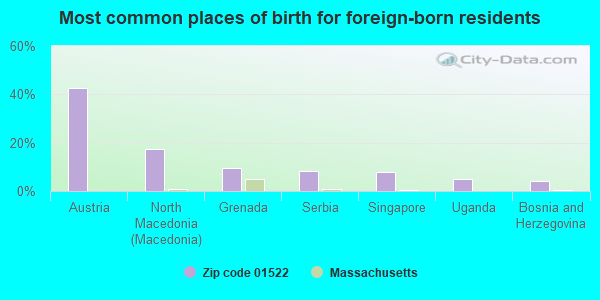
43%Austria
17%North Macedonia (Macedonia)
9%Grenada
8%Serbia
8%Singapore
5%Uganda
4%Bosnia and Herzegovina
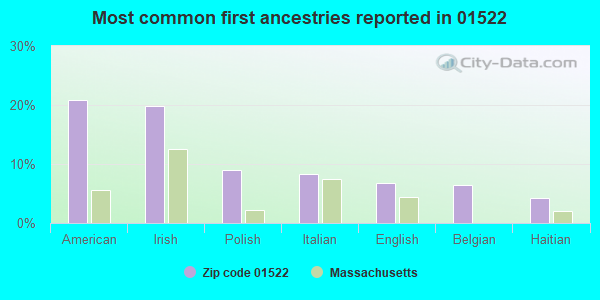
21%American
20%Irish
9%Polish
8%Italian
7%English
6%Belgian
4%Haitian
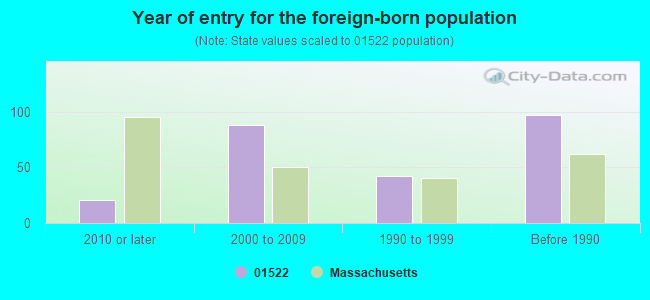
Year of entry for the foreign-born population
212010 or later
882000 to 2009
421990 to 1999
97Before 1990
Public school in in zip code 01522 not listed on the city page:
EARLY CHILDHOOD CENTER (Location: 1745 MAIN STREET, Grades: PK)
Facilities with environmental interests located in this zip code:
ECC CORPORATION (156 PRINCETON ST. in JEFFERSON, MA)
AIR MINOR (AIRS/AFS) SUPERFUND (Superfund database) CRITERIA AND HAZARDOUS AIR POLLUTANT INVENTORY (Inventory of air pollution sources) National Pollutant Discharge Elimination System NON-MAJOR (Tracking pollutant discharge elimination systems) - permit HAZARDOUS WASTE BIENNIAL REPORTER (Resource Conservation and Recovery Act (tracking hazardous waste)) Large Quantity Generators, more that 1000 kg of hazardous waste/month (Resource Conservation and Recovery Act (tracking hazardous waste)) TSD (Resource Conservation and Recovery Act (tracking hazardous waste)) TRI REPORTER (Tracking of toxic chemicals releasing facilities) Business SIC classification: ELECTROPLATING, PLATING, POLISHING, ANODIZING, AND COLORING; PRINTED CIRCUIT BOARDS; ELECTRONIC COMPONENTS Business NAICS classification: BARE PRINTED CIRCUIT BOARD MANUFACTURING. Organizations: KENNETH JOHNSON (CONTACT/OPERATOR)
, KENNETH JOHNSON (CONTACT/OWNER)
Alternative names: E C & C CORP, E C C CORP
LEAHY EXCAVATING CO INC (1403 WACHUSETT ST in JEFFERSON, MA)
(Integrated Compliance Information System) - ICIS-01-1996-0010, FORMAL ENFORCEMENT ACTION Business SIC classification: EXCAVATION WORK
Housing units lacking complete kitchen facilities: 2.0%
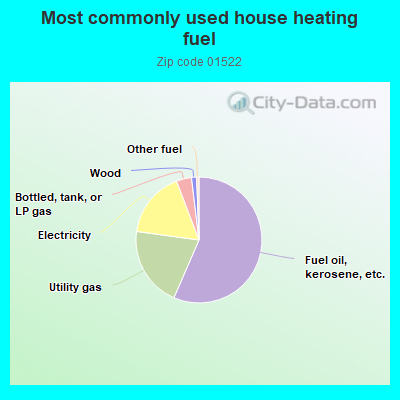
56.7%Fuel oil, kerosene, etc.
20.7%Utility gas
17.1%Electricity
3.9%Bottled, tank, or LP gas
1.3%Wood
0.6%Other fuel
Population in 1990: 2,478. Population change in the 1990s: +481 (+19.4%).
Place of birth for U.S.-born residents:
This state: 2,046
Northeast: 379
Midwest: 29
South: 108
West: 48
68% of the 01522 zip code residents lived in the same house 5 years ago. Out of people who lived in different houses, 74% lived in this county. Out of people who lived in different counties, 50% lived in Massachusetts.
96% of the 01522 zip code residents lived in the same house 1 year ago. Out of people who lived in different houses, 53% moved from this county. Out of people who lived in different houses, 6% moved from different county within same state. Out of people who lived in different houses, 25% moved from different state. Out of people who lived in different houses, 18% moved from abroad.
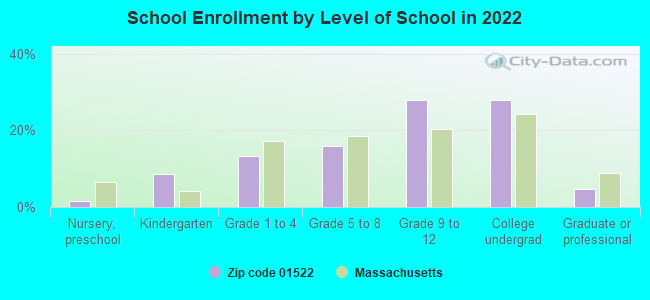
Private vs. public school enrollment:
Students in private schools in grades 1 to 8 (elementary and middle school):
Here:
0.0%
Massachusetts:
10.3%
Students in private schools in grades 9 to 12 (high school): 19
Here:
10.1%
Massachusetts:
12.3%
Students in private undergraduate colleges: 23
Here:
12.6%
Massachusetts:
51.2%
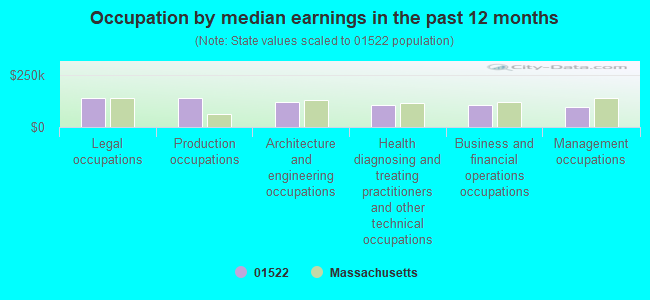
Occupation by median earnings in the past 12 months ($)
139,891Legal occupations
136,979Production occupations
120,452Architecture and engineering occupations
105,553Health diagnosing and treating practitioners and other technical occupations
105,080Business and financial operations occupations
95,518Management occupations
Top industries in this zip code by the number of employees in 2005:
Accommodation and Food Services: Full-Service Restaurants (20-49 employees: 1 establishment)
Health Care and Social Assistance: Child Day Care Services (20-49: 1)
Construction: New Single-Family Housing Construction (except Operative Builders) (10-19: 1, 1-4: 1)
Administrative and Support and Waste Management and Remediation Services: Landscaping Services (10-19: 1)
Other Services (except Public Administration): Religious Organizations (5-9: 1)
Administrative and Support and Waste Management and Remediation Services: Janitorial Services (5-9: 1)
Health Care and Social Assistance: Residential Mental Retardation Facilities (5-9: 1)
Other Services (except Public Administration): General Automotive Repair (5-9: 1)
Fatal accident statistics in 2014:
Fatal accident count: 1
Vehicles involved in fatal accidents: 1
Fatal accidents caused by drunken drivers: 0
Fatalities: 1
Persons involved in fatal accidents: 1
Pedestrians involved in fatal accidents: 0
Home Mortgage Disclosure Act Aggregated Statistics For Year 2009 (Based on 4 partial tracts)
A) FHA, FSA/RHS & VA Home Purchase Loans
B) Conventional Home Purchase Loans
C) Refinancings
D) Home Improvement Loans
F) Non-occupant Loans on < 5 Family Dwellings (A B C & D)
Number
Average Value
Number
Average Value
Number
Average Value
Number
Average Value
Number
Average Value
LOANS ORIGINATED
22
$247,523
80
$231,533
363
$225,474
20
$92,157
11
$185,565
APPLICATIONS APPROVED, NOT ACCEPTED
5
$219,258
4
$157,030
31
$223,036
2
$15,590
1
$375,750
APPLICATIONS DENIED
1
$130,250
7
$238,987
96
$255,758
4
$165,530
1
$120,270
APPLICATIONS WITHDRAWN
0
$0
4
$239,465
71
$234,094
4
$147,595
0
$0
FILES CLOSED FOR INCOMPLETENESS
1
$332,060
2
$213,230
17
$228,297
0
$0
0
$0
Aggregated Statistics For Year 2008 (Based on 4 partial tracts)
A) FHA, FSA/RHS & VA Home Purchase Loans
B) Conventional Home Purchase Loans
C) Refinancings
D) Home Improvement Loans
F) Non-occupant Loans on < 5 Family Dwellings (A B C & D)
Number
Average Value
Number
Average Value
Number
Average Value
Number
Average Value
Number
Average Value
LOANS ORIGINATED
12
$252,353
97
$221,475
146
$247,120
25
$102,686
13
$184,867
APPLICATIONS APPROVED, NOT ACCEPTED
0
$0
6
$314,133
19
$254,374
4
$12,742
0
$0
APPLICATIONS DENIED
0
$0
6
$276,825
66
$252,567
10
$137,931
1
$74,580
APPLICATIONS WITHDRAWN
0
$0
10
$258,481
24
$204,184
2
$37,435
1
$61,970
FILES CLOSED FOR INCOMPLETENESS
1
$434,010
3
$265,097
13
$240,682
3
$120,847
1
$78,780
Aggregated Statistics For Year 2007 (Based on 4 partial tracts)
A) FHA, FSA/RHS & VA Home Purchase Loans
B) Conventional Home Purchase Loans
C) Refinancings
D) Home Improvement Loans
F) Non-occupant Loans on < 5 Family Dwellings (A B C & D)
Number
Average Value
Number
Average Value
Number
Average Value
Number
Average Value
Number
Average Value
LOANS ORIGINATED
6
$225,013
122
$228,090
151
$191,736
44
$76,662
5
$163,828
APPLICATIONS APPROVED, NOT ACCEPTED
1
$147,580
12
$173,139
26
$182,670
3
$32,947
2
$40,995
APPLICATIONS DENIED
0
$0
18
$221,110
105
$242,185
15
$146,349
7
$97,994
APPLICATIONS WITHDRAWN
0
$0
12
$251,564
30
$213,305
8
$110,541
2
$131,310
FILES CLOSED FOR INCOMPLETENESS
0
$0
1
$210,080
8
$267,360
0
$0
0
$0
Aggregated Statistics For Year 2006 (Based on 4 partial tracts)
A) FHA, FSA/RHS & VA Home Purchase Loans
B) Conventional Home Purchase Loans
C) Refinancings
D) Home Improvement Loans
E) Loans on Dwellings For 5+ Families
F) Non-occupant Loans on < 5 Family Dwellings (A B C & D)
Number
Average Value
Number
Average Value
Number
Average Value
Number
Average Value
Number
Average Value
Number
Average Value
LOANS ORIGINATED
6
$289,823
176
$207,368
233
$197,803
47
$60,158
1
$728,200
11
$135,533
APPLICATIONS APPROVED, NOT ACCEPTED
0
$0
14
$199,481
29
$151,316
8
$76,108
0
$0
2
$335,195
APPLICATIONS DENIED
0
$0
11
$136,323
116
$232,957
12
$79,302
0
$0
1
$221,370
APPLICATIONS WITHDRAWN
0
$0
4
$224,492
69
$255,553
5
$126,134
0
$0
1
$268,380
FILES CLOSED FOR INCOMPLETENESS
0
$0
2
$262,835
22
$262,936
1
$50,970
0
$0
0
$0
Aggregated Statistics For Year 2005 (Based on 4 partial tracts)
A) FHA, FSA/RHS & VA Home Purchase Loans
B) Conventional Home Purchase Loans
C) Refinancings
D) Home Improvement Loans
F) Non-occupant Loans on < 5 Family Dwellings (A B C & D)
Number
Average Value
Number
Average Value
Number
Average Value
Number
Average Value
Number
Average Value
LOANS ORIGINATED
0
$0
163
$225,902
273
$212,791
44
$87,102
17
$199,161
APPLICATIONS APPROVED, NOT ACCEPTED
0
$0
14
$231,286
24
$176,448
7
$66,503
2
$450,140
APPLICATIONS DENIED
1
$410,700
23
$259,733
74
$232,159
19
$105,045
1
$199,530
APPLICATIONS WITHDRAWN
1
$175,420
11
$239,373
78
$213,160
7
$122,629
3
$187,390
FILES CLOSED FOR INCOMPLETENESS
0
$0
6
$158,335
48
$257,705
0
$0
3
$290,483
Aggregated Statistics For Year 2004 (Based on 4 partial tracts)
A) FHA, FSA/RHS & VA Home Purchase Loans
B) Conventional Home Purchase Loans
C) Refinancings
D) Home Improvement Loans
F) Non-occupant Loans on < 5 Family Dwellings (A B C & D)
Number
Average Value
Number
Average Value
Number
Average Value
Number
Average Value
Number
Average Value
LOANS ORIGINATED
8
$226,140
144
$220,782
288
$185,010
25
$137,279
6
$166,292
APPLICATIONS APPROVED, NOT ACCEPTED
0
$0
18
$265,428
29
$204,786
9
$59,232
3
$147,227
APPLICATIONS DENIED
1
$103,990
13
$227,202
65
$178,251
11
$39,471
3
$62,627
APPLICATIONS WITHDRAWN
0
$0
10
$214,222
76
$178,844
3
$185,473
0
$0
FILES CLOSED FOR INCOMPLETENESS
0
$0
3
$164,450
48
$195,742
4
$161,660
0
$0
Aggregated Statistics For Year 2003 (Based on 4 partial tracts)
A) FHA, FSA/RHS & VA Home Purchase Loans
B) Conventional Home Purchase Loans
C) Refinancings
D) Home Improvement Loans
F) Non-occupant Loans on < 5 Family Dwellings (A B C & D)
Number
Average Value
Number
Average Value
Number
Average Value
Number
Average Value
Number
Average Value
LOANS ORIGINATED
16
$224,189
133
$207,979
842
$167,078
15
$76,391
15
$149,647
APPLICATIONS APPROVED, NOT ACCEPTED
0
$0
16
$242,006
66
$168,921
3
$25,663
3
$280,113
APPLICATIONS DENIED
1
$90,860
9
$285,162
128
$176,029
7
$46,927
3
$94,990
APPLICATIONS WITHDRAWN
0
$0
16
$175,038
88
$160,828
5
$37,932
1
$102,940
FILES CLOSED FOR INCOMPLETENESS
0
$0
0
$0
15
$208,671
1
$15,230
0
$0
Aggregated Statistics For Year 2002 (Based on 4 partial tracts)
A) FHA, FSA/RHS & VA Home Purchase Loans
B) Conventional Home Purchase Loans
C) Refinancings
D) Home Improvement Loans
F) Non-occupant Loans on < 5 Family Dwellings (A B C & D)
Number
Average Value
Number
Average Value
Number
Average Value
Number
Average Value
Number
Average Value
LOANS ORIGINATED
3
$153,020
96
$202,241
566
$150,908
26
$48,393
6
$159,498
APPLICATIONS APPROVED, NOT ACCEPTED
0
$0
8
$233,508
43
$123,162
9
$38,916
0
$0
APPLICATIONS DENIED
1
$101,360
7
$218,511
54
$162,597
12
$34,756
0
$0
APPLICATIONS WITHDRAWN
1
$230,110
12
$213,663
55
$145,581
7
$44,506
2
$154,900
FILES CLOSED FOR INCOMPLETENESS
0
$0
1
$52,520
26
$159,301
0
$0
0
$0
Aggregated Statistics For Year 2001 (Based on 4 partial tracts)
A) FHA, FSA/RHS & VA Home Purchase Loans
B) Conventional Home Purchase Loans
C) Refinancings
D) Home Improvement Loans
F) Non-occupant Loans on < 5 Family Dwellings (A B C & D)
Number
Average Value
Number
Average Value
Number
Average Value
Number
Average Value
Number
Average Value
LOANS ORIGINATED
9
$172,594
112
$187,599
342
$143,317
20
$46,416
7
$176,723
APPLICATIONS APPROVED, NOT ACCEPTED
1
$150,730
16
$199,714
30
$109,131
22
$40,196
0
$0
APPLICATIONS DENIED
3
$147,097
5
$192,808
53
$118,625
19
$34,213
1
$297,110
APPLICATIONS WITHDRAWN
0
$0
8
$148,749
46
$117,649
7
$44,690
1
$396,140
FILES CLOSED FOR INCOMPLETENESS
0
$0
1
$145,640
7
$160,677
0
$0
0
$0
Aggregated Statistics For Year 2000 (Based on 4 partial tracts)
A) FHA, FSA/RHS & VA Home Purchase Loans
B) Conventional Home Purchase Loans
C) Refinancings
D) Home Improvement Loans
F) Non-occupant Loans on < 5 Family Dwellings (A B C & D)
Number
Average Value
Number
Average Value
Number
Average Value
Number
Average Value
Number
Average Value
LOANS ORIGINATED
14
$141,850
115
$163,524
77
$116,383
25
$34,990
3
$117,970
APPLICATIONS APPROVED, NOT ACCEPTED
2
$117,665
7
$159,347
21
$71,013
12
$36,674
4
$88,112
APPLICATIONS DENIED
0
$0
9
$135,922
47
$106,984
9
$20,593
0
$0
APPLICATIONS WITHDRAWN
0
$0
5
$149,808
38
$99,494
6
$18,013
0
$0
FILES CLOSED FOR INCOMPLETENESS
2
$142,570
2
$97,980
3
$151,313
1
$16,810
0
$0
Aggregated Statistics For Year 1999 (Based on 2 partial tracts)
A) FHA, FSA/RHS & VA Home Purchase Loans
B) Conventional Home Purchase Loans
C) Refinancings
D) Home Improvement Loans
F) Non-occupant Loans on < 5 Family Dwellings (A B C & D)


 Nearest zip codes: 01520, 01541, 01583, 01606, 01609, 01612.
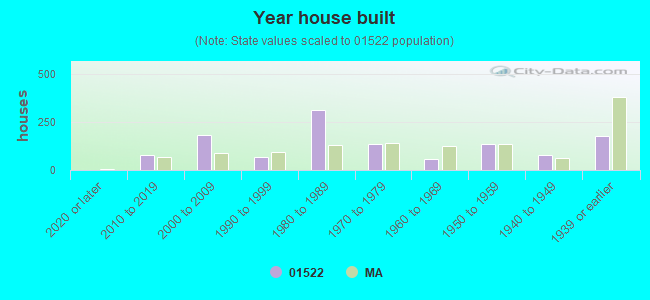


 (Location: 1745 MAIN STREET, Grades: PK)