Estimated zip code population in 2022: 12,169 Zip code population in 2010: 10,955 Zip code population in 2000: 10,554
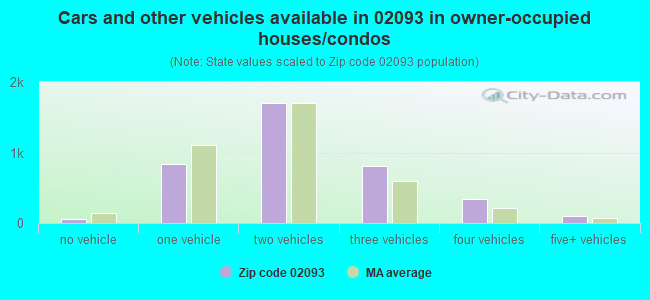
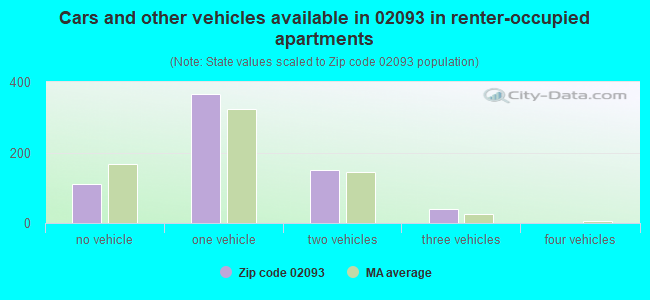
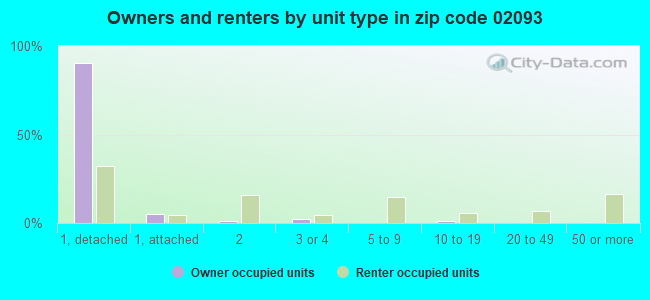
Houses and condos: 4,767 Renter-occupied apartments: 666
% of renters here:
15%
State:
38%
March 2022 cost of living index in zip code 02093: 130.2 (high, U.S. average is 100)
Land area: 21.7 sq. mi. Water area: 0.9 sq. mi.
Population density: 561 people per square mile
(low).
OSM Map
Google Map
MSN Map
OSM Map
General Map
Google Map
MSN Map
OSM Map
Google Map
MSN Map
OSM Map
Google Map
MSN Map
Please wait while loading the map...
Real estate property taxes paid for housing units in 2022:
This zip code:
1.1% ($6,756)
Massachusetts:
1.0% ($5,536)
Median real estate property taxes paid for housing units with mortgages in 2022: $6,755 (1.0%) Median real estate property taxes paid for housing units with no mortgage in 2022: $6,762 (1.2%)
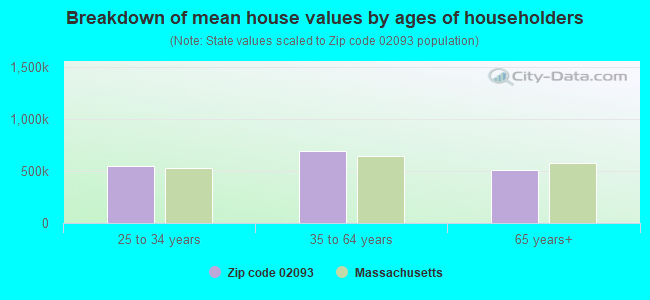
Estimated median house/condo value in 2022: $628,623
02093:
$628,623
Massachusetts:
$534,700
According to our research of Massachusetts and other state lists, there were 2 registered sex offenders living in 02093 zip code as of May 09, 2024. The ratio of all residents to sex offenders in zip code 02093 is 5,824 to 1. The ratio of registered sex offenders to all residents in this zip code is much lower than the state average.
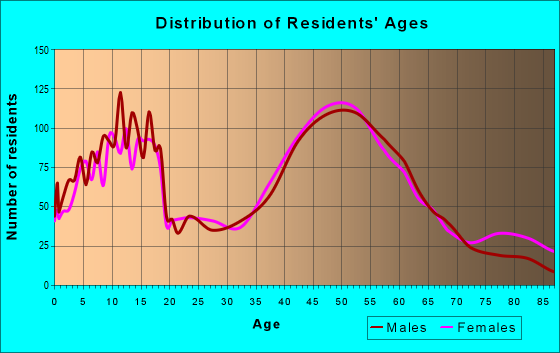
Median resident age:
This zip code:
47.9 years
Massachusetts median age:
40.3 years
Average household size:
This zip code:
2.6 people
Massachusetts:
2.4 people
Averages for the 2020 tax year for zip code 02093, filed in 2021:
Average Adjusted Gross Income (AGI) in 2020: $127,186 (Individual Income Tax Returns)
Here:
$127,186
State:
$105,130
Salary/wage: $107,244 (reported on 84.4% of returns)
Here:
$107,244
State:
$82,951
(% of AGI for various income ranges: 1098.4% for AGIs below $25k, 3597.8% for AGIs $25k-50k, 6194.0% for AGIs $50k-75k, 9422.1% for AGIs $75k-100k, 20249.4% for AGIs $100k-200k, 95244.4% for AGIs over 200k)
Taxable interest for individuals: $1,487 (reported on 46.8% of returns)
This zip code:
$1,487
Massachusetts:
$2,361
(% of AGI for various income ranges: 24.4% for AGIs below $25k, 41.6% for AGIs $25k-50k, 47.4% for AGIs $50k-75k, 67.9% for AGIs $75k-100k, 151.4% for AGIs $100k-200k, 680.0% for AGIs over 200k)
Ordinary dividends: $6,146 (reported on 32.9% of returns)
Here:
$6,146
State:
$10,365
(% of AGI for various income ranges: 46.1% for AGIs below $25k, 75.9% for AGIs $25k-50k, 104.0% for AGIs $50k-75k, 238.4% for AGIs $75k-100k, 301.0% for AGIs $100k-200k, 2481.9% for AGIs over 200k)
Net capital gain/loss in AGI: +$29,346 (reported on 29.0% of returns)
Here:
+$29,346
State:
+$48,178
(% of AGI for various income ranges: 29.9% for AGIs below $25k, 48.3% for AGIs $25k-50k, 133.1% for AGIs $50k-75k, 175.5% for AGIs $75k-100k, 512.0% for AGIs $100k-200k, 14879.4% for AGIs over 200k)
Profit/loss from business: +$22,522 (reported on 15.4% of returns)
Here:
+$22,522
State:
+$20,792
(% of AGI for various income ranges: 84.9% for AGIs below $25k, 206.6% for AGIs $25k-50k, 242.1% for AGIs $50k-75k, 332.1% for AGIs $75k-100k, 902.4% for AGIs $100k-200k, 3107.2% for AGIs over 200k)
Taxable individual retirement arrangement distribution: $20,025 (reported on 11.4% of returns)
02093:
$20,025
Massachusetts:
$22,790
(% of AGI for various income ranges: 80.5% for AGIs below $25k, 179.7% for AGIs $25k-50k, 275.5% for AGIs $50k-75k, 541.8% for AGIs $75k-100k, 836.3% for AGIs $100k-200k, 706.6% for AGIs over 200k)
Self-employed (Keogh) retirement plans: $24,075 (reported on 1.3% of returns)
02093:
$24,075
Massachusetts:
$26,868
(% of AGI for various income ranges: 68.8% for AGIs $100k-200k, 430.0% for AGIs over 200k)
Total itemized deductions: $30,678 (reported on 20.0% of returns)
Here:
$30,678
State:
$36,722
(% of AGI for various income ranges: 99.1% for AGIs below $25k, 246.4% for AGIs $25k-50k, 644.7% for AGIs $50k-75k, 888.9% for AGIs $75k-100k, 1503.6% for AGIs $100k-200k, 5349.4% for AGIs over 200k)
Charity contributions: $6,000 (reported on 16.0% of returns)
Here:
$6,000
State:
$12,529
(% of AGI for various income ranges: 4.6% for AGIs below $25k, 11.9% for AGIs $25k-50k, 40.3% for AGIs $50k-75k, 79.2% for AGIs $75k-100k, 176.9% for AGIs $100k-200k, 1248.8% for AGIs over 200k)
Taxes paid: $9,076 (reported on 20.0% of returns)
02093:
$9,076
State:
$8,782
(% of AGI for various income ranges: 24.0% for AGIs below $25k, 59.8% for AGIs $25k-50k, 163.8% for AGIs $50k-75k, 328.9% for AGIs $75k-100k, 511.0% for AGIs $100k-200k, 1427.5% for AGIs over 200k)
Earned income credit: $1,419 (reported on 4.3% of returns)
Here:
$1,419
State:
$1,909
(% of AGI for various income ranges: 26.0% for AGIs below $25k, 26.6% for AGIs $25k-50k)
Percentage of individuals using paid preparers for their 2020 taxes: 93.2%
Here:
93%
State:
92%
(% for various income ranges: 90.5% for AGIs below $25k, 93.3% for AGIs $25k-50k, 93.9% for AGIs $50k-75k, 94.9% for AGIs $75k-100k, 93.2% for AGIs $100k-200k, 95.2% for AGIs over 200k)
Averages for the 2012 tax year for zip code 02093, filed in 2013:
Average Adjusted Gross Income (AGI) in 2012: $104,592 (Individual Income Tax Returns)
Here:
$104,592
State:
$81,425
Salary/wage: $90,944 (reported on 86.8% of returns)
Here:
$90,944
State:
$64,752
(% of AGI for various income ranges: 71.7% for AGIs below $25k, 73.9% for AGIs $25k-50k, 73.4% for AGIs $50k-75k, 76.5% for AGIs $75k-100k, 83.8% for AGIs $100k-200k, 70.4% for AGIs over 200k)
Taxable interest for individuals: $1,643 (reported on 50.7% of returns)
This zip code:
$1,643
Massachusetts:
$2,136
(% of AGI for various income ranges: 1.7% for AGIs below $25k, 0.6% for AGIs $25k-50k, 0.7% for AGIs $50k-75k, 0.5% for AGIs $75k-100k, 0.4% for AGIs $100k-200k, 1.1% for AGIs over 200k)
Ordinary dividends: $4,297 (reported on 31.9% of returns)
Here:
$4,297
State:
$9,473
(% of AGI for various income ranges: 2.5% for AGIs below $25k, 1.2% for AGIs $25k-50k, 1.7% for AGIs $50k-75k, 1.2% for AGIs $75k-100k, 1.2% for AGIs $100k-200k, 1.3% for AGIs over 200k)
Net capital gain/loss in AGI: +$9,022 (reported on 25.7% of returns)
Here:
+$9,022
State:
+$31,437
(% of AGI for various income ranges: 0.8% for AGIs $50k-75k, 1.2% for AGIs $75k-100k, 1.2% for AGIs $100k-200k, 3.7% for AGIs over 200k)
Profit/loss from business: +$21,341 (reported on 15.5% of returns)
Here:
+$21,341
State:
+$20,662
(% of AGI for various income ranges: 6.7% for AGIs below $25k, 4.4% for AGIs $25k-50k, 4.3% for AGIs $50k-75k, 2.7% for AGIs $75k-100k, 3.5% for AGIs $100k-200k, 2.5% for AGIs over 200k)
Taxable individual retirement arrangement distribution: $16,617 (reported on 11.2% of returns)
02093:
$16,617
Massachusetts:
$18,892
(% of AGI for various income ranges: 4.9% for AGIs below $25k, 3.0% for AGIs $25k-50k, 3.0% for AGIs $50k-75k, 3.1% for AGIs $75k-100k, 2.0% for AGIs $100k-200k, 0.9% for AGIs over 200k)
Self-employment retirement plans: $19,256 (reported on 1.7% of returns)
02093:
$19,256
Massachusetts:
$20,669
Total itemized deductions: $28,971 (17% of AGI, reported on 53.7% of returns)
Here:
$28,971
State:
$28,907
Here:
17.0% of AGI
State:
18.2% of AGI
(% of AGI for various income ranges: 20.3% for AGIs below $25k, 13.0% for AGIs $25k-50k, 17.8% for AGIs $50k-75k, 18.2% for AGIs $75k-100k, 18.1% for AGIs $100k-200k, 11.6% for AGIs over 200k)
Charity contributions: $2,701 (reported on 47.4% of returns)
Here:
$2,701
State:
$4,208
(% of AGI for various income ranges: 0.6% for AGIs below $25k, 1.0% for AGIs $25k-50k, 1.2% for AGIs $50k-75k, 1.2% for AGIs $75k-100k, 1.3% for AGIs $100k-200k, 1.2% for AGIs over 200k)
Taxes paid: $14,523 (reported on 53.7% of returns)
02093:
$14,523
State:
$13,303
(% of AGI for various income ranges: 4.9% for AGIs below $25k, 4.7% for AGIs $25k-50k, 6.6% for AGIs $50k-75k, 7.9% for AGIs $75k-100k, 8.7% for AGIs $100k-200k, 7.2% for AGIs over 200k)
Earned income credit: $1,450 (reported on 6.0% of returns)
Here:
$1,450
State:
$1,971
(% of AGI for various income ranges: 2.1% for AGIs below $25k, 0.4% for AGIs $25k-50k)
Percentage of individuals using paid preparers for their 2012 taxes: 58.2%
Here:
58%
State:
56%
(% for various income ranges: 49.1% for AGIs below $25k, 55.1% for AGIs $25k-50k, 62.5% for AGIs $50k-75k, 65.3% for AGIs $75k-100k, 60.7% for AGIs $100k-200k, 71.7% for AGIs over 200k)
Averages for the 2004 tax year for zip code 02093, filed in 2005:
Average Adjusted Gross Income (AGI) in 2004: $76,124 (Individual Income Tax Returns)
Here:
$76,124
State:
$62,877
Salary/wage: $70,942 (reported on 86.2% of returns)
Here:
$70,942
State:
$52,969
(% of AGI for various income ranges: 122.3% for AGIs below $10k, 65.5% for AGIs $10k-25k, 78.4% for AGIs $25k-50k, 78.3% for AGIs $50k-75k, 85.4% for AGIs $75k-100k, 80.1% for AGIs over 100k)
Taxable interest for individuals: $1,315 (reported on 66.0% of returns)
This zip code:
$1,315
Massachusetts:
$1,945
(% of AGI for various income ranges: 6.0% for AGIs below $10k, 3.0% for AGIs $10k-25k, 1.8% for AGIs $25k-50k, 1.6% for AGIs $50k-75k, 0.8% for AGIs $75k-100k, 0.9% for AGIs over 100k)
Taxable dividends: $2,260 (reported on 38.2% of returns)
Here:
$2,260
State:
$5,323
(% of AGI for various income ranges: 4.7% for AGIs below $10k, 2.0% for AGIs $10k-25k, 1.4% for AGIs $25k-50k, 1.2% for AGIs $50k-75k, 0.8% for AGIs $75k-100k, 1.1% for AGIs over 100k)
Net capital gain/loss: +$9,503 (reported on 29.9% of returns)
Here:
+$9,503
State:
+$20,377
(% of AGI for various income ranges: -4.0% for AGIs below $10k, -0.7% for AGIs $10k-25k, -0.0% for AGIs $25k-50k, 0.7% for AGIs $50k-75k, 1.3% for AGIs $75k-100k, 5.6% for AGIs over 100k)
Profit/loss from business: +$18,494 (reported on 16.5% of returns)
Here:
+$18,494
State:
+$17,837
(% of AGI for various income ranges: 2.2% for AGIs below $10k, 7.9% for AGIs $10k-25k, 4.9% for AGIs $25k-50k, 4.8% for AGIs $50k-75k, 4.3% for AGIs $75k-100k, 3.5% for AGIs over 100k)
IRA payment deduction: $3,235 (reported on 3.4% of returns)
02093:
$3,235
Massachusetts:
$3,100
(% of AGI for various income ranges: 0.3% for AGIs $10k-25k, 0.3% for AGIs $25k-50k, 0.2% for AGIs $50k-75k, 0.2% for AGIs $75k-100k, 0.1% for AGIs over 100k)
Self-employed pension: $12,901 (reported on 2.1% of returns)
Here:
$12,901
Massachusetts:
$14,516
(% of AGI for various income ranges: 0.3% for AGIs $50k-75k, 0.4% for AGIs $75k-100k, 0.4% for AGIs over 100k)
Total itemized deductions: $23,520 (20% of AGI, reported on 56.0% of returns)
Here:
$23,520
State:
$22,573
Here:
19.7% of AGI
State:
19.5% of AGI
(% of AGI for various income ranges: 18.6% for AGIs below $10k, 20.0% for AGIs $10k-25k, 17.1% for AGIs $25k-50k, 21.2% for AGIs $50k-75k, 21.9% for AGIs $75k-100k, 15.6% for AGIs over 100k)
Charity contributions deductions: $2,462 (2% of AGI, reported on 52.8% of returns)
Here:
$2,462
State:
$3,295
Here:
2.0% of AGI
State:
2.7% of AGI
(% of AGI for various income ranges: 0.8% for AGIs below $10k, 1.4% for AGIs $10k-25k, 1.5% for AGIs $25k-50k, 1.9% for AGIs $50k-75k, 1.9% for AGIs $75k-100k, 1.7% for AGIs over 100k)
Total tax: $13,511 (reported on 83.0% of returns)
02093:
$13,511
State:
$11,494
(% of AGI for various income ranges: 3.3% for AGIs below $10k, 5.4% for AGIs $10k-25k, 8.1% for AGIs $25k-50k, 8.9% for AGIs $50k-75k, 9.5% for AGIs $75k-100k, 18.3% for AGIs over 100k)
Earned income credit: $1,319 (reported on 4.2% of returns)
Here:
$1,319
State:
$1,518
Percentage of individuals using paid preparers for their 2004 taxes: 57.9%
Here:
58%
State:
58%
(% for various income ranges: 44.2% for AGIs below $10k, 55.9% for AGIs $10k-25k, 59.1% for AGIs $25k-50k, 64.7% for AGIs $50k-75k, 63.5% for AGIs $75k-100k, 62.4% for AGIs over 100k)
Likely homosexual households (counted as self-reported same-sex unmarried-partner households)
Lesbian couples: 0.1% of all households
Gay men: 0.0% of all households
Household received Food Stamps/SNAP in the past 12 months: 257 Household did not receive Food Stamps/SNAP in the past 12 months: 4,188
Women who had a birth in the past 12 months: 158 (109 now married, 47 unmarried) Women who did not have a birth in the past 12 months: 2,152 (911 now married, 1,233 unmarried)
Housing units in zip code 02093 with a mortgage: 2,632 (552 second mortgage, 546 both second mortgage and home equity loan) Houses without a mortgage: 163
Median monthly owner costs for units with a mortgage: $2,856 Median monthly owner costs for units without a mortgage: $1,033
Residents with income below the poverty level in 2022:
This zip code:
4.0%
Whole state:
10.4%
Residents with income below 50% of the poverty level in 2022:
This zip code:
1.4%
Whole state:
5.1%
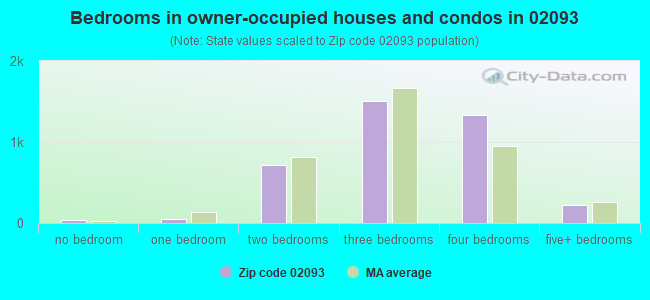
Median number of rooms in houses and condos:
Here:
7.6
State:
6.5
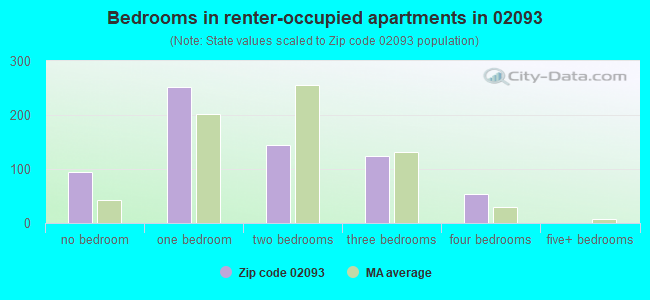
Median number of rooms in apartments:
Here:
3.3
State:
4.0
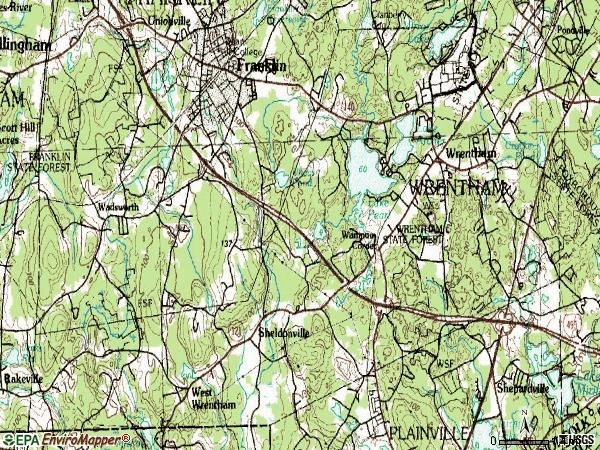
Notable locations in this zip code not listed on our city pages
Notable locations in zip code 02093: Wrentham Fire Department Station 2 (A), Wrentham Fire Department Station 1 Headquarters (B), Fiske Public Library (C). Display/hide their locations on the map
Churches in zip code 02093 include: Trinity Episcopal Church (A), Sheldonville Baptist Church (B), Original Congregational Church (C), The Church of Jesus Christ of Latter Day Saints (D), Mount Saint Marys Abbey (E). Display/hide their locations on the map
Lakes, reservoirs, and swamps: Lake Archer (A), Crocker Pond (B), Mirror Lake (C), Trout Pond (D), Lake Pearl (E), Stony Brook Pond (F), Hawes Pond (G), Hales Pond (H). Display/hide their locations on the map
1,822 married couples with children.
347 single-parent households (116 men, 231 women).
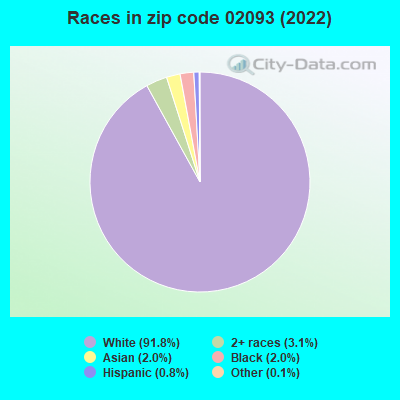
95.1% of residents of 02093 zip code speak English at home.
0.8% of residents speak Spanish at home (100% very well).
2.4% of residents speak other Indo-European language at home (87% very well, 9% well, 5% not well).
1.0% of residents speak Asian or Pacific Island language at home (52% very well, 15% well, 28% not well, 5% not at all).
0.1% of residents speak other language at home (100% very well).
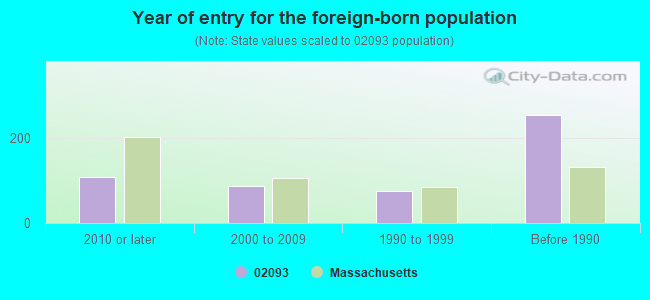
Foreign born population: 437 (3.6%) (76.8% of them are naturalized citizens)
This zip code:
3.6%
Whole state:
18.0%
14%Bhutan
8%Grenada
6%Georgia
6%Singapore
5%North Macedonia (Macedonia)
5%Greece
5%Algeria
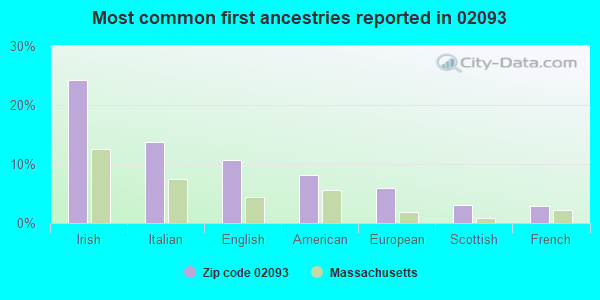
24%Irish
14%Italian
11%English
8%American
6%European
3%Scottish
3%French
Year of entry for the foreign-born population
1082010 or later
872000 to 2009
761990 to 1999
255Before 1990
Major facilities with environmental interests located in this zip code:
EQ NORTHEAST INC (185 INDUSTRIAL ROAD in WRENTHAM, MA)
STATE MASTER (New Jersey environmental info) - NJEMS-201629, REFUSE DISPOSAL, NJEMS-MAD084814136, TRANSPORTER HAZARDOUS WASTE BIENNIAL REPORTER (Resource Conservation and Recovery Act (tracking hazardous waste)) - ICIS-, ENFORCEMENT/COMPLIANCE ACTIVITY Large Quantity Generators, more that 1000 kg of hazardous waste/month (Resource Conservation and Recovery Act (tracking hazardous waste)) - ICIS-, ENFORCEMENT/COMPLIANCE ACTIVITY TRANSPORTER (Resource Conservation and Recovery Act (tracking hazardous waste)) - ICIS-, ENFORCEMENT/COMPLIANCE ACTIVITY USED OIL PROGRAM (Resource Conservation and Recovery Act (tracking hazardous waste)) - ICIS-, ENFORCEMENT/COMPLIANCE ACTIVITY (Resource Conservation and Recovery Act (tracking hazardous waste)) Business NAICS classification: ALL OTHER SUPPORT ACTIVITIES FOR TRANSPORTATION. Organizations: FRANKLIN ENVIRONMENTAL SERVICE, FRANKLIN ENVIRONMENTAL SERVICES (CONTACT/OWNER)
Alternative names: FRANKLIN ENVIRONMENTAL SERVICE
WRENTHAM DEVELOPMENTAL CENTER (EMERALD STREET in WRENTHAM, MA)
AIR SYNTHETIC MINOR (AIRS/AFS) CRITERIA AND HAZARDOUS AIR POLLUTANT INVENTORY (Inventory of air pollution sources) National Pollutant Discharge Elimination System NON-MAJOR (Tracking pollutant discharge elimination systems) - permit Small Quantity Generators, between 100 kg and 1000 kg of hazardous waste/month (Resource Conservation and Recovery Act (tracking hazardous waste)) - notification (Resource Conservation and Recovery Act (tracking hazardous waste)) COMMUNITY WATER SYSTEM (SDWIS) Business SIC classification: ELEMENTARY AND SECONDARY SCHOOLS Organizations: WRENTHAM DEVELOPMENT CENTER (CONTACT/OPERATOR)
, COMMONWEALTH OF MASS (CONTACT/OWNER)
, WRENTAHM DEVELOPMENTAL CENTER (CONTACT/OWNER)
Alternative names: MA WRENTHAM DEVELOPM, WRENTHAM STATE SCHOOL
WRENTHAM DPW MAINTENANCE FACILITY (360 TAUNTON ST in WRENTHAM, MA)
ENFORCEMENT/COMPLIANCE ACTIVITY (Integrated Compliance Information System) - ICIS-01-2004-9074, FORMAL ENFORCEMENT ACTION (Integrated Compliance Information System) - ICIS-01-2004-9074, FORMAL ENFORCEMENT ACTION
AGGREGATE INDUSTRIES NORTHEAST REGION (400 GREEN ST. in WRENTHAM, MA)
AIR SYNTHETIC MINOR (AIRS/AFS) CRITERIA AND HAZARDOUS AIR POLLUTANT INVENTORY (Inventory of air pollution sources) Conditionally Exempt Small Quantity Generators, less than 100 kg/month of hazardous waste (Resource Conservation and Recovery Act (tracking hazardous waste)) - notification (Resource Conservation and Recovery Act (tracking hazardous waste)) TRI REPORTER (Tracking of toxic chemicals releasing facilities) Business SIC classification: CRUSHED AND BROKEN STONE; ASPHALT PAVING MIXTURES AND BLOCKS Business NAICS classification: ASPHALT PAVING MIXTURE AND BLOCK MANUFACTURING. Organizations: SIMEONE CORP (CONTACT/OWNER)
Alternative names: AGGREGATE INDS. NORTHEAST REGION INC., BARDON TRIMOUNT INCORPORATED, SIMEONE CORP
CAPSTAN ATLANTIC (10 CUSHING DR. in WRENTHAM, MA)
AIR MINOR (AIRS/AFS) CRITERIA AND HAZARDOUS AIR POLLUTANT INVENTORY (Inventory of air pollution sources) (Resource Conservation and Recovery Act (tracking hazardous waste)) TRI REPORTER (Tracking of toxic chemicals releasing facilities) Business SIC classification: FABRICATED METAL PRODUCTS Organizations: ATLANTIC SINTERED METALS INC (CONTACT/OWNER)
WRENTHAM STEEL PRODUCTS (30 KENDRICK ST in WRENTHAM, MA)
AIR MINOR (AIRS/AFS) CRITERIA AND HAZARDOUS AIR POLLUTANT INVENTORY (Inventory of air pollution sources) (Resource Conservation and Recovery Act (tracking hazardous waste)) Business SIC classification: MACHINE TOOLS, METAL FORMING TYPES Business NAICS classification: MACHINE TOOL (METAL FORMING TYPES) MANUFACTURING. Organizations: WRENTHAM STEEL PRODUCTS CO CORP (CONTACT/OWNER)
KING PHILIP REGIONAL HIGH SCHOOL (201 FRANKLIN ST in WRENTHAM, MA)
AIR MINOR (AIRS/AFS) CRITERIA AND HAZARDOUS AIR POLLUTANT INVENTORY (Inventory of air pollution sources) Conditionally Exempt Small Quantity Generators, less than 100 kg/month of hazardous waste (Resource Conservation and Recovery Act (tracking hazardous waste)) - notification Business SIC classification: ELEMENTARY AND SECONDARY SCHOOLS Organizations: KING PHILLIP REGIONAL SCHOOL DISTRICT (CONTACT/OWNER)
Alternative names: KING PHILIP REG HIGH, KING PHILIP REG.SCH., KING PHILLIP REGIONAL HIGH SCHOOL
MORROCCO BROTHERS INC (600 WASHINGTON ST in WRENTHAM, MA)
(Resource Conservation and Recovery Act (tracking hazardous waste)) Organizations: THOMAS MORROCCO (CONTACT/OWNER)
NEW ENGLAND AUTOMOTIVE (715 EAST ST in WRENTHAM, MA)
(Resource Conservation and Recovery Act (tracking hazardous waste))
BELLA CONSTRUCTION CORP (INDUSTRIAL RD in WRENTHAM, MA)
METALOY INC (WASHINGTON ST U S RTE 1 in WRENTHAM, MA)
(Resource Conservation and Recovery Act (tracking hazardous waste)) TRI REPORTER (Tracking of toxic chemicals releasing facilities) Business SIC classification: STEEL WIREDRAWING AND STEEL NAILS AND SPIKES
MINUTE MAN TRANSIT INC (205 INDUSTRIAL RD in WRENTHAM, MA)
(Resource Conservation and Recovery Act (tracking hazardous waste))
NEW ENGLAND TELE CO (SOUTH ST in WRENTHAM, MA)
(Resource Conservation and Recovery Act (tracking hazardous waste))
Housing units lacking complete kitchen facilities: 2.4%
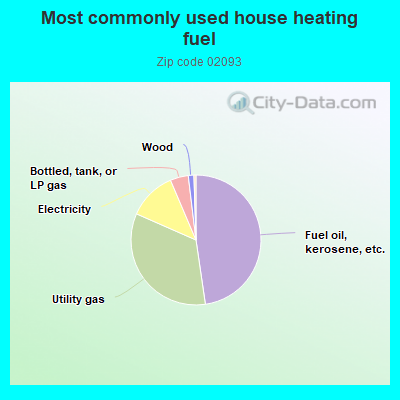
47.7%Fuel oil, kerosene, etc.
33.9%Utility gas
12.0%Electricity
4.5%Bottled, tank, or LP gas
1.4%Wood
Population in 1990: 9,006. Population change in the 1990s: +1,548 (+17.2%).
Place of birth for U.S.-born residents:
This state: 8,004
Northeast: 2,388
Midwest: 453
South: 404
West: 331
66% of the 02093 zip code residents lived in the same house 5 years ago. Out of people who lived in different houses, 62% lived in this county. Out of people who lived in different counties, 50% lived in Massachusetts.
94% of the 02093 zip code residents lived in the same house 1 year ago. Out of people who lived in different houses, 38% moved from this county. Out of people who lived in different houses, 48% moved from different county within same state. Out of people who lived in different houses, 8% moved from different state. Out of people who lived in different houses, 8% moved from abroad.
Private vs. public school enrollment:
Students in private schools in grades 1 to 8 (elementary and middle school): 61
Here:
6.2%
Massachusetts:
10.3%
Students in private schools in grades 9 to 12 (high school): 232
Here:
30.9%
Massachusetts:
12.3%
Students in private undergraduate colleges: 239
Here:
53.4%
Massachusetts:
51.2%
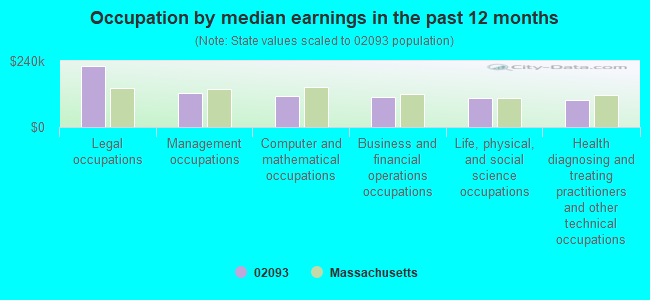
Occupation by median earnings in the past 12 months ($)
220,515Legal occupations
123,740Management occupations
111,839Computer and mathematical occupations
108,044Business and financial operations occupations
103,757Life, physical, and social science occupations
98,620Health diagnosing and treating practitioners and other technical occupations
Companies with federal contracts located in this zip code:
ANDERSON GREENWOOD CROSBY (43 KENDRICK ST in WRENTHAM, MA) : $7,109,418 in 200 contractsfrom 2000 to 2006
Contracts for Valves, Nonpowered, Hose, Pipe, Tube, Lubrication, and Railing Fittings, Valves, Powered, Coil, Flat, Leaf, and Wire Springs, and moreby Navy, Defense Logistics Agency, Tennessee Valley Authority, Federal Supply Service, and others Signed by year:2000: $306,325; 2001: $210,830; 2002: $1,466,234; 2003: $1,446,821; 2004: $2,383,272; 2005: $997,476; 2006: $298,460.
Biggest contracts:
$309,366 with Navy for Valves, Nonpowered. Signed on 2004-12-01. Completion date: 2005-09-07.
$308,210, same as above.Signed on 2004-12-01. Completion date: 2005-09-07.
$284,700, same as above.Signed on 2003-12-29. Completion date: 2004-07-28.
$225,564, same as above.Signed on 2004-01-06. Completion date: 2004-08-19.
DEANA ARCHAMBAULT (75 FARM HILL ROAD in WRENTHAM, MA; small business) : $8,629 in 2 contractsin 2003
$7,614 with Army for Other Professional Services. Signed on 2003-05-19. Completion date: 2004-05-19.
$1,015, same as above.Signed on 2003-12-18. Completion date: 2004-05-19.
Top industries in this zip code by the number of employees in 2005:
Detailed PMIC statistics for the following Tracts:4412.01
, 4412.02
2002 - 2018 National Fire Incident Reporting System (NFIRS) incidents
According to the data from the years 2002 - 2018 the average number of fires per year is 71. The highest number of reported fires - 164 took place in 2005, and the least - 18 in 2014. The data has a decreasing trend.
When looking into fire subcategories, the most incidents belonged to: Other (50.1%), and Structure Fires (21.0%).
Fire incident types reported to NFIRS in Zip Code 02093


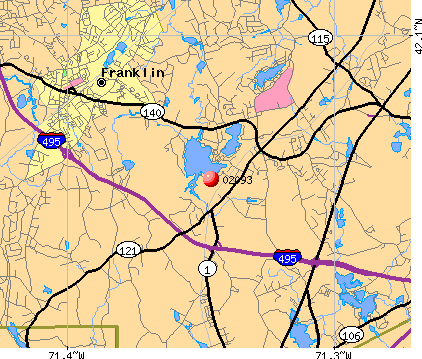 Nearest zip codes: 02762, 02038, 02056, 02760, 02071, 02763.
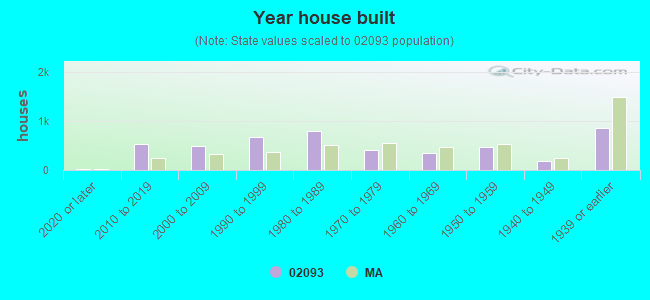


 According to the data from the years 2002 - 2018 the average number of fires per year is 71. The highest number of reported fires - 164 took place in 2005, and the least - 18 in 2014. The data has a decreasing trend.
 When looking into fire subcategories, the most incidents belonged to: Other (50.1%), and Structure Fires (21.0%).