Estimated zip code population in 2022: 27,829 Zip code population in 2010: 28,441 Zip code population in 2000: 25,486
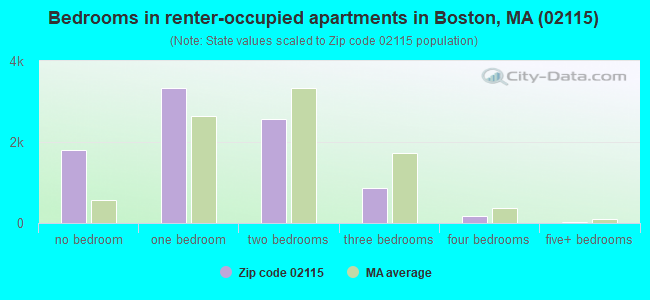
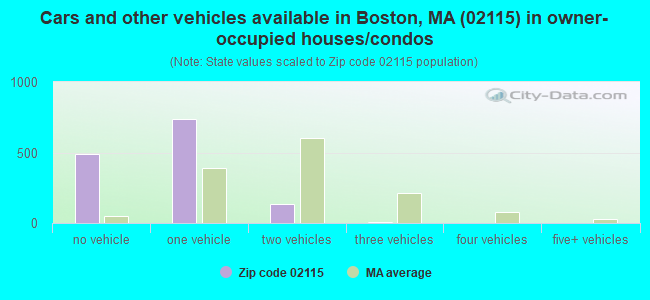
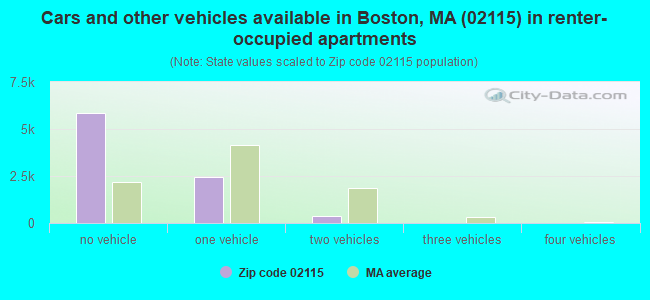
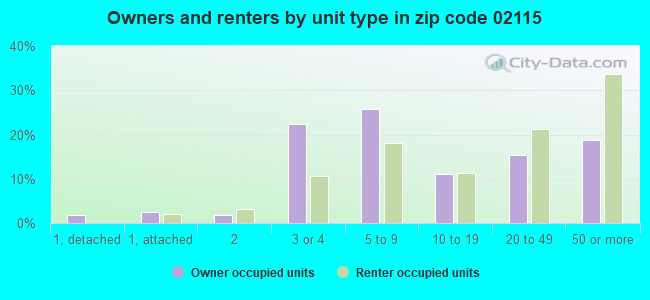
Houses and condos: 11,421 Renter-occupied apartments: 8,749
% of renters here:
87%
State:
38%
March 2022 cost of living index in zip code 02115: 156.6 (very high, U.S. average is 100)
Land area: 0.7 sq. mi. Water area: 0.0 sq. mi.
Population density: 39,295 people per square mile
(very high).
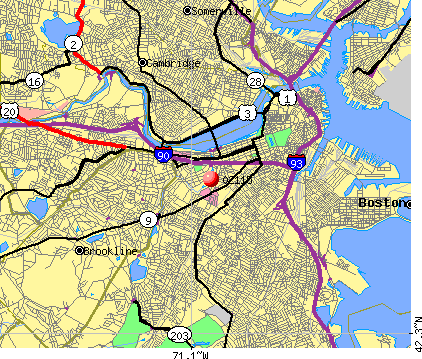
OSM Map
Google Map
MSN Map
OSM Map
General Map
Google Map
MSN Map
OSM Map
Google Map
MSN Map
OSM Map
Google Map
MSN Map
Please wait while loading the map...
Real estate property taxes paid for housing units in 2022:
This zip code:
0.7% ($7,435)
Massachusetts:
1.0% ($5,536)
Median real estate property taxes paid for housing units with mortgages in 2022: $6,989 (0.5%) Median real estate property taxes paid for housing units with no mortgage in 2022: $7,932 (0.9%)
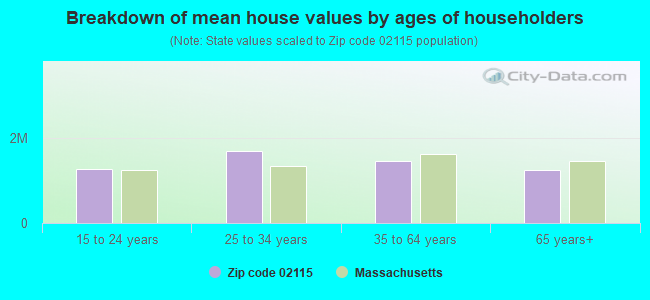
Estimated median house/condo value in 2022: $1,104,980
02115:
$1,104,980
Massachusetts:
$534,700
According to our research of Massachusetts and other state lists, there were 9 registered sex offenders living in 02115 zip code as of April 27, 2024. The ratio of all residents to sex offenders in zip code 02115 is 3,266 to 1. The ratio of registered sex offenders to all residents in this zip code is lower than the state average.
Median resident age:
This zip code:
22.4 years
Massachusetts median age:
40.3 years
Average household size:
This zip code:
1.6 people
Massachusetts:
2.4 people
Averages for the 2020 tax year for zip code 02115, filed in 2021:
Average Adjusted Gross Income (AGI) in 2020: $169,165 (Individual Income Tax Returns)
Here:
$169,165
State:
$105,130
Salary/wage: $109,167 (reported on 86.7% of returns)
Here:
$109,167
State:
$82,951
(% of AGI for various income ranges: 1200.5% for AGIs below $25k, 3828.2% for AGIs $25k-50k, 7386.0% for AGIs $50k-75k, 11429.5% for AGIs $75k-100k, 22178.8% for AGIs $100k-200k, 224808.9% for AGIs over 200k)
Taxable interest for individuals: $5,691 (reported on 34.5% of returns)
This zip code:
$5,691
Massachusetts:
$2,361
(% of AGI for various income ranges: 9.1% for AGIs below $25k, 15.4% for AGIs $25k-50k, 42.2% for AGIs $50k-75k, 77.2% for AGIs $75k-100k, 224.8% for AGIs $100k-200k, 6575.6% for AGIs over 200k)
Ordinary dividends: $23,889 (reported on 29.9% of returns)
Here:
$23,889
State:
$10,365
(% of AGI for various income ranges: 42.3% for AGIs below $25k, 38.5% for AGIs $25k-50k, 107.2% for AGIs $50k-75k, 208.0% for AGIs $75k-100k, 798.1% for AGIs $100k-200k, 24363.3% for AGIs over 200k)
Net capital gain/loss in AGI: +$115,684 (reported on 29.2% of returns)
Here:
+$115,684
State:
+$48,178
(% of AGI for various income ranges: 28.7% for AGIs below $25k, 48.9% for AGIs $25k-50k, 109.0% for AGIs $50k-75k, 333.8% for AGIs $75k-100k, 1039.0% for AGIs $100k-200k, 126936.7% for AGIs over 200k)
Profit/loss from business: +$30,691 (reported on 13.3% of returns)
Here:
+$30,691
State:
+$20,792
(% of AGI for various income ranges: 64.7% for AGIs below $25k, 152.2% for AGIs $25k-50k, 242.8% for AGIs $50k-75k, 149.2% for AGIs $75k-100k, 930.7% for AGIs $100k-200k, 10825.6% for AGIs over 200k)
Taxable individual retirement arrangement distribution: $32,148 (reported on 4.7% of returns)
02115:
$32,148
Massachusetts:
$22,790
(% of AGI for various income ranges: 20.9% for AGIs below $25k, 30.3% for AGIs $25k-50k, 91.8% for AGIs $50k-75k, 202.2% for AGIs $75k-100k, 546.2% for AGIs $100k-200k, 3422.2% for AGIs over 200k)
Self-employed (Keogh) retirement plans: $37,800 (reported on 1.4% of returns)
02115:
$37,800
Massachusetts:
$26,868
(% of AGI for various income ranges: 73.1% for AGIs $50k-75k, 1807.8% for AGIs over 200k)
Total itemized deductions: $59,109 (reported on 9.9% of returns)
Here:
$59,109
State:
$36,722
(% of AGI for various income ranges: 31.3% for AGIs below $25k, 60.3% for AGIs $25k-50k, 104.7% for AGIs $50k-75k, 344.5% for AGIs $75k-100k, 774.0% for AGIs $100k-200k, 19001.1% for AGIs over 200k)
Charity contributions: $34,354 (reported on 8.0% of returns)
Here:
$34,354
State:
$12,529
(% of AGI for various income ranges: 5.4% for AGIs $25k-50k, 3.2% for AGIs $50k-75k, 27.5% for AGIs $75k-100k, 165.2% for AGIs $100k-200k, 10193.3% for AGIs over 200k)
Taxes paid: $8,975 (reported on 9.9% of returns)
02115:
$8,975
State:
$8,782
(% of AGI for various income ranges: 6.5% for AGIs below $25k, 13.8% for AGIs $25k-50k, 35.6% for AGIs $50k-75k, 78.5% for AGIs $75k-100k, 268.8% for AGIs $100k-200k, 2349.4% for AGIs over 200k)
Earned income credit: $1,852 (reported on 10.7% of returns)
Here:
$1,852
State:
$1,909
(% of AGI for various income ranges: 52.4% for AGIs below $25k, 47.9% for AGIs $25k-50k)
Percentage of individuals using paid preparers for their 2020 taxes: 92.8%
Here:
93%
State:
92%
(% for various income ranges: 91.6% for AGIs below $25k, 90.4% for AGIs $25k-50k, 95.0% for AGIs $50k-75k, 95.2% for AGIs $75k-100k, 94.1% for AGIs $100k-200k, 95.0% for AGIs over 200k)
Averages for the 2012 tax year for zip code 02115, filed in 2013:
Average Adjusted Gross Income (AGI) in 2012: $112,016 (Individual Income Tax Returns)
Here:
$112,016
State:
$81,425
Salary/wage: $71,611 (reported on 89.9% of returns)
Here:
$71,611
State:
$64,752
(% of AGI for various income ranges: 85.4% for AGIs below $25k, 89.7% for AGIs $25k-50k, 89.9% for AGIs $50k-75k, 85.8% for AGIs $75k-100k, 84.6% for AGIs $100k-200k, 38.6% for AGIs over 200k)
Taxable interest for individuals: $3,268 (reported on 36.2% of returns)
This zip code:
$3,268
Massachusetts:
$2,136
(% of AGI for various income ranges: 0.8% for AGIs below $25k, 0.3% for AGIs $25k-50k, 0.4% for AGIs $50k-75k, 0.5% for AGIs $75k-100k, 0.8% for AGIs $100k-200k, 1.4% for AGIs over 200k)
Ordinary dividends: $20,941 (reported on 26.4% of returns)
Here:
$20,941
State:
$9,473
(% of AGI for various income ranges: 2.2% for AGIs below $25k, 1.5% for AGIs $25k-50k, 1.5% for AGIs $50k-75k, 1.7% for AGIs $75k-100k, 2.2% for AGIs $100k-200k, 6.9% for AGIs over 200k)
Net capital gain/loss in AGI: +$112,426 (reported on 22.3% of returns)
Here:
+$112,426
State:
+$31,437
(% of AGI for various income ranges: 0.3% for AGIs below $25k, 0.6% for AGIs $25k-50k, 0.6% for AGIs $50k-75k, 0.6% for AGIs $75k-100k, 2.0% for AGIs $100k-200k, 36.0% for AGIs over 200k)
Profit/loss from business: +$26,057 (reported on 12.4% of returns)
Here:
+$26,057
State:
+$20,662
(% of AGI for various income ranges: 6.2% for AGIs below $25k, 2.7% for AGIs $25k-50k, 2.3% for AGIs $50k-75k, 4.3% for AGIs $75k-100k, 4.2% for AGIs $100k-200k, 2.4% for AGIs over 200k)
Taxable individual retirement arrangement distribution: $27,216 (reported on 5.2% of returns)
02115:
$27,216
Massachusetts:
$18,892
(% of AGI for various income ranges: 1.1% for AGIs below $25k, 0.7% for AGIs $25k-50k, 1.4% for AGIs $50k-75k, 1.9% for AGIs $75k-100k, 1.4% for AGIs $100k-200k, 1.2% for AGIs over 200k)
Self-employment retirement plans: $27,330 (reported on 1.4% of returns)
02115:
$27,330
Massachusetts:
$20,669
(% of AGI for various income ranges: 0.4% for AGIs $25k-50k, 0.5% for AGIs $100k-200k, 0.4% for AGIs over 200k)
Total itemized deductions: $46,469 (14% of AGI, reported on 24.7% of returns)
Here:
$46,469
State:
$28,907
Here:
13.6% of AGI
State:
18.2% of AGI
(% of AGI for various income ranges: 4.6% for AGIs below $25k, 3.9% for AGIs $25k-50k, 5.6% for AGIs $50k-75k, 8.9% for AGIs $75k-100k, 11.5% for AGIs $100k-200k, 11.9% for AGIs over 200k)
Charity contributions: $11,760 (reported on 19.7% of returns)
Here:
$11,760
State:
$4,208
(% of AGI for various income ranges: 0.3% for AGIs below $25k, 0.4% for AGIs $25k-50k, 0.6% for AGIs $50k-75k, 1.0% for AGIs $75k-100k, 1.1% for AGIs $100k-200k, 2.9% for AGIs over 200k)
Taxes paid: $23,938 (reported on 24.7% of returns)
02115:
$23,938
State:
$13,303
(% of AGI for various income ranges: 1.2% for AGIs below $25k, 1.1% for AGIs $25k-50k, 1.9% for AGIs $50k-75k, 3.4% for AGIs $75k-100k, 5.8% for AGIs $100k-200k, 6.6% for AGIs over 200k)
Earned income credit: $1,712 (reported on 12.2% of returns)
Here:
$1,712
State:
$1,971
(% of AGI for various income ranges: 4.1% for AGIs below $25k, 0.4% for AGIs $25k-50k)
Percentage of individuals using paid preparers for their 2012 taxes: 43.3%
Here:
43%
State:
56%
(% for various income ranges: 39.5% for AGIs below $25k, 38.5% for AGIs $25k-50k, 40.9% for AGIs $50k-75k, 39.3% for AGIs $75k-100k, 50.0% for AGIs $100k-200k, 75.0% for AGIs over 200k)
Averages for the 2004 tax year for zip code 02115, filed in 2005:
Average Adjusted Gross Income (AGI) in 2004: $76,244 (Individual Income Tax Returns)
Here:
$76,244
State:
$62,877
Salary/wage: $53,034 (reported on 89.8% of returns)
Here:
$53,034
State:
$52,969
(% of AGI for various income ranges: 137.8% for AGIs below $10k, 88.8% for AGIs $10k-25k, 92.2% for AGIs $25k-50k, 88.0% for AGIs $50k-75k, 87.5% for AGIs $75k-100k, 47.9% for AGIs over 100k)
Taxable interest for individuals: $3,286 (reported on 41.3% of returns)
This zip code:
$3,286
Massachusetts:
$1,945
(% of AGI for various income ranges: 3.5% for AGIs below $10k, 1.1% for AGIs $10k-25k, 0.9% for AGIs $25k-50k, 1.2% for AGIs $50k-75k, 0.9% for AGIs $75k-100k, 2.2% for AGIs over 100k)
Taxable dividends: $6,168 (reported on 26.2% of returns)
Here:
$6,168
State:
$5,323
(% of AGI for various income ranges: 4.9% for AGIs below $10k, 0.9% for AGIs $10k-25k, 0.8% for AGIs $25k-50k, 1.3% for AGIs $50k-75k, 1.3% for AGIs $75k-100k, 2.6% for AGIs over 100k)
Net capital gain/loss: +$39,501 (reported on 22.4% of returns)
Here:
+$39,501
State:
+$20,377
(% of AGI for various income ranges: -1.1% for AGIs below $10k, 0.3% for AGIs $10k-25k, 0.9% for AGIs $25k-50k, 1.4% for AGIs $50k-75k, 1.7% for AGIs $75k-100k, 17.0% for AGIs over 100k)
Profit/loss from business: +$23,354 (reported on 10.5% of returns)
Here:
+$23,354
State:
+$17,837
(% of AGI for various income ranges: -13.7% for AGIs below $10k, 2.9% for AGIs $10k-25k, 2.4% for AGIs $25k-50k, 3.6% for AGIs $50k-75k, 3.9% for AGIs $75k-100k, 3.5% for AGIs over 100k)
IRA payment deduction: $2,761 (reported on 2.3% of returns)
02115:
$2,761
Massachusetts:
$3,100
(% of AGI for various income ranges: 0.3% for AGIs $10k-25k, 0.2% for AGIs $25k-50k, 0.1% for AGIs $50k-75k, 0.1% for AGIs $75k-100k, 0.0% for AGIs over 100k)
Self-employed pension: $18,677 (reported on 1.5% of returns)
Here:
$18,677
Massachusetts:
$14,516
(% of AGI for various income ranges: 0.1% for AGIs $25k-50k, 0.4% for AGIs $50k-75k, 0.4% for AGIs $75k-100k, 0.5% for AGIs over 100k)
Total itemized deductions: $25,395 (12% of AGI, reported on 26.7% of returns)
Here:
$25,395
State:
$22,573
Here:
12.3% of AGI
State:
19.5% of AGI
(% of AGI for various income ranges: 17.9% for AGIs below $10k, 4.8% for AGIs $10k-25k, 5.2% for AGIs $25k-50k, 8.8% for AGIs $50k-75k, 10.8% for AGIs $75k-100k, 9.6% for AGIs over 100k)
Charity contributions deductions: $5,926 (2% of AGI, reported on 20.2% of returns)
Here:
$5,926
State:
$3,295
Here:
2.3% of AGI
State:
2.7% of AGI
(% of AGI for various income ranges: 0.5% for AGIs below $10k, 0.5% for AGIs $10k-25k, 0.6% for AGIs $25k-50k, 1.0% for AGIs $50k-75k, 1.1% for AGIs $75k-100k, 2.0% for AGIs over 100k)
Total tax: $17,897 (reported on 77.8% of returns)
02115:
$17,897
State:
$11,494
(% of AGI for various income ranges: 3.5% for AGIs below $10k, 4.8% for AGIs $10k-25k, 9.8% for AGIs $25k-50k, 14.1% for AGIs $50k-75k, 16.2% for AGIs $75k-100k, 21.9% for AGIs over 100k)
Earned income credit: $1,299 (reported on 10.1% of returns)
Here:
$1,299
State:
$1,518
Percentage of individuals using paid preparers for their 2004 taxes: 42.0%
Here:
42%
State:
58%
(% for various income ranges: 31.5% for AGIs below $10k, 40.9% for AGIs $10k-25k, 39.5% for AGIs $25k-50k, 44.7% for AGIs $50k-75k, 45.1% for AGIs $75k-100k, 64.0% for AGIs over 100k)
Likely homosexual households (counted as self-reported same-sex unmarried-partner households)
Lesbian couples: 0.0% of all households
Gay men: 0.2% of all households
Household received Food Stamps/SNAP in the past 12 months: 1,940 Household did not receive Food Stamps/SNAP in the past 12 months: 8,181
Women who had a birth in the past 12 months: 94 (23 now married, 62 unmarried) Women who did not have a birth in the past 12 months: 11,719 (683 now married, 11,261 unmarried)
Housing units in zip code 02115 with a mortgage: 582 (71 second mortgage, 72 both second mortgage and home equity loan) Houses without a mortgage: 19
Median monthly owner costs for units with a mortgage: $3,538 Median monthly owner costs for units without a mortgage: $1,030
Residents with income below the poverty level in 2022:
This zip code:
35.8%
Whole state:
10.4%
Residents with income below 50% of the poverty level in 2022:
This zip code:
14.5%
Whole state:
5.1%
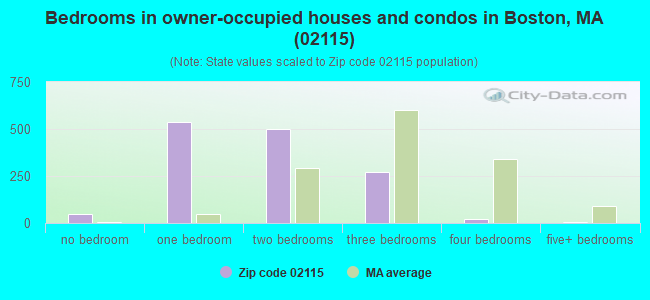
Median number of rooms in houses and condos:
Here:
3.8
State:
6.5
Median number of rooms in apartments:
Here:
3.2
State:
4.0
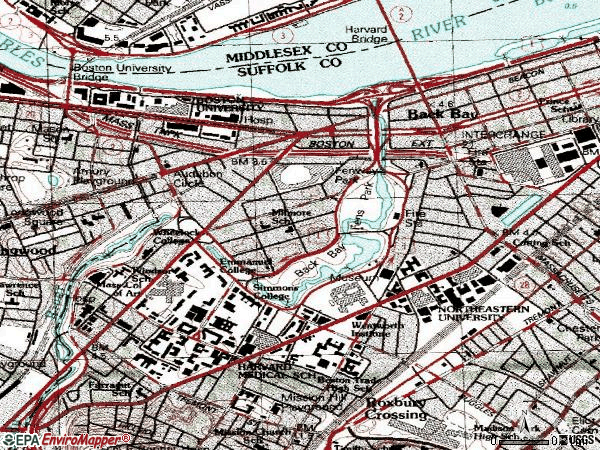
Notable locations in this zip code not listed on our city pages
Notable locations in zip code 02115: Ames Mansion Museum (A), Ansin Wing (B), Bader Building (C), Baker Building (D), Beatley Library (E), Berklee Performance Center (F), Beth Israel Research East Building (G), Boston Conservatory of Music (H), Boston University Theater (I), Brookline Avenue Medical Building (J), Building 7 (K), Burage Mansion Museum (L), Carnegie Building (M), Collins Alumni Building (N), Collins Building (O), Dana Wing (P), Danielson Institute (Q), Dreyfus Building (R), East Building (S), East Quad (T). Display/hide their locations on the map
Churches in zip code 02115 include: The Annunciation Greek Orthodox Cathedral of New England (A), Saint Cecelias Church (B), Kingdom Hall of Jehovahs Witnesses (C), First Church of Christ Scientist (D), Greek Orthodox Cathedral of New England (E). Display/hide their locations on the map
Tourist attractions (not listed on the city page) : Fenway Libraries On Line Inc (Cultural Attractions- Events- & Facilities; 550 Huntington Avenue), Museum of Fine Arts Boston - Product Sales & Marketing Adm OFCS (Cultural Attractions- Events- & Facilities; 295 Huntington Avenue), Museum of Fine Arts Boston (Cultural Attractions- Events- & Facilities; 465 Huntington Avenue), Concourse Ticket Agency (Amusement & Theme Parks; 40 Dalton Street).
364 married couples with children.
979 single-parent households (31 men, 948 women).
63.2% of residents of 02115 zip code speak English at home.
10.1% of residents speak Spanish at home (67% very well, 19% well, 7% not well, 7% not at all).
11.1% of residents speak other Indo-European language at home (79% very well, 10% well, 9% not well, 2% not at all).
13.4% of residents speak Asian or Pacific Island language at home (59% very well, 16% well, 18% not well, 8% not at all).
1.9% of residents speak other language at home (74% very well, 19% well, 5% not well, 2% not at all).
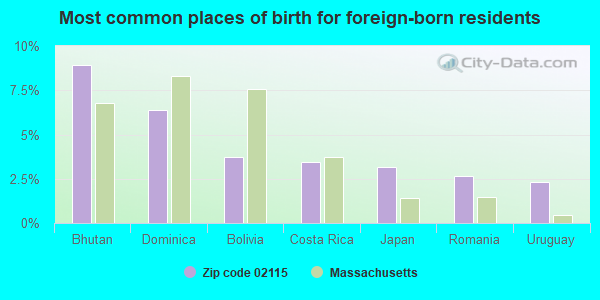
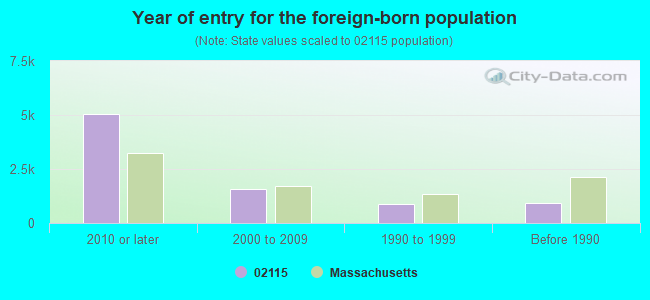
Foreign born population: 7,402 (26.6%) (38.7% of them are naturalized citizens)
Major facilities with environmental interests located in this zip code:
MERCK & CO INC (33 AVENUE LOUIS PASTEUR in BOSTON, MA)
AIR SYNTHETIC MINOR (AIRS/AFS) STATE MASTER (MA-EPICS) - RCRAINFO-MAR000513044, HAZARDOUS WASTE PROGRAM STATE MASTER (MA-EPICS) - NEI-1191826, AIR PROGRAM, CRITERIA AND HAZARDOUS AIR POLLUTANT INVENTORY CRITERIA AND HAZARDOUS AIR POLLUTANT INVENTORY (Inventory of air pollution sources) National Pollutant Discharge Elimination System NON-MAJOR (Tracking pollutant discharge elimination systems) - permit Large Quantity Generators, more that 1000 kg of hazardous waste/month (Resource Conservation and Recovery Act (tracking hazardous waste)) Business SIC classification: NONCLASSIFIABLE ESTABLISHMENTS Organizations: MEREK & CO (CONTACT/OPERATOR)
, MORETRENCH AMERICAN CORP. (CONTACT/OPERATOR)
, EMMANUEL COLLEGE (CONTACT/OWNER)
, MERCK AND CO., INC. (CONTACT/OWNER)
, MEREK & CO (CONTACT/OWNER)
Alternative names: MERCK BOSTON RESEARCH CENTER, MERCK BOSTON RESEARCH FACILITY, MERCK RESEARCH LABORATORIES, MERCK RESEARCH LABORATORIES BOSTON, MEREK & CO
LONGWOOD MASSACHUSETTS MENTAL HEALTH (74 FENWOOD ROAD in BOSTON, MA)
AIR MINOR (AIRS/AFS) STATE MASTER (MA-EPICS) - NEI-1190046, AIR PROGRAM, RCRAINFO-MAD075369918, HAZARDOUS WASTE PROGRAM, RCRAINFO-MV6176269300, STATE MASTER (MA-EPICS) - RCRAINFO-MV6177329090, HAZARDOUS WASTE PROGRAM (Resource Conservation and Recovery Act (tracking hazardous waste)) Business SIC classification: PSYCHIATRIC HOSPITALS Organizations: MA DEPARTMENT OF MENTAL HEALTH (CONTACT/OPERATOR)
, MA MENTAL HEALTH RESEARCH (CONTACT/REGULATORY)
, MA DEPARTMENT OF MENTAL HEALTH (CONTACT/REGULATORY)
Alternative names: HARVARD UNIVERSITY, MA DEPART OF MENTAL, MA DEPARTMENT OF MENTAL HEALTH, MA MENTAL HEALTH CENTER, MA MENTAL HEALTH RESEARCH, MASS MENTAL HEALTH C
EMMANUEL COLLEGE (400 THE FENWAY in BOSTON, MA)
AIR MINOR (AIRS/AFS) ENFORCEMENT/COMPLIANCE ACTIVITY (Integrated Compliance Information System) - ICIS-01-2003-9206, FORMAL ENFORCEMENT ACTION (Integrated Compliance Information System) - ICIS-01-2003-9206, FORMAL ENFORCEMENT ACTION CRITERIA AND HAZARDOUS AIR POLLUTANT INVENTORY (Inventory of air pollution sources) Small Quantity Generators, between 100 kg and 1000 kg of hazardous waste/month (Resource Conservation and Recovery Act (tracking hazardous waste)) Business SIC classification: COLLEGES, UNIVERSITIES, AND PROFESSIONAL SCHOOLS
BRIGHAM & WOMENS HOSPITAL (75 FRANCIS STREET in BOSTON, MA)
AIR SYNTHETIC MINOR (AIRS/AFS) CRITERIA AND HAZARDOUS AIR POLLUTANT INVENTORY (Inventory of air pollution sources) HAZARDOUS WASTE BIENNIAL REPORTER (Resource Conservation and Recovery Act (tracking hazardous waste)) - ICIS-, ENFORCEMENT/COMPLIANCE ACTIVITY, Large Quantity Generators, more that 1000 kg of hazardous waste/month (Resource Conservation and Recovery Act (tracking hazardous waste)) - notification - ICIS-, ENFORCEMENT/COMPLIANCE ACTIVITY, Business SIC classification: GENERAL MEDICAL AND SURGICAL HOSPITALS Organizations: BRIGHAM AND WOMENS HOSPITAL (CONTACT/OPERATOR)
MUSEUM OF FINE ARTS SCHOOL (230 THE FENWAY in BOSTON, MA)
ENFORCEMENT/COMPLIANCE ACTIVITY (Integrated Compliance Information System) - ICIS-01-2003-9026, FORMAL ENFORCEMENT ACTION (Integrated Compliance Information System) - ICIS-01-2003-9026, FORMAL ENFORCEMENT ACTION Alternative names: SCHOOL OF THE MUSEUM OF FINE ARTS
NEW ENGLAND CONSERVATORY OF MUSIC (295 HUNTINGTON AVE in BOSTON, MA)
ENFORCEMENT/COMPLIANCE ACTIVITY (Integrated Compliance Information System) - ICIS-01-2003-9033, FORMAL ENFORCEMENT ACTION (Integrated Compliance Information System) - ICIS-01-2003-9033, FORMAL ENFORCEMENT ACTION
NEW ENGLAND CONSERVATORY OF MUSIC - JORDAN HALL (GAINSBOROUGH STREET in BOSTON, MA)
ENFORCEMENT/COMPLIANCE ACTIVITY (Integrated Compliance Information System) - ICIS-01-2003-9033, FORMAL ENFORCEMENT ACTION (Integrated Compliance Information System) - ICIS-01-2003-9033, FORMAL ENFORCEMENT ACTION
NEW ENGLAND CONSERVATORY OF MUSIC - RESIDENCE HALL (GAINSBOROUGH STREET in BOSTON, MA)
ENFORCEMENT/COMPLIANCE ACTIVITY (Integrated Compliance Information System) - ICIS-01-2003-9033, FORMAL ENFORCEMENT ACTION (Integrated Compliance Information System) - ICIS-01-2003-9033, FORMAL ENFORCEMENT ACTION
NEW ENGLAND CONSERVATORY OF MUSIC - ST BOTOLPH ST. BLDG. (241 ST BOTOLPH STREET in BOSTON, MA)
ENFORCEMENT/COMPLIANCE ACTIVITY (Integrated Compliance Information System) - ICIS-01-2003-9033, FORMAL ENFORCEMENT ACTION (Integrated Compliance Information System) - ICIS-01-2003-9033, FORMAL ENFORCEMENT ACTION
MASS COLLEGE OF PHARMACY & HEALTH SERVIC (179 LONGWOOD AVENUE in BOSTON, MA)
AIR MINOR (AIRS/AFS) CRITERIA AND HAZARDOUS AIR POLLUTANT INVENTORY (Inventory of air pollution sources) National Pollutant Discharge Elimination System NON-MAJOR (Tracking pollutant discharge elimination systems) - permit (Resource Conservation and Recovery Act (tracking hazardous waste)) Business SIC classification: COLLEGES, UNIVERSITIES, AND PROFESSIONAL SCHOOLS Organizations: MASS COLLEGE OF PHARMACY CORPORATION (CONTACT/OWNER)
Alternative names: MA COLLEGE OF PHARMACY, MASSACHUSETTS COLLEGE OF PHARMACY & HEALTH SCIENCES, MASS COLL PHARMACY, MASS COLLEGE PHARMAC
CHILDRENS HOSPITAL (300 LONGWOOD AVENUE in BOSTON, MA)
AIR MINOR (AIRS/AFS) AIR MONITORING SITE (Airborne pollution emission tracking) CRITERIA AND HAZARDOUS AIR POLLUTANT INVENTORY (Inventory of air pollution sources) HAZARDOUS WASTE BIENNIAL REPORTER (Resource Conservation and Recovery Act (tracking hazardous waste)) Large Quantity Generators, more that 1000 kg of hazardous waste/month (Resource Conservation and Recovery Act (tracking hazardous waste)) - notification Business SIC classification: GENERAL MEDICAL AND SURGICAL HOSPITALS Organizations: CHILDREN'S HOSPITAL (CONTACT/OPERATOR)
Alternative names: CHILDRENS HOSPITAL MEDICAL CENTER
MOTIVA ENTERPRISES LLC (1241 BOYLSTON ST in BOSTON, MA)
STATE MASTER (MA-EPICS) - RCRAINFO-MAV000007193, HAZARDOUS WASTE PROGRAM Conditionally Exempt Small Quantity Generators, less than 100 kg/month of hazardous waste (Resource Conservation and Recovery Act (tracking hazardous waste)) - notification Organizations: STAR ENTERPRISE (CONTACT/OWNER)
Alternative names: FENWAY TEXACO, MOTIVA ENTERPRISES LLC TEXACO SERV STA, STAR ENTERPRISE, TEXACO SERVICE STATION
NORTHEASTERN UNIVERSITY (360 HUNTINGTON AVENUE in BOSTON, MA)
AIR MAJOR (AIRS/AFS) AIR MINOR (AIRS/AFS) CRITERIA AND HAZARDOUS AIR POLLUTANT INVENTORY (Inventory of air pollution sources) Small Quantity Generators, between 100 kg and 1000 kg of hazardous waste/month (Resource Conservation and Recovery Act (tracking hazardous waste)) - notification Business SIC classification: COLLEGES, UNIVERSITIES, AND PROFESSIONAL SCHOOLS Alternative names: NORTHEASTERN U. M.C.
Housing units lacking complete plumbing facilities: 0.4% Housing units lacking complete kitchen facilities: 1.3%
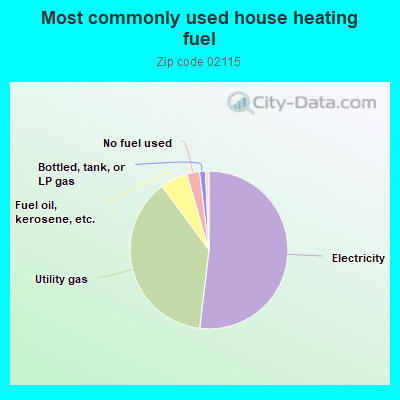
51.8%Electricity
37.9%Utility gas
5.6%Fuel oil, kerosene, etc.
2.6%No fuel used
1.2%Bottled, tank, or LP gas
0.7%Other fuel
Population in 1990: 25,597.
Place of birth for U.S.-born residents:
This state: 7,519
Northeast: 6,951
Midwest: 1,278
South: 2,648
West: 1,702
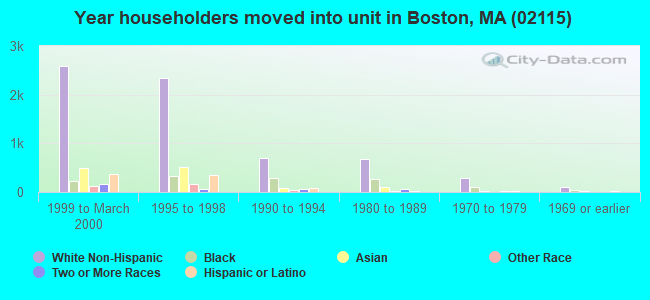
27% of the 02115 zip code residents lived in the same house 5 years ago. Out of people who lived in different houses, 21% lived in this county. Out of people who lived in different counties, 50% lived in Massachusetts.
77% of the 02115 zip code residents lived in the same house 1 year ago. Out of people who lived in different houses, 44% moved from this county. Out of people who lived in different houses, 13% moved from different county within same state. Out of people who lived in different houses, 20% moved from different state. Out of people who lived in different houses, 23% moved from abroad.
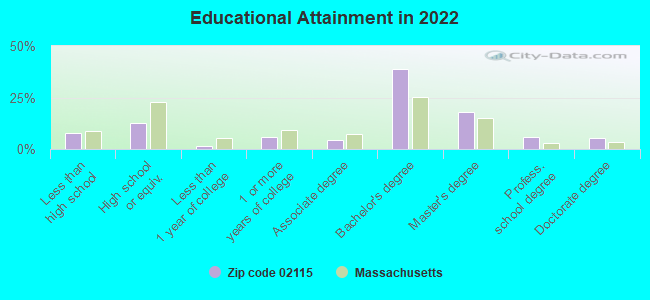
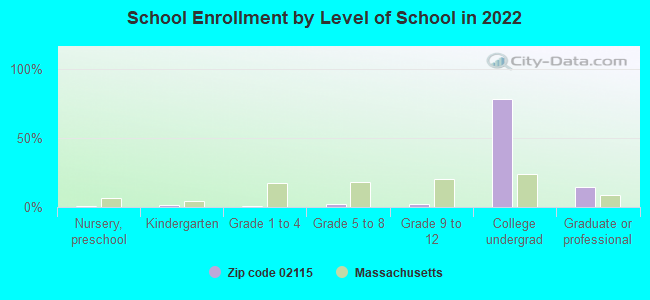
Private vs. public school enrollment:
Students in private schools in grades 1 to 8 (elementary and middle school): 255
Here:
54.6%
Massachusetts:
10.3%
Students in private schools in grades 9 to 12 (high school): 138
Here:
33.8%
Massachusetts:
12.3%
Students in private undergraduate colleges: 12,353
Here:
91.4%
Massachusetts:
51.2%
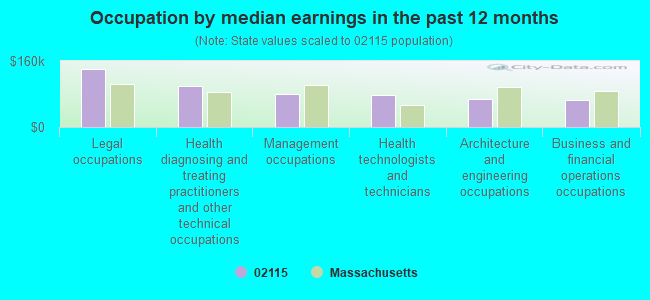
Occupation by median earnings in the past 12 months ($)
139,737Legal occupations
99,402Health diagnosing and treating practitioners and other technical occupations
80,511Management occupations
78,274Health technologists and technicians
67,094Architecture and engineering occupations
66,654Business and financial operations occupations
Companies with biggest federal contracts located in this zip code (BOSTON, MA):
THE NEW ENGLAND COLLEGE OF OPT (424 BEACON STREET) : $2,476,672 in 51 contractsfrom 1999 to 2006
Contracts for Other Medical Services, Optometry Services, Tuition, Registration, and Membership Fees, Educational Services, and moreby Department of Veterans Affairs, Navy, Army Signed by year:2000: $146,000; 2001: $210,952; 2002: $434,112; 2003: $660,405; 2004: $531,844; 2005: $392,230; 2006: $53,129.
Biggest contracts:
$188,596 with Department of Veterans Affairs for Other Medical Services. Signed on 2004-10-01. Completion date: 2005-09-30.
$173,849, same as above.Signed on 2004-04-01. Completion date: 2004-09-30.
$173,849 with Department of Veterans Affairs for Optometry Services. Signed on 2003-11-01. Completion date: 2004-10-31.
$167,448, same as above.Signed on 2003-06-15. Completion date: 2003-09-15.
BRIGHAM & WOMEN'S HOSPITAL (75 FRANCIS STREET) : $1,574,383 in 2 contractsfrom 2004 to 2005
$975,177 with National Institutes of Health for Biomedical -- Applied Research and Exploratory Development (R&D). Signed on 2004-09-21. Completion date: 2005-10-31.
$599,206, same as above.Signed on 2005-04-01. Completion date: 2006-06-30.
TERAGRAM CORP (236 HUNGTINGTON AVE STE 30; small business)
$98,757 with Army for Other Defense -- Applied Research and Exploratory Development (R&D). Signed on 2002-03-21. Completion date: 2002-11-29.
THOMPSON, KIMBERLY (677 HUNTINGTON AVE; small business)
$39,800 with Army for Chemical/Biological Studies and Analyses. Signed on 2003-01-27. Completion date: 2003-03-30.
SEAN PIDGEON (74 SYMPHONY RD #2; small business) : $28,466 in 6 contractsfrom 2002 to 2003
Contracts for Technical Assistance by Army Signed by year:2000: $0; 2001: $0; 2002: $19,397; 2003: $9,069; 2004: $0; 2005: $0; 2006: $0.
Biggest contracts:
$9,094 with Army for Technical Assistance. Signed on 2002-08-28. Completion date: 2003-01-01.
$7,275, same as above.Signed on 2002-05-21. Completion date: 2003-01-01.
$6,889, same as above.Signed on 2003-07-24. Completion date: 2004-01-01.
$3,028, same as above.Signed on 2002-12-16. Completion date: 2004-01-01.
RAYBURN MUSICAL INST CO INC (238 HUNTINGTON AVE; small business) : $27,845 in 4 contractsfrom 2001 to 2005
$12,150 with Army for Miscellaneous Service and Trade Equipment. Signed on 2003-08-28. Completion date: 2003-11-21.
$9,000 with Army for Musical Instruments. Taking place in VA. Signed on 2001-05-16. Completion date: 2001-06-01.
$3,825 with Army for Lease or Rental of Equipment -- Musical Instruments, Phonographs, and Home-Type Radios. Signed on 2005-12-30. Completion date: 2006-01-06.
$2,870 with Army for Musical Instruments. Signed on 2002-09-11. Completion date: 2002-10-02.
NEW ENGLAND CONSERVATORY OF MU (290 HUNTINGTON AVENUE)
$26,405 with Navy for Tuition, Registration, and Membership Fees. Signed on 2002-01-23. Completion date: 2002-07-31.
HARRINGTON, SHANNON (4 SYMPHONY RD APT#4; small business)
$10,288 with Army for Technical Assistance. Signed on 2003-08-13. Completion date: 2003-12-31.
BOSTON SYMPHONY ORCHESTRA INC (301 MASSACHUSETTS AVE; small business) : $10,010 in 2 contractsin 2004
$9,610 with Army for Lease or Rental of Facilities -- Museums and Exhibition Buildings. Signed on 2004-03-25. Completion date: 2004-03-29.
$400, same as above.Signed on 2004-09-27. Completion date: 2004-03-29.
TAPE COMPLEX INC, THE (4 HAVILAND ST; small business)
$6,868 with Air Force for Audio/Visual Services. Signed on 2005-07-21. Completion date: 2005-10-31.
Top industries in this zip code by the number of employees in 2005:
Health Care and Social Assistance: Specialty (except Psychiatric and Substance Abuse) Hospitals (over 1000: 1)
Health Care and Social Assistance: Offices of Physicians (except Mental Health Specialists) (500-999: 1, 100-249: 1, 50-99: 2, 20-49: 5, 10-19: 2, 5-9: 7, 1-4: 9)
Professional, Scientific, and Technical Services: Research and Development in the Physical, Engineering, and Life Sciences (100-249: 3, 50-99: 2, 20-49: 5, 10-19: 2, 5-9: 1, 1-4: 3)
2002 - 2018 National Fire Incident Reporting System (NFIRS) incidents
According to the data from the years 2002 - 2018 the average number of fires per year is 307. The highest number of reported fires - 415 took place in 2013, and the least - 171 in 2002. The data has an increasing trend.
When looking into fire subcategories, the most incidents belonged to: Structure Fires (76.9%), and Outside Fires (15.2%).
Fire incident types reported to NFIRS in Zip Code 02115


 Nearest zip codes: 02120, 02215, 02446, 02119, 02199, 02139.


 According to the data from the years 2002 - 2018 the average number of fires per year is 307. The highest number of reported fires - 415 took place in 2013, and the least - 171 in 2002. The data has an increasing trend.
 When looking into fire subcategories, the most incidents belonged to: Structure Fires (76.9%), and Outside Fires (15.2%).