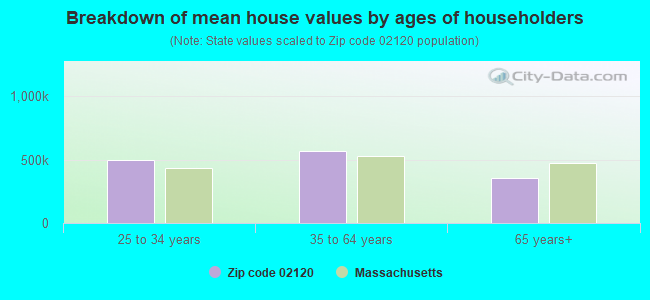
Estimated median house/condo value in 2022: $1,020,228
02120:
$1,020,228
Massachusetts:
$534,700
According to our research of Massachusetts and other state lists, there were 4 registered sex offenders living in 02120 zip code as of April 27, 2024. The ratio of all residents to sex offenders in zip code 02120 is 3,885 to 1. The ratio of registered sex offenders to all residents in this zip code is much lower than the state average.
Median resident age:
This zip code:
24.1 years
Massachusetts median age:
40.3 years
Average household size:
This zip code:
2.5 people
Massachusetts:
2.4 people
Averages for the 2020 tax year for zip code 02120, filed in 2021:
Average Adjusted Gross Income (AGI) in 2020: $42,514 (Individual Income Tax Returns)
Here:
$42,514
State:
$105,130
Salary/wage: $38,876 (reported on 89.1% of returns)
Here:
$38,876
State:
$82,951
(% of AGI for various income ranges: 1218.2% for AGIs below $25k, 3455.9% for AGIs $25k-50k, 6784.9% for AGIs $50k-75k, 10844.0% for AGIs $75k-100k, 23801.4% for AGIs $100k-200k, 80006.7% for AGIs over 200k)
Taxable interest for individuals: $638 (reported on 18.3% of returns)
This zip code:
$638
Massachusetts:
$2,361
(% of AGI for various income ranges: 4.2% for AGIs below $25k, 6.7% for AGIs $25k-50k, 20.2% for AGIs $50k-75k, 38.5% for AGIs $75k-100k, 92.1% for AGIs $100k-200k, 486.7% for AGIs over 200k)
Ordinary dividends: $1,832 (reported on 14.3% of returns)
Here:
$1,832
State:
$10,365
(% of AGI for various income ranges: 7.7% for AGIs below $25k, 10.7% for AGIs $25k-50k, 52.6% for AGIs $50k-75k, 57.0% for AGIs $75k-100k, 331.4% for AGIs $100k-200k, 890.0% for AGIs over 200k)
Net capital gain/loss in AGI: +$5,239 (reported on 13.8% of returns)
Here:
+$5,239
State:
+$48,178
(% of AGI for various income ranges: 13.3% for AGIs below $25k, 23.2% for AGIs $25k-50k, 57.0% for AGIs $50k-75k, 226.0% for AGIs $75k-100k, 724.3% for AGIs $100k-200k, 5336.7% for AGIs over 200k)
Profit/loss from business: +$7,669 (reported on 11.2% of returns)
Here:
+$7,669
State:
+$20,792
(% of AGI for various income ranges: 63.6% for AGIs below $25k, 83.9% for AGIs $25k-50k, 82.5% for AGIs $50k-75k, 141.0% for AGIs $75k-100k, 1129.3% for AGIs $100k-200k)
Taxable individual retirement arrangement distribution: $11,169 (reported on 2.4% of returns)
02120:
$11,169
Massachusetts:
$22,790
(% of AGI for various income ranges: 5.2% for AGIs below $25k, 15.4% for AGIs $25k-50k, 104.2% for AGIs $50k-75k, 381.4% for AGIs $100k-200k)
Total itemized deductions: $25,356 (reported on 2.9% of returns)
Here:
$25,356
State:
$36,722
(% of AGI for various income ranges: 36.6% for AGIs $25k-50k, 109.8% for AGIs $50k-75k, 215.5% for AGIs $75k-100k, 806.4% for AGIs $100k-200k, 4443.3% for AGIs over 200k)
Charity contributions: $8,100 (reported on 2.2% of returns)
Here:
$8,100
State:
$12,529
(% of AGI for various income ranges: 4.8% for AGIs below $25k, 39.5% for AGIs $50k-75k, 247.1% for AGIs $100k-200k, 1036.7% for AGIs over 200k)
Taxes paid: $7,281 (reported on 2.9% of returns)
02120:
$7,281
State:
$8,782
(% of AGI for various income ranges: 10.1% for AGIs $25k-50k, 24.7% for AGIs $50k-75k, 62.5% for AGIs $75k-100k, 257.1% for AGIs $100k-200k, 1303.3% for AGIs over 200k)
Earned income credit: $2,076 (reported on 18.5% of returns)
Here:
$2,076
State:
$1,909
(% of AGI for various income ranges: 70.1% for AGIs below $25k, 55.0% for AGIs $25k-50k)
Percentage of individuals using paid preparers for their 2020 taxes: 92.8%
Here:
93%
State:
92%
(% for various income ranges: 91.8% for AGIs below $25k, 93.8% for AGIs $25k-50k, 93.2% for AGIs $50k-75k, 93.3% for AGIs $75k-100k, 93.3% for AGIs $100k-200k, 90.0% for AGIs over 200k)
Averages for the 2012 tax year for zip code 02120, filed in 2013:
Average Adjusted Gross Income (AGI) in 2012: $32,314 (Individual Income Tax Returns)
Here:
$32,314
State:
$81,425
Salary/wage: $30,286 (reported on 90.8% of returns)
Here:
$30,286
State:
$64,752
(% of AGI for various income ranges: 85.6% for AGIs below $25k, 90.9% for AGIs $25k-50k, 88.9% for AGIs $50k-75k, 80.7% for AGIs $75k-100k, 83.9% for AGIs $100k-200k, 57.5% for AGIs over 200k)
Taxable interest for individuals: $941 (reported on 17.5% of returns)
This zip code:
$941
Massachusetts:
$2,136
(% of AGI for various income ranges: 0.2% for AGIs below $25k, 0.3% for AGIs $25k-50k, 0.2% for AGIs $50k-75k, 1.4% for AGIs $75k-100k, 0.9% for AGIs $100k-200k, 1.3% for AGIs over 200k)
Ordinary dividends: $2,448 (reported on 9.4% of returns)
Here:
$2,448
State:
$9,473
(% of AGI for various income ranges: 0.5% for AGIs below $25k, 0.7% for AGIs $25k-50k, 0.5% for AGIs $50k-75k, 0.4% for AGIs $75k-100k, 1.8% for AGIs $100k-200k)
Net capital gain/loss in AGI: +$10,273 (reported on 6.7% of returns)
Here:
+$10,273
State:
+$31,437
(% of AGI for various income ranges: 0.2% for AGIs $75k-100k, 14.1% for AGIs $100k-200k)
Profit/loss from business: +$8,972 (reported on 10.2% of returns)
Here:
+$8,972
State:
+$20,662
(% of AGI for various income ranges: 6.8% for AGIs below $25k, 1.7% for AGIs $25k-50k, 1.3% for AGIs $50k-75k, 3.6% for AGIs $75k-100k, 2.2% for AGIs $100k-200k)
Taxable individual retirement arrangement distribution: $9,408 (reported on 2.4% of returns)
02120:
$9,408
Massachusetts:
$18,892
(% of AGI for various income ranges: 0.6% for AGIs below $25k, 0.4% for AGIs $25k-50k, 1.3% for AGIs $50k-75k, 2.3% for AGIs $75k-100k)
Total itemized deductions: $19,386 (22% of AGI, reported on 11.6% of returns)
Here:
$19,386
State:
$28,907
Here:
22.4% of AGI
State:
18.2% of AGI
(% of AGI for various income ranges: 3.1% for AGIs below $25k, 3.6% for AGIs $25k-50k, 6.1% for AGIs $50k-75k, 9.8% for AGIs $75k-100k, 14.4% for AGIs $100k-200k, 15.3% for AGIs over 200k)
Charity contributions: $3,383 (reported on 9.4% of returns)
Here:
$3,383
State:
$4,208
(% of AGI for various income ranges: 0.3% for AGIs below $25k, 0.6% for AGIs $25k-50k, 1.1% for AGIs $50k-75k, 1.4% for AGIs $75k-100k, 2.0% for AGIs $100k-200k, 2.0% for AGIs over 200k)
Taxes paid: $6,311 (reported on 11.4% of returns)
02120:
$6,311
State:
$13,303
(% of AGI for various income ranges: 0.6% for AGIs below $25k, 0.9% for AGIs $25k-50k, 1.8% for AGIs $50k-75k, 3.3% for AGIs $75k-100k, 5.5% for AGIs $100k-200k, 5.5% for AGIs over 200k)
Earned income credit: $2,245 (reported on 27.1% of returns)
Here:
$2,245
State:
$1,971
(% of AGI for various income ranges: 7.5% for AGIs below $25k, 1.1% for AGIs $25k-50k)
Percentage of individuals using paid preparers for their 2012 taxes: 41.3%
Here:
41%
State:
56%
(% for various income ranges: 39.3% for AGIs below $25k, 41.2% for AGIs $25k-50k, 41.3% for AGIs $50k-75k, 50.0% for AGIs $75k-100k, 61.1% for AGIs $100k-200k, 66.7% for AGIs over 200k)
Averages for the 2004 tax year for zip code 02120, filed in 2005:
Average Adjusted Gross Income (AGI) in 2004: $27,515 (Individual Income Tax Returns)
Here:
$27,515
State:
$62,877
Salary/wage: $26,913 (reported on 91.7% of returns)
Here:
$26,913
State:
$52,969
(% of AGI for various income ranges: 107.6% for AGIs below $10k, 90.6% for AGIs $10k-25k, 94.3% for AGIs $25k-50k, 88.5% for AGIs $50k-75k, 90.0% for AGIs $75k-100k, 70.8% for AGIs over 100k)
Taxable interest for individuals: $937 (reported on 24.7% of returns)
This zip code:
$937
Massachusetts:
$1,945
(% of AGI for various income ranges: 1.0% for AGIs below $10k, 0.6% for AGIs $10k-25k, 0.3% for AGIs $25k-50k, 1.7% for AGIs $50k-75k, 0.7% for AGIs $75k-100k, 1.7% for AGIs over 100k)
Taxable dividends: $1,217 (reported on 9.5% of returns)
Here:
$1,217
State:
$5,323
(% of AGI for various income ranges: 0.8% for AGIs below $10k, 0.3% for AGIs $10k-25k, 0.2% for AGIs $25k-50k, 0.3% for AGIs $50k-75k, 0.8% for AGIs $75k-100k, 0.9% for AGIs over 100k)
Net capital gain/loss: +$3,302 (reported on 7.1% of returns)
Here:
+$3,302
State:
+$20,377
(% of AGI for various income ranges: -0.4% for AGIs below $10k, 0.2% for AGIs $10k-25k, 0.1% for AGIs $25k-50k, 0.1% for AGIs $50k-75k, 0.6% for AGIs $75k-100k, 5.7% for AGIs over 100k)
Profit/loss from business: +$7,523 (reported on 9.5% of returns)
Here:
+$7,523
State:
+$17,837
(% of AGI for various income ranges: 10.2% for AGIs below $10k, 3.6% for AGIs $10k-25k, 0.7% for AGIs $25k-50k, 2.1% for AGIs $50k-75k, 2.8% for AGIs $75k-100k, 4.9% for AGIs over 100k)
IRA payment deduction: $2,840 (reported on 1.6% of returns)
02120:
$2,840
Massachusetts:
$3,100
(% of AGI for various income ranges: 0.1% for AGIs $10k-25k, 0.2% for AGIs $25k-50k, 0.2% for AGIs $50k-75k, 0.4% for AGIs $75k-100k)
Total itemized deductions: $14,152 (25% of AGI, reported on 14.9% of returns)
Here:
$14,152
State:
$22,573
Here:
24.7% of AGI
State:
19.5% of AGI
(% of AGI for various income ranges: 3.4% for AGIs below $10k, 3.6% for AGIs $10k-25k, 5.7% for AGIs $25k-50k, 10.2% for AGIs $50k-75k, 14.5% for AGIs $75k-100k, 13.5% for AGIs over 100k)
Charity contributions deductions: $2,521 (4% of AGI, reported on 11.2% of returns)
Here:
$2,521
State:
$3,295
Here:
3.9% of AGI
State:
2.7% of AGI
(% of AGI for various income ranges: 0.4% for AGIs $10k-25k, 0.8% for AGIs $25k-50k, 1.8% for AGIs $50k-75k, 1.7% for AGIs $75k-100k, 1.5% for AGIs over 100k)
Total tax: $3,704 (reported on 66.6% of returns)
02120:
$3,704
State:
$11,494
(% of AGI for various income ranges: 2.9% for AGIs below $10k, 4.0% for AGIs $10k-25k, 7.4% for AGIs $25k-50k, 11.5% for AGIs $50k-75k, 13.5% for AGIs $75k-100k, 17.0% for AGIs over 100k)
Earned income credit: $1,646 (reported on 25.6% of returns)
Here:
$1,646
State:
$1,518
Percentage of individuals using paid preparers for their 2004 taxes: 48.5%
Here:
48%
State:
58%
(% for various income ranges: 43.7% for AGIs below $10k, 50.4% for AGIs $10k-25k, 48.0% for AGIs $25k-50k, 52.6% for AGIs $50k-75k, 52.7% for AGIs $75k-100k, 61.2% for AGIs over 100k)
Likely homosexual households (counted as self-reported same-sex unmarried-partner households)
Lesbian couples: 0.0% of all households
Gay men: 0.3% of all households
Household received Food Stamps/SNAP in the past 12 months: 1,529 Household did not receive Food Stamps/SNAP in the past 12 months: 3,300
Women who had a birth in the past 12 months: 90 (64 now married, 25 unmarried) Women who did not have a birth in the past 12 months: 4,667 (404 now married, 4,344 unmarried)
Housing units in zip code 02120 with a mortgage: 239 (27 second mortgage, 14 both second mortgage and home equity loan) Median monthly owner costs for units with a mortgage: $2,089 Median monthly owner costs for units without a mortgage: $1,172
Residents with income below the poverty level in 2022:
This zip code:
40.9%
Whole state:
10.4%
Residents with income below 50% of the poverty level in 2022:
This zip code:
17.0%
Whole state:
5.1%
Median number of rooms in houses and condos:
Here:
5.2
State:
6.5
Median number of rooms in apartments:
Here:
4.2
State:
4.0
Notable locations in this zip code not listed on our city pages
Notable locations in zip code 02120: Ruggles Station (A), Mockler Center (B), Columbus Place (C), Roxbury Community College Learning Resources Center (D), John D O'Bryant School of Mathematics and Science Library (E). Display/hide their locations on the map
333 married couples with children.
796 single-parent households (796 women).
56.5% of residents of 02120 zip code speak English at home.
19.1% of residents speak Spanish at home (51% very well, 26% well, 17% not well, 6% not at all).
8.6% of residents speak other Indo-European language at home (83% very well, 13% well, 4% not well).
12.4% of residents speak Asian or Pacific Island language at home (56% very well, 19% well, 14% not well, 11% not at all).
3.2% of residents speak other language at home (82% very well, 12% well, 6% not well).
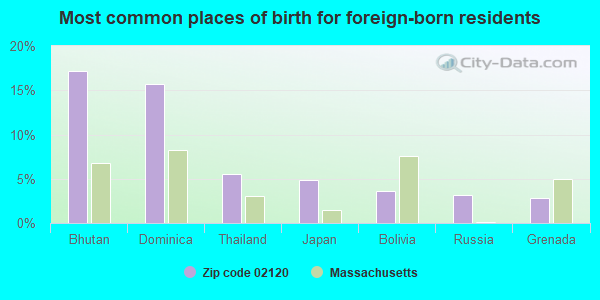
Foreign born population: 3,640 (25.4%) (45.0% of them are naturalized citizens)
This zip code:
25.4%
Whole state:
18.0%
17%Bhutan
16%Dominica
6%Thailand
5%Japan
4%Bolivia
3%Russia
3%Grenada
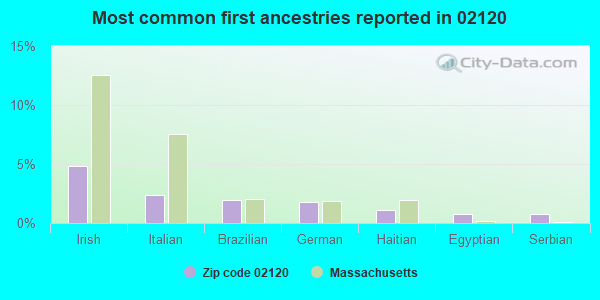
5%Irish
2%Italian
2%Brazilian
2%German
1%Haitian
1%Egyptian
1%Serbian
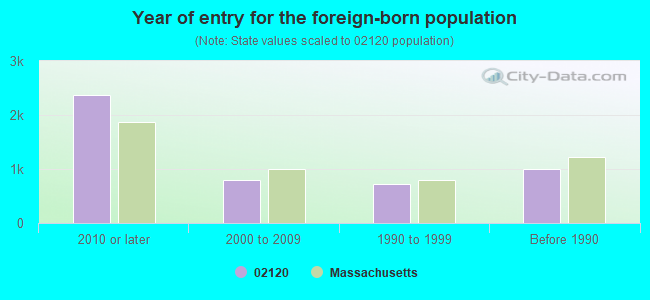
Year of entry for the foreign-born population
2,3652010 or later
8052000 to 2009
7261990 to 1999
992Before 1990
Private high school in in this zip code not listed on the city page:
MANVILLE SCHOOL (Students: 95, Location: 53 PARKER HILL AVE, Grades: 1-10)
Private elementary/middle school in in this zip code not listed on the city page:
OUR LADY OF PERPETUAL HELP/MISSION GRAMMAR SCHOOL (Students: 219, Location: 94 SAINT ALPHONSUS ST, Grades: PK-8)
Facilities with environmental interests located in this zip code:
NEW ENGLAND BAPTIST HOSPITAL (125 PARKER HILL AVENUE in BOSTON, MA)
AIR SYNTHETIC MINOR (AIRS/AFS) (Integrated Compliance Information System) - ICIS-01-1984-0011, FORMAL ENFORCEMENT ACTION CRITERIA AND HAZARDOUS AIR POLLUTANT INVENTORY (Inventory of air pollution sources) Conditionally Exempt Small Quantity Generators, less than 100 kg/month of hazardous waste (Resource Conservation and Recovery Act (tracking hazardous waste)) - notification Business SIC classification: GENERAL MEDICAL AND SURGICAL HOSPITALS Alternative names: NEW ENG BAPTIST HOSP
MISSION HILL SCHOOL (67 ALLEGHENY STREET in BOSTON, MA)
(National Center for Education Statistics) - STATE ID-035382 Organizations: BOSTON (SCHOOL DISTRICT)
NEW MISSION HIGH SCHOOL (67 ALLEGHANY STREET in ROXBURY, MA)
(National Center for Education Statistics) - STATE ID-035542 Organizations: BOSTON (SCHOOL DISTRICT)
MADISON PARK HIGH (75 MALCOLM X BLVD in ROXBURY, MA)
(National Center for Education Statistics) - STATE ID-035537 Organizations: BOSTON (SCHOOL DISTRICT)
MISSION MAIN REDEVELOPMENT PROJECT (30 TOBIN COURT in BOSTON, MA)
AIR MINOR (AIRS/AFS) CRITERIA AND HAZARDOUS AIR POLLUTANT INVENTORY (Inventory of air pollution sources) Business SIC classification: NONCLASSIFIABLE ESTABLISHMENTS Alternative names: MISSION MAIN DEVELOP
MWRA WARD STREET (WARD STREET in BOSTON, MA)
AIR MINOR (AIRS/AFS) CRITERIA AND HAZARDOUS AIR POLLUTANT INVENTORY (Inventory of air pollution sources) Business SIC classification: SEWERAGE SYSTEMS
PAPER RECYCLING (43 REAR NEW HEATH ST in BOSTON, MA)
(Resource Conservation and Recovery Act (tracking hazardous waste))
AUTO BODY SUPPLY (35A TENEAN ST in BOSTON, MA)
Conditionally Exempt Small Quantity Generators, less than 100 kg/month of hazardous waste (Resource Conservation and Recovery Act (tracking hazardous waste)) - notification Organizations: MARC GUDEMA (CONTACT/OWNER)
BACK BAY MANOR ASSOCIATES LLP (75 ST. ALPHONSUS ST. in BOSTON, MA)
AIR MINOR (AIRS/AFS) Business SIC classification: RESIDENTIAL CARE
BENTLEYS CLEANERS (680 PARKER ST in BOSTON, MA)
(Resource Conservation and Recovery Act (tracking hazardous waste))
BOSTON CLUTCH WORKS INC (1486 TREMONT ST in BOSTON, MA)
Conditionally Exempt Small Quantity Generators, less than 100 kg/month of hazardous waste (Resource Conservation and Recovery Act (tracking hazardous waste)) - notification Organizations: DAVID EPSTEIN (CONTACT/OWNER)
BOSTON DPW (280 HIGHLAND ST in BOSTON, MA)
Small Quantity Generators, between 100 kg and 1000 kg of hazardous waste/month (Resource Conservation and Recovery Act (tracking hazardous waste)) - notification Organizations: CITY OF BOSTON DPW (CONTACT/OWNER)
Alternative names: BOSTON CITY OF DPW
LANDMARK CONDOMINIUM (160 FEDERAL STREET in BOSTON, MA)
AIR MINOR (AIRS/AFS) Business SIC classification: REAL ESTATE AGENTS AND MANAGERS
Housing units lacking complete plumbing facilities: 1.2% Housing units lacking complete kitchen facilities: 1.0%
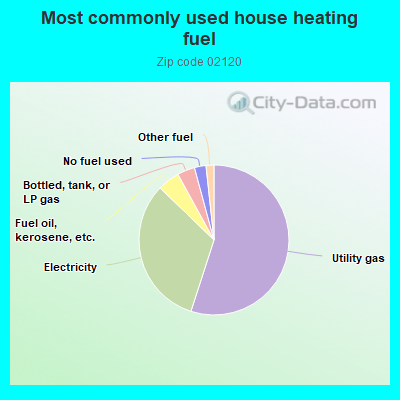
55.1%Utility gas
32.3%Electricity
4.8%Fuel oil, kerosene, etc.
3.8%Bottled, tank, or LP gas
2.5%No fuel used
1.7%Other fuel
Population in 1990: 14,212.
Place of birth for U.S.-born residents:
This state: 4,923
Northeast: 2,409
Midwest: 479
South: 1,207
West: 693
47% of the 02120 zip code residents lived in the same house 5 years ago. Out of people who lived in different houses, 53% lived in this county. Out of people who lived in different counties, 50% lived in Massachusetts.
78% of the 02120 zip code residents lived in the same house 1 year ago. Out of people who lived in different houses, 37% moved from this county. Out of people who lived in different houses, 15% moved from different county within same state. Out of people who lived in different houses, 22% moved from different state. Out of people who lived in different houses, 30% moved from abroad.
Private vs. public school enrollment:
Students in private schools in grades 1 to 8 (elementary and middle school): 59
Here:
11.1%
Massachusetts:
10.3%
Students in private schools in grades 9 to 12 (high school): 8
Here:
2.3%
Massachusetts:
12.3%
Students in private undergraduate colleges: 4,208
Here:
86.8%
Massachusetts:
51.2%
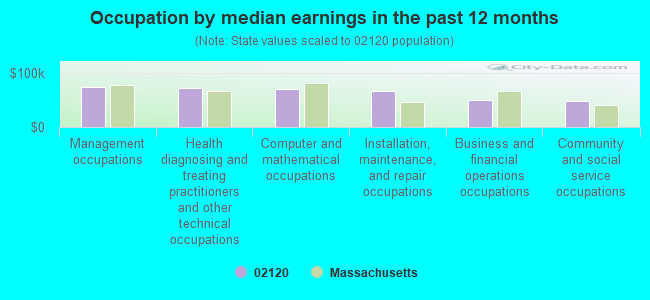
Occupation by median earnings in the past 12 months ($)
74,493Management occupations
71,685Health diagnosing and treating practitioners and other technical occupations
69,969Computer and mathematical occupations
67,037Installation, maintenance, and repair occupations
51,119Business and financial operations occupations
48,905Community and social service occupations
Companies with federal contracts located in this zip code:
BRADY, SEAN (700 COLUMBUS AVE in BOSTON, MA; small business)
$5,076 with Army for Technical Assistance. Signed on 2002-12-16. Completion date: 2003-02-09.
LUOMA, CHARLES E (16 SEWALL ST, APT 1 in BOSTON, MA; small business)
$3,736 with Army for Technical Assistance. Signed on 2005-09-23. Completion date: 2006-01-31.
Top industries in this zip code by the number of employees in 2005:
Administrative and Support and Waste Management and Remediation Services: Security Guards and Patrol Services (over 1000 employees: 1 establishment, 1-4 employees: 1 establishment)
Health Care and Social Assistance: General Medical and Surgical Hospitals (over 1000: 1)
Professional, Scientific, and Technical Services: Other Accounting Services (250-499: 1)
Health Care and Social Assistance: Offices of Physicians (except Mental Health Specialists) (50-99: 1, 20-49: 3, 10-19: 3, 5-9: 6, 1-4: 19)
Health Care and Social Assistance: Nursing Care Facilities (100-249: 1)
Health Care and Social Assistance: All Other Outpatient Care Centers (100-249: 1)
Administrative and Support and Waste Management and Remediation Services: Office Administrative Services (20-49: 3)
Health Care and Social Assistance: Child Day Care Services (20-49: 2, 10-19: 1, 5-9: 1, 1-4: 1)
Health Care and Social Assistance: Other Individual and Family Services (20-49: 2, 10-19: 1, 5-9: 1)
People in group quarters in 2010:
1,685 people in college/university student housing
162 people in nursing facilities/skilled-nursing facilities
83 people in group homes intended for adults
18 people in workers' group living quarters and job corps centers
13 people in group homes for juveniles (non-correctional)
6 people in other noninstitutional facilities
People in group quarters in 2000:
188 people in nursing homes
32 people in religious group quarters
18 people in homes for the mentally retarded
15 people in wards in general hospitals for patients who have no usual home elsewhere
Fatal accident statistics in 2010:
Fatal accident count: 1
Vehicles involved in fatal accidents: 2
Fatal accidents caused by drunken drivers: 1
Fatalities: 1
Persons involved in fatal accidents: 2
Pedestrians involved in fatal accidents: 0
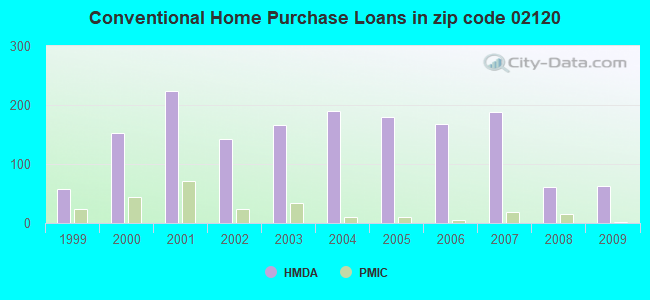
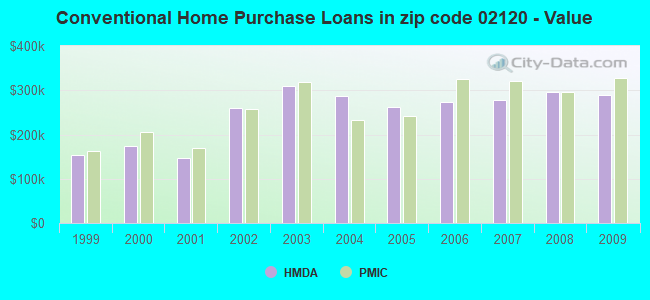
Home Mortgage Disclosure Act Aggregated Statistics For Year 2009 (Based on 4 full and 10 partial tracts)
A) FHA, FSA/RHS & VA Home Purchase Loans
B) Conventional Home Purchase Loans
C) Refinancings
D) Home Improvement Loans
E) Loans on Dwellings For 5+ Families
F) Non-occupant Loans on < 5 Family Dwellings (A B C & D)
Number
Average Value
Number
Average Value
Number
Average Value
Number
Average Value
Number
Average Value
Number
Average Value
LOANS ORIGINATED
8
$259,555
63
$288,927
132
$288,291
14
$37,905
5
$1,883,488
60
$442,103
APPLICATIONS APPROVED, NOT ACCEPTED
3
$415,123
11
$363,806
8
$156,881
1
$20,980
0
$0
3
$327,353
APPLICATIONS DENIED
4
$345,122
26
$253,457
49
$305,234
6
$98,083
1
$6,460,300
34
$328,986
APPLICATIONS WITHDRAWN
2
$305,815
13
$363,405
28
$277,292
2
$544,005
0
$0
15
$407,086
FILES CLOSED FOR INCOMPLETENESS
0
$0
2
$440,050
11
$270,235
0
$0
0
$0
5
$394,690
Aggregated Statistics For Year 2008 (Based on 4 full and 10 partial tracts)
A) FHA, FSA/RHS & VA Home Purchase Loans
B) Conventional Home Purchase Loans
C) Refinancings
D) Home Improvement Loans
E) Loans on Dwellings For 5+ Families
F) Non-occupant Loans on < 5 Family Dwellings (A B C & D)
Number
Average Value
Number
Average Value
Number
Average Value
Number
Average Value
Number
Average Value
Number
Average Value
LOANS ORIGINATED
5
$278,170
61
$296,656
86
$316,249
5
$234,082
12
$1,433,444
40
$406,842
APPLICATIONS APPROVED, NOT ACCEPTED
0
$0
9
$402,908
19
$343,937
1
$17,230
0
$0
17
$401,469
APPLICATIONS DENIED
2
$403,435
28
$322,360
71
$372,588
13
$188,148
0
$0
28
$409,459
APPLICATIONS WITHDRAWN
3
$308,470
11
$265,684
31
$292,203
2
$21,815
0
$0
14
$312,945
FILES CLOSED FOR INCOMPLETENESS
0
$0
7
$343,521
10
$339,028
2
$15,520
0
$0
9
$375,927
Aggregated Statistics For Year 2007 (Based on 4 full and 10 partial tracts)
A) FHA, FSA/RHS & VA Home Purchase Loans
B) Conventional Home Purchase Loans
C) Refinancings
D) Home Improvement Loans
E) Loans on Dwellings For 5+ Families
F) Non-occupant Loans on < 5 Family Dwellings (A B C & D)
Number
Average Value
Number
Average Value
Number
Average Value
Number
Average Value
Number
Average Value
Number
Average Value
LOANS ORIGINATED
1
$265,530
188
$278,860
128
$360,171
30
$280,791
15
$976,193
123
$467,924
APPLICATIONS APPROVED, NOT ACCEPTED
0
$0
32
$285,572
25
$299,237
7
$113,291
0
$0
18
$339,985
APPLICATIONS DENIED
0
$0
64
$371,213
110
$381,316
24
$89,821
0
$0
69
$502,863
APPLICATIONS WITHDRAWN
0
$0
46
$362,906
41
$274,420
1
$207,930
2
$487,500
28
$370,879
FILES CLOSED FOR INCOMPLETENESS
0
$0
6
$392,457
16
$413,327
0
$0
0
$0
8
$537,612
Aggregated Statistics For Year 2006 (Based on 4 full and 10 partial tracts)
B) Conventional Home Purchase Loans
C) Refinancings
D) Home Improvement Loans
E) Loans on Dwellings For 5+ Families
F) Non-occupant Loans on < 5 Family Dwellings (A B C & D)
G) Loans On Manufactured Home Dwelling (A B C & D)
Number
Average Value
Number
Average Value
Number
Average Value
Number
Average Value
Number
Average Value
Number
Average Value
LOANS ORIGINATED
168
$274,226
156
$334,065
28
$273,022
7
$1,842,127
130
$415,038
0
$0
APPLICATIONS APPROVED, NOT ACCEPTED
23
$254,752
29
$332,356
6
$279,922
0
$0
10
$303,284
0
$0
APPLICATIONS DENIED
67
$355,434
128
$340,844
33
$215,302
0
$0
46
$434,857
1
$158,570
APPLICATIONS WITHDRAWN
36
$302,634
73
$300,807
2
$49,695
2
$1,389,375
18
$399,500
0
$0
FILES CLOSED FOR INCOMPLETENESS
3
$173,877
17
$374,583
1
$125,850
2
$1,269,450
5
$363,460
0
$0
Aggregated Statistics For Year 2005 (Based on 4 full and 10 partial tracts)
A) FHA, FSA/RHS & VA Home Purchase Loans
B) Conventional Home Purchase Loans
C) Refinancings
D) Home Improvement Loans
E) Loans on Dwellings For 5+ Families
F) Non-occupant Loans on < 5 Family Dwellings (A B C & D)
G) Loans On Manufactured Home Dwelling (A B C & D)
Number
Average Value
Number
Average Value
Number
Average Value
Number
Average Value
Number
Average Value
Number
Average Value
Number
Average Value
LOANS ORIGINATED
0
$0
179
$262,472
196
$328,372
29
$212,426
7
$793,810
138
$380,185
0
$0
APPLICATIONS APPROVED, NOT ACCEPTED
1
$216,110
9
$268,842
26
$255,732
7
$230,151
0
$0
8
$360,709
0
$0
APPLICATIONS DENIED
2
$170,895
53
$224,987
98
$302,650
33
$92,810
2
$1,402,130
50
$243,500
4
$242,225
APPLICATIONS WITHDRAWN
0
$0
47
$233,187
92
$280,163
3
$213,480
2
$511,635
25
$306,429
0
$0
FILES CLOSED FOR INCOMPLETENESS
0
$0
6
$336,617
25
$338,460
0
$0
0
$0
7
$391,897
0
$0
Aggregated Statistics For Year 2004 (Based on 4 full and 10 partial tracts)
A) FHA, FSA/RHS & VA Home Purchase Loans
B) Conventional Home Purchase Loans
C) Refinancings
D) Home Improvement Loans
E) Loans on Dwellings For 5+ Families
F) Non-occupant Loans on < 5 Family Dwellings (A B C & D)
Number
Average Value
Number
Average Value
Number
Average Value
Number
Average Value
Number
Average Value
Number
Average Value
LOANS ORIGINATED
0
$0
190
$286,280
246
$318,840
29
$241,970
8
$1,057,388
171
$410,606
APPLICATIONS APPROVED, NOT ACCEPTED
0
$0
15
$302,231
32
$257,380
5
$77,952
2
$858,000
14
$327,079
APPLICATIONS DENIED
3
$200,063
49
$366,340
95
$256,878
36
$100,596
2
$1,121,250
41
$347,774
APPLICATIONS WITHDRAWN
0
$0
34
$240,220
95
$246,398
6
$101,842
2
$610,515
36
$306,626
FILES CLOSED FOR INCOMPLETENESS
0
$0
3
$169,480
14
$283,211
3
$37,673
0
$0
3
$455,497
Aggregated Statistics For Year 2003 (Based on 4 full and 10 partial tracts)
A) FHA, FSA/RHS & VA Home Purchase Loans
B) Conventional Home Purchase Loans
C) Refinancings
D) Home Improvement Loans
E) Loans on Dwellings For 5+ Families
F) Non-occupant Loans on < 5 Family Dwellings (A B C & D)
Number
Average Value
Number
Average Value
Number
Average Value
Number
Average Value
Number
Average Value
Number
Average Value
LOANS ORIGINATED
1
$451,430
166
$310,130
500
$222,457
13
$76,208
7
$828,689
225
$324,804
APPLICATIONS APPROVED, NOT ACCEPTED
1
$255,150
15
$248,883
78
$222,051
2
$52,935
1
$367,460
28
$338,464
APPLICATIONS DENIED
0
$0
36
$311,277
140
$240,914
10
$86,046
0
$0
40
$327,003
APPLICATIONS WITHDRAWN
1
$163,800
24
$259,611
91
$223,949
5
$161,278
0
$0
31
$286,928
FILES CLOSED FOR INCOMPLETENESS
0
$0
2
$319,485
20
$278,526
1
$62,930
0
$0
14
$297,661
Aggregated Statistics For Year 2002 (Based on 4 full and 10 partial tracts)
A) FHA, FSA/RHS & VA Home Purchase Loans
B) Conventional Home Purchase Loans
C) Refinancings
D) Home Improvement Loans
E) Loans on Dwellings For 5+ Families
F) Non-occupant Loans on < 5 Family Dwellings (A B C & D)
Number
Average Value
Number
Average Value
Number
Average Value
Number
Average Value
Number
Average Value
Number
Average Value
LOANS ORIGINATED
2
$246,930
143
$259,385
323
$222,787
16
$46,949
15
$715,048
184
$288,179
APPLICATIONS APPROVED, NOT ACCEPTED
0
$0
21
$249,105
74
$213,381
5
$66,316
0
$0
31
$318,995
APPLICATIONS DENIED
1
$145,020
26
$288,760
69
$209,932
24
$105,535
0
$0
29
$323,515
APPLICATIONS WITHDRAWN
3
$304,810
14
$280,809
67
$180,462
3
$57,250
2
$585,000
17
$237,396
FILES CLOSED FOR INCOMPLETENESS
0
$0
1
$109,070
18
$181,343
0
$0
0
$0
1
$258,380
Aggregated Statistics For Year 2001 (Based on 4 full and 10 partial tracts)
A) FHA, FSA/RHS & VA Home Purchase Loans
B) Conventional Home Purchase Loans
C) Refinancings
D) Home Improvement Loans
E) Loans on Dwellings For 5+ Families
F) Non-occupant Loans on < 5 Family Dwellings (A B C & D)
Number
Average Value
Number
Average Value
Number
Average Value
Number
Average Value
Number
Average Value
Number
Average Value
LOANS ORIGINATED
4
$215,198
223
$147,782
247
$205,496
14
$69,916
7
$562,043
108
$259,449
APPLICATIONS APPROVED, NOT ACCEPTED
4
$192,858
22
$133,224
29
$207,745
6
$133,533
0
$0
16
$285,438
APPLICATIONS DENIED
5
$227,620
33
$156,777
78
$162,071
26
$48,716
0
$0
32
$218,040
APPLICATIONS WITHDRAWN
3
$106,987
23
$157,658
52
$134,406
3
$87,670
0
$0
19
$141,537
FILES CLOSED FOR INCOMPLETENESS
0
$0
8
$181,925
10
$210,716
0
$0
0
$0
5
$221,948
Aggregated Statistics For Year 2000 (Based on 4 full and 10 partial tracts)
A) FHA, FSA/RHS & VA Home Purchase Loans
B) Conventional Home Purchase Loans
C) Refinancings
D) Home Improvement Loans
E) Loans on Dwellings For 5+ Families
F) Non-occupant Loans on < 5 Family Dwellings (A B C & D)
Number
Average Value
Number
Average Value
Number
Average Value
Number
Average Value
Number
Average Value
Number
Average Value
LOANS ORIGINATED
4
$143,622
153
$174,364
106
$189,930
19
$46,395
6
$1,083,818
82
$245,236
APPLICATIONS APPROVED, NOT ACCEPTED
3
$227,790
35
$242,697
16
$135,713
13
$57,755
0
$0
22
$271,847
APPLICATIONS DENIED
1
$310,760
58
$215,017
63
$123,645
16
$43,316
1
$545,350
30
$232,605
APPLICATIONS WITHDRAWN
4
$177,030
26
$210,381
23
$87,402
4
$39,985
0
$0
11
$257,675
FILES CLOSED FOR INCOMPLETENESS
0
$0
10
$172,579
6
$101,162
0
$0
0
$0
3
$174,907
Aggregated Statistics For Year 1999 (Based on 2 full and 6 partial tracts)
A) FHA, FSA/RHS & VA Home Purchase Loans
B) Conventional Home Purchase Loans
C) Refinancings
D) Home Improvement Loans
E) Loans on Dwellings For 5+ Families
F) Non-occupant Loans on < 5 Family Dwellings (A B C & D)
2002 - 2018 National Fire Incident Reporting System (NFIRS) incidents
Based on the data from the years 2002 - 2018 the average number of fire incidents per year is 175. The highest number of fire incidents - 231 took place in 2012, and the least - 51 in 2002. The data has a rising trend.
When looking into fire subcategories, the most incidents belonged to: Structure Fires (75.7%), and Outside Fires (17.5%).
Fire incident types reported to NFIRS in Zip Code 02120


 Nearest zip codes: 02115, 02119, 02215, 02199, 02118, 02116.


 (Students: 95, Location: 53 PARKER HILL AVE, Grades: 1-10)

 Based on the data from the years 2002 - 2018 the average number of fire incidents per year is 175. The highest number of fire incidents - 231 took place in 2012, and the least - 51 in 2002. The data has a rising trend.
 When looking into fire subcategories, the most incidents belonged to: Structure Fires (75.7%), and Outside Fires (17.5%).