Estimated zip code population in 2022: 25,320 Zip code population in 2010: 24,514 Zip code population in 2000: 25,095
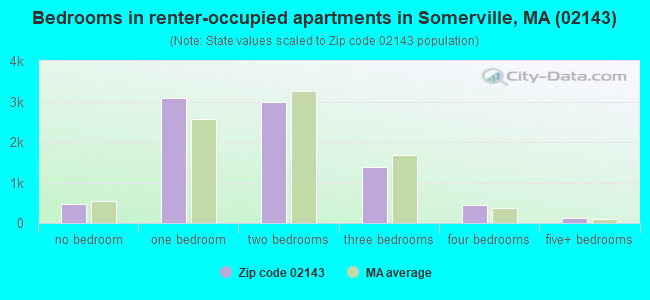
Houses and condos: 13,005 Renter-occupied apartments: 8,509
% of renters here:
69%
State:
38%
March 2022 cost of living index in zip code 02143: 139.3 (high, U.S. average is 100)
Land area: 1.5 sq. mi. Water area: 0.0 sq. mi.
Population density: 16,407 people per square mile
(very high).
OSM Map
Google Map
MSN Map
OSM Map
General Map
Google Map
MSN Map
OSM Map
Google Map
MSN Map
OSM Map
Google Map
MSN Map
Please wait while loading the map...
Real estate property taxes paid for housing units in 2022:
This zip code:
0.6% ($5,989)
Massachusetts:
1.0% ($5,536)
Median real estate property taxes paid for housing units with mortgages in 2022: $5,693 (0.6%) Median real estate property taxes paid for housing units with no mortgage in 2022: $6,682 (0.7%)
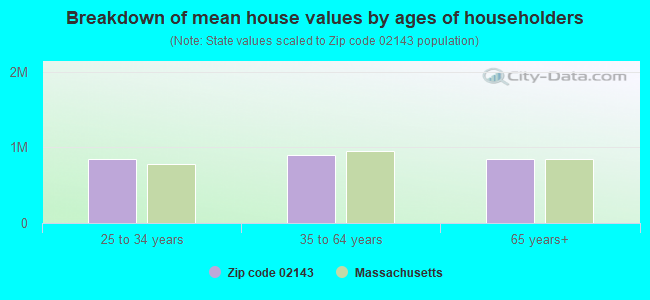
Estimated median house/condo value in 2022: $949,178
02143:
$949,178
Massachusetts:
$534,700
According to our research of Massachusetts and other state lists, there were 2 registered sex offenders living in 02143 zip code as of April 26, 2024. The ratio of all residents to sex offenders in zip code 02143 is 13,592 to 1. The ratio of registered sex offenders to all residents in this zip code is much lower than the state average.
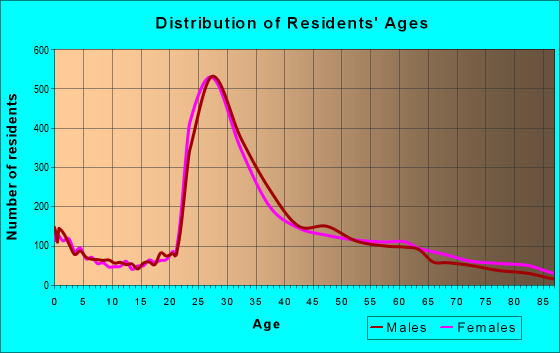
Median resident age:
This zip code:
33.2 years
Massachusetts median age:
40.3 years
Average household size:
This zip code:
2.0 people
Massachusetts:
2.4 people
Averages for the 2020 tax year for zip code 02143, filed in 2021:
Average Adjusted Gross Income (AGI) in 2020: $96,437 (Individual Income Tax Returns)
Here:
$96,437
State:
$105,130
Salary/wage: $86,814 (reported on 88.9% of returns)
Here:
$86,814
State:
$82,951
(% of AGI for various income ranges: 1273.7% for AGIs below $25k, 4160.0% for AGIs $25k-50k, 7405.8% for AGIs $50k-75k, 11858.7% for AGIs $75k-100k, 21959.3% for AGIs $100k-200k, 100723.8% for AGIs over 200k)
Taxable interest for individuals: $1,185 (reported on 41.7% of returns)
This zip code:
$1,185
Massachusetts:
$2,361
(% of AGI for various income ranges: 23.7% for AGIs below $25k, 19.1% for AGIs $25k-50k, 28.1% for AGIs $50k-75k, 56.3% for AGIs $75k-100k, 137.8% for AGIs $100k-200k, 792.6% for AGIs over 200k)
Ordinary dividends: $4,435 (reported on 33.7% of returns)
Here:
$4,435
State:
$10,365
(% of AGI for various income ranges: 38.3% for AGIs below $25k, 39.8% for AGIs $25k-50k, 59.2% for AGIs $50k-75k, 154.1% for AGIs $75k-100k, 406.5% for AGIs $100k-200k, 2845.0% for AGIs over 200k)
Net capital gain/loss in AGI: +$24,127 (reported on 30.4% of returns)
Here:
+$24,127
State:
+$48,178
(% of AGI for various income ranges: 26.9% for AGIs below $25k, 43.8% for AGIs $25k-50k, 99.8% for AGIs $50k-75k, 193.0% for AGIs $75k-100k, 722.9% for AGIs $100k-200k, 22139.5% for AGIs over 200k)
Profit/loss from business: +$16,489 (reported on 16.0% of returns)
Here:
+$16,489
State:
+$20,792
(% of AGI for various income ranges: 191.1% for AGIs below $25k, 203.8% for AGIs $25k-50k, 181.2% for AGIs $50k-75k, 386.5% for AGIs $75k-100k, 691.5% for AGIs $100k-200k, 3098.8% for AGIs over 200k)
Taxable individual retirement arrangement distribution: $14,464 (reported on 4.5% of returns)
02143:
$14,464
Massachusetts:
$22,790
(% of AGI for various income ranges: 51.7% for AGIs below $25k, 42.2% for AGIs $25k-50k, 60.4% for AGIs $50k-75k, 113.2% for AGIs $75k-100k, 224.2% for AGIs $100k-200k, 508.6% for AGIs over 200k)
Self-employed (Keogh) retirement plans: $20,893 (reported on 1.0% of returns)
02143:
$20,893
Massachusetts:
$26,868
(% of AGI for various income ranges: 15.9% for AGIs $50k-75k, 44.0% for AGIs $100k-200k, 524.5% for AGIs over 200k)
Total itemized deductions: $29,915 (reported on 10.1% of returns)
Here:
$29,915
State:
$36,722
(% of AGI for various income ranges: 68.1% for AGIs below $25k, 54.2% for AGIs $25k-50k, 105.3% for AGIs $50k-75k, 311.2% for AGIs $75k-100k, 959.9% for AGIs $100k-200k, 5570.2% for AGIs over 200k)
Charity contributions: $6,906 (reported on 7.6% of returns)
Here:
$6,906
State:
$12,529
(% of AGI for various income ranges: 4.8% for AGIs below $25k, 6.8% for AGIs $25k-50k, 13.8% for AGIs $50k-75k, 37.0% for AGIs $75k-100k, 123.0% for AGIs $100k-200k, 1218.1% for AGIs over 200k)
Taxes paid: $8,795 (reported on 10.1% of returns)
02143:
$8,795
State:
$8,782
(% of AGI for various income ranges: 15.6% for AGIs below $25k, 12.8% for AGIs $25k-50k, 30.4% for AGIs $50k-75k, 95.8% for AGIs $75k-100k, 333.2% for AGIs $100k-200k, 1504.3% for AGIs over 200k)
Earned income credit: $1,104 (reported on 4.9% of returns)
Here:
$1,104
State:
$1,909
(% of AGI for various income ranges: 29.5% for AGIs below $25k, 11.6% for AGIs $25k-50k)
Percentage of individuals using paid preparers for their 2020 taxes: 93.2%
Here:
93%
State:
92%
(% for various income ranges: 88.9% for AGIs below $25k, 93.2% for AGIs $25k-50k, 94.4% for AGIs $50k-75k, 94.0% for AGIs $75k-100k, 94.3% for AGIs $100k-200k, 96.4% for AGIs over 200k)
Averages for the 2012 tax year for zip code 02143, filed in 2013:
Average Adjusted Gross Income (AGI) in 2012: $56,017 (Individual Income Tax Returns)
Here:
$56,017
State:
$81,425
Salary/wage: $53,950 (reported on 89.7% of returns)
Here:
$53,950
State:
$64,752
(% of AGI for various income ranges: 79.0% for AGIs below $25k, 89.5% for AGIs $25k-50k, 90.1% for AGIs $50k-75k, 88.9% for AGIs $75k-100k, 88.4% for AGIs $100k-200k, 76.0% for AGIs over 200k)
Taxable interest for individuals: $739 (reported on 39.5% of returns)
This zip code:
$739
Massachusetts:
$2,136
(% of AGI for various income ranges: 0.8% for AGIs below $25k, 0.3% for AGIs $25k-50k, 0.5% for AGIs $50k-75k, 0.4% for AGIs $75k-100k, 0.4% for AGIs $100k-200k, 1.0% for AGIs over 200k)
Ordinary dividends: $3,112 (reported on 22.1% of returns)
Here:
$3,112
State:
$9,473
(% of AGI for various income ranges: 1.3% for AGIs below $25k, 0.7% for AGIs $25k-50k, 0.9% for AGIs $50k-75k, 1.2% for AGIs $75k-100k, 1.2% for AGIs $100k-200k, 2.4% for AGIs over 200k)
Net capital gain/loss in AGI: +$5,951 (reported on 16.9% of returns)
Here:
+$5,951
State:
+$31,437
(% of AGI for various income ranges: 0.1% for AGIs below $25k, 0.4% for AGIs $25k-50k, 0.6% for AGIs $50k-75k, 0.6% for AGIs $75k-100k, 1.5% for AGIs $100k-200k, 7.2% for AGIs over 200k)
Profit/loss from business: +$14,232 (reported on 14.9% of returns)
Here:
+$14,232
State:
+$20,662
(% of AGI for various income ranges: 9.1% for AGIs below $25k, 3.8% for AGIs $25k-50k, 3.1% for AGIs $50k-75k, 2.2% for AGIs $75k-100k, 3.0% for AGIs $100k-200k, 4.6% for AGIs over 200k)
Taxable individual retirement arrangement distribution: $11,260 (reported on 5.0% of returns)
02143:
$11,260
Massachusetts:
$18,892
(% of AGI for various income ranges: 1.7% for AGIs below $25k, 0.8% for AGIs $25k-50k, 0.7% for AGIs $50k-75k, 0.8% for AGIs $75k-100k, 1.0% for AGIs $100k-200k, 1.3% for AGIs over 200k)
Self-employment retirement plans: $12,077 (reported on 0.9% of returns)
02143:
$12,077
Massachusetts:
$20,669
(% of AGI for various income ranges: 0.1% for AGIs $50k-75k, 0.3% for AGIs $100k-200k, 0.6% for AGIs over 200k)
Total itemized deductions: $20,605 (18% of AGI, reported on 20.7% of returns)
Here:
$20,605
State:
$28,907
Here:
17.6% of AGI
State:
18.2% of AGI
(% of AGI for various income ranges: 6.4% for AGIs below $25k, 3.4% for AGIs $25k-50k, 5.5% for AGIs $50k-75k, 7.6% for AGIs $75k-100k, 11.2% for AGIs $100k-200k, 10.9% for AGIs over 200k)
Charity contributions: $2,130 (reported on 15.8% of returns)
Here:
$2,130
State:
$4,208
(% of AGI for various income ranges: 0.3% for AGIs below $25k, 0.3% for AGIs $25k-50k, 0.4% for AGIs $50k-75k, 0.6% for AGIs $75k-100k, 0.9% for AGIs $100k-200k, 0.9% for AGIs over 200k)
Taxes paid: $8,851 (reported on 20.7% of returns)
02143:
$8,851
State:
$13,303
(% of AGI for various income ranges: 1.3% for AGIs below $25k, 0.9% for AGIs $25k-50k, 1.8% for AGIs $50k-75k, 3.0% for AGIs $75k-100k, 5.1% for AGIs $100k-200k, 6.4% for AGIs over 200k)
Earned income credit: $1,211 (reported on 8.1% of returns)
Here:
$1,211
State:
$1,971
(% of AGI for various income ranges: 1.9% for AGIs below $25k, 0.2% for AGIs $25k-50k)
Percentage of individuals using paid preparers for their 2012 taxes: 38.5%
Here:
39%
State:
56%
(% for various income ranges: 39.7% for AGIs below $25k, 33.7% for AGIs $25k-50k, 37.1% for AGIs $50k-75k, 40.5% for AGIs $75k-100k, 46.5% for AGIs $100k-200k, 57.5% for AGIs over 200k)
Averages for the 2004 tax year for zip code 02143, filed in 2005:
Average Adjusted Gross Income (AGI) in 2004: $40,104 (Individual Income Tax Returns)
Here:
$40,104
State:
$62,877
Salary/wage: $39,223 (reported on 88.0% of returns)
Here:
$39,223
State:
$52,969
(% of AGI for various income ranges: 111.6% for AGIs below $10k, 81.7% for AGIs $10k-25k, 91.4% for AGIs $25k-50k, 89.7% for AGIs $50k-75k, 88.3% for AGIs $75k-100k, 74.9% for AGIs over 100k)
Taxable interest for individuals: $893 (reported on 45.9% of returns)
This zip code:
$893
Massachusetts:
$1,945
(% of AGI for various income ranges: 4.4% for AGIs below $10k, 1.4% for AGIs $10k-25k, 0.7% for AGIs $25k-50k, 0.9% for AGIs $50k-75k, 1.0% for AGIs $75k-100k, 1.2% for AGIs over 100k)
Taxable dividends: $1,719 (reported on 21.8% of returns)
Here:
$1,719
State:
$5,323
(% of AGI for various income ranges: 3.5% for AGIs below $10k, 0.9% for AGIs $10k-25k, 0.6% for AGIs $25k-50k, 0.7% for AGIs $50k-75k, 0.9% for AGIs $75k-100k, 1.5% for AGIs over 100k)
Net capital gain/loss: +$6,959 (reported on 16.9% of returns)
Here:
+$6,959
State:
+$20,377
(% of AGI for various income ranges: -2.0% for AGIs below $10k, 0.1% for AGIs $10k-25k, 0.2% for AGIs $25k-50k, 0.8% for AGIs $50k-75k, 1.9% for AGIs $75k-100k, 10.6% for AGIs over 100k)
Profit/loss from business: +$10,217 (reported on 14.3% of returns)
Here:
+$10,217
State:
+$17,837
(% of AGI for various income ranges: 15.6% for AGIs below $10k, 6.5% for AGIs $10k-25k, 2.9% for AGIs $25k-50k, 2.2% for AGIs $50k-75k, 3.3% for AGIs $75k-100k, 4.1% for AGIs over 100k)
IRA payment deduction: $2,776 (reported on 2.7% of returns)
02143:
$2,776
Massachusetts:
$3,100
(% of AGI for various income ranges: 0.3% for AGIs $10k-25k, 0.3% for AGIs $25k-50k, 0.2% for AGIs $50k-75k, 0.2% for AGIs $75k-100k, 0.1% for AGIs over 100k)
Self-employed pension: $9,617 (reported on 0.7% of returns)
Here:
$9,617
Massachusetts:
$14,516
(% of AGI for various income ranges: 0.1% for AGIs $25k-50k, 0.1% for AGIs $50k-75k, 0.2% for AGIs $75k-100k, 0.4% for AGIs over 100k)
Total itemized deductions: $15,188 (20% of AGI, reported on 21.0% of returns)
Here:
$15,188
State:
$22,573
Here:
20.4% of AGI
State:
19.5% of AGI
(% of AGI for various income ranges: 16.6% for AGIs below $10k, 5.4% for AGIs $10k-25k, 4.9% for AGIs $25k-50k, 7.4% for AGIs $50k-75k, 9.8% for AGIs $75k-100k, 12.0% for AGIs over 100k)
Charity contributions deductions: $1,853 (2% of AGI, reported on 16.7% of returns)
Here:
$1,853
State:
$3,295
Here:
2.3% of AGI
State:
2.7% of AGI
(% of AGI for various income ranges: 0.5% for AGIs below $10k, 0.5% for AGIs $10k-25k, 0.5% for AGIs $25k-50k, 0.8% for AGIs $50k-75k, 1.0% for AGIs $75k-100k, 1.1% for AGIs over 100k)
Total tax: $5,865 (reported on 83.7% of returns)
02143:
$5,865
State:
$11,494
(% of AGI for various income ranges: 4.0% for AGIs below $10k, 5.7% for AGIs $10k-25k, 9.7% for AGIs $25k-50k, 12.6% for AGIs $50k-75k, 13.6% for AGIs $75k-100k, 18.0% for AGIs over 100k)
Earned income credit: $1,025 (reported on 7.9% of returns)
Here:
$1,025
State:
$1,518
Percentage of individuals using paid preparers for their 2004 taxes: 43.5%
Here:
44%
State:
58%
(% for various income ranges: 41.4% for AGIs below $10k, 45.2% for AGIs $10k-25k, 38.7% for AGIs $25k-50k, 45.4% for AGIs $50k-75k, 50.9% for AGIs $75k-100k, 57.8% for AGIs over 100k)
Likely homosexual households (counted as self-reported same-sex unmarried-partner households)
Lesbian couples: 0.1% of all households
Gay men: 0.8% of all households
Household received Food Stamps/SNAP in the past 12 months: 1,223 Household did not receive Food Stamps/SNAP in the past 12 months: 10,974
Women who had a birth in the past 12 months: 167 (159 now married, 13 unmarried) Women who did not have a birth in the past 12 months: 8,583 (2,183 now married, 6,459 unmarried)
Housing units in zip code 02143 with a mortgage: 2,772 (456 second mortgage, 38 home equity loan, 348 both second mortgage and home equity loan) Houses without a mortgage: 68
Median monthly owner costs for units with a mortgage: $3,021 Median monthly owner costs for units without a mortgage: $1,120
Residents with income below the poverty level in 2022:
This zip code:
9.0%
Whole state:
10.4%
Residents with income below 50% of the poverty level in 2022:
This zip code:
4.1%
Whole state:
5.1%
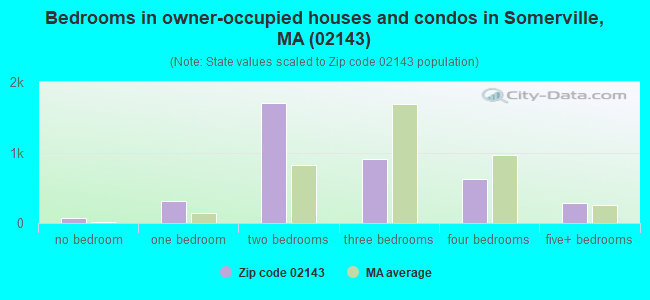
Median number of rooms in houses and condos:
Here:
5.3
State:
6.5
Median number of rooms in apartments:
Here:
3.9
State:
4.0
Notable locations in this zip code not listed on our city pages
Notable locations in zip code 02143: Union Square (A), Wilson Square (B), Inner Belt Industrial Park (C), Somerville City Hall (D), Cataldo Ambulance Service (E), Somerville Fire Department Station 3 (F), Veterans Memorial Rink (G), Somerville Public Library (H), Carr Health Sciences Library (I), Somerville Fire Department Station 7 (J), Somerville Fire Department Station 4 (K), Lincoln Park Community School Library (L), Public Library of the City of Somerville (M), Somerville Historical Museum (N), Cooper-Davenport Tavern (O). Display/hide their locations on the map
Churches in zip code 02143 include: Saint Catherines Church (A), Mission Church of Our Lord (B), Greek Orthodox Church (C), Little Sisters of the Poor (D), Greek Orthodox Church (E), Saint Anthonys Catholic Church (F), Dormition of the Holy Virgin Greek Orthodox Church (G). Display/hide their locations on the map
Parks in zip code 02143 include: Inman Square (1), Palmacci Playground (2), Perry Pond (3), Spring Hill Historic District (4), Lincoln Park (5), Conway Playground (6), Bailey Park (7), Central Hill Playground (8), Farlow Herbarium (9). Display/hide their locations on the map
1,745 married couples with children.
124 single-parent households (124 women).
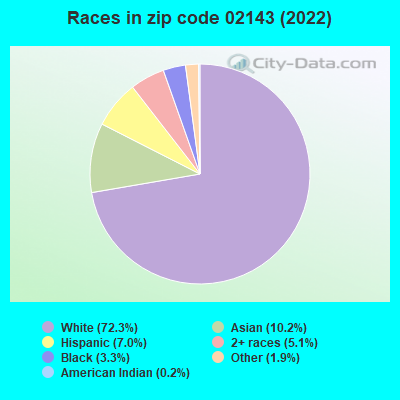
76.3% of residents of 02143 zip code speak English at home.
5.6% of residents speak Spanish at home (69% very well, 6% well, 16% not well, 9% not at all).
12.0% of residents speak other Indo-European language at home (65% very well, 16% well, 11% not well, 9% not at all).
4.8% of residents speak Asian or Pacific Island language at home (76% very well, 8% well, 16% not well).
0.9% of residents speak other language at home (85% very well, 15% well).
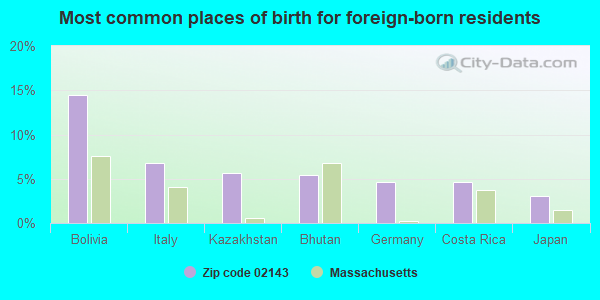
Foreign born population: 5,630 (22.2%) (37.5% of them are naturalized citizens)
Major facilities with environmental interests located in this zip code:
AMTRAK BOSTON ENGINE TERMINAL (132 WASHINGTON TERRACE YARD 5 in SOMERVILLE, MA)
(Integrated Compliance Information System) - ICIS-01-1997-0045, FORMAL ENFORCEMENT ACTION ENFORCEMENT/COMPLIANCE ACTIVITY (Integrated Compliance Information System) - ICIS-01-1999-0103, FORMAL ENFORCEMENT ACTION (Integrated Compliance Information System) - ICIS-01-1999-0103, FORMAL ENFORCEMENT ACTION
EARTH TECH (70 REAR THIRD AVE in SOMERVILLE, MA)
AIR SYNTHETIC MINOR (AIRS/AFS) (Integrated Compliance Information System) - ICIS-01-2001-0063, FORMAL ENFORCEMENT ACTION, ICIS-01-2004-2101, CRITERIA AND HAZARDOUS AIR POLLUTANT INVENTORY (Inventory of air pollution sources) (Resource Conservation and Recovery Act (tracking hazardous waste)) Business SIC classification: LOCAL AND SUBURBAN TRANSIT Business NAICS classification: COMMUTER RAIL SYSTEMS. Organizations: MASSACHUSETTS BAY COMMUTER RAILROAD COMP (CONTACT/OPERATOR)
, MA BAY TRANSPORTATION AUTHORITY (CONTACT/OWNER)
Alternative names: MA BAY COMMUTER RAILROAD CO, MBTA COMMUTER RAIL, MBTA COMMUTER RAIL MAINT FAC, NATL RAILROAD PASSENGER CORP
MASS ENVELOPE PLUS (30 COBBLE HILL RD in SOMERVILLE, MA)
STATE MASTER (MA-EPICS) - RCRAINFO-MAR000015032, HAZARDOUS WASTE PROGRAM Small Quantity Generators, between 100 kg and 1000 kg of hazardous waste/month (Resource Conservation and Recovery Act (tracking hazardous waste)) - notification Organizations: STEVEN GROSSMAN (CONTACT/OWNER)
Alternative names: MASSACHUSETTS ENVELOPE COMPANY DBA
AMERICAN ELECTROPLATING CO (26 CHESTNUT ST in SOMERVILLE, MA)
AIR MINOR (AIRS/AFS) (Resource Conservation and Recovery Act (tracking hazardous waste)) TRI REPORTER (Tracking of toxic chemicals releasing facilities) Business SIC and NAICS classification: ELECTROPLATING, PLATING, POLISHING, ANODIZING, AND COLORING Organizations: AMERICAN ELECTROPLATING COMPANY (CONTACT/OWNER)
LINCOLN PARK COMMUNITY (290 WASHINGTON in SOMERVILLE, MA)
(National Center for Education Statistics) - STATE ID-274087 Organizations: SOMERVILLE (SCHOOL DISTRICT)
BAY STATE SMELTING CO INC (15A BLEACHERY CT in SOMERVILLE, MA)
AIR MINOR (AIRS/AFS) COMPLIANCE ACTIVITY (Tracking inspections of insecticide, fungicide, and rodenticide, and toxic substances) (Resource Conservation and Recovery Act (tracking hazardous waste)) TRI REPORTER (Tracking of toxic chemicals releasing facilities) Business SIC classification: SECONDARY SMELTING AND REFINING OF NONFERROUS METALS; SCRAP AND WASTE MATERIALS
NEXT WAVE JUNIOR HIGH (8 BONAIR STREET in SOMERVILLE, MA)
(National Center for Education Statistics) - STATE ID-274410 Organizations: SOMERVILLE (SCHOOL DISTRICT)
BOSTON & MAINE CORPORATION (75R INDUSTRIAL PARKWAY in SOMERVILLE, MA)
(Integrated Compliance Information System) - ICIS-01-2004-2925, FORMAL ENFORCEMENT ACTION
NATIONAL ALUMINUM CO (43 THIRD AVENUE in SOMERVILLE, MA)
AIR MINOR (AIRS/AFS) (Resource Conservation and Recovery Act (tracking hazardous waste)) Alternative names: NATIONAL ALUMINUM G P CONSUMER
BARWOOD MFG.CO.INC (18 WILLIAMS ST in SOMERVILLE, MA)
AIR MINOR (AIRS/AFS) (Resource Conservation and Recovery Act (tracking hazardous waste)) Business SIC classification: STEAM, GAS, AND HYDRAULIC TURBINES, AND TURBINE GENERATOR SET UNITS
MAACO (444 SOMERVILLE AVE in SOMERVILLE, MA)
AIR MINOR (AIRS/AFS) CRITERIA AND HAZARDOUS AIR POLLUTANT INVENTORY (Inventory of air pollution sources) Small Quantity Generators, between 100 kg and 1000 kg of hazardous waste/month (Resource Conservation and Recovery Act (tracking hazardous waste)) - notification Business SIC classification: TOP, BODY, AND UPHOLSTERY REPAIR SHOPS AND PAINT SHOPS Alternative names: MAACO AUTO PAINTING, MAACO AUTO PAINTING & BODYWORKS
ALEX AUTO BODY (75 WASHINGTON ST in SOMERVILLE, MA)
(Resource Conservation and Recovery Act (tracking hazardous waste)) Organizations: LENA SALVATORE (CONTACT/OWNER)
NYNEX (111 CENTRAL ST in SOMERVILLE, MA)
(Resource Conservation and Recovery Act (tracking hazardous waste))
Housing units lacking complete plumbing facilities: 0.4% Housing units lacking complete kitchen facilities: 0.5%
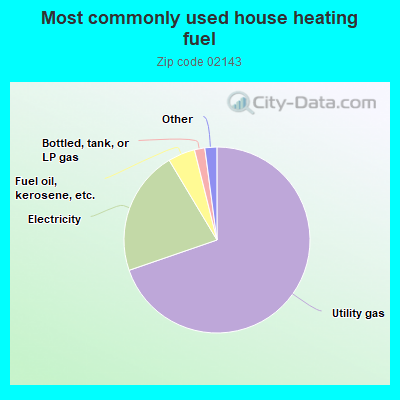
69.8%Utility gas
21.7%Electricity
4.7%Fuel oil, kerosene, etc.
1.8%Bottled, tank, or LP gas
1.0%No fuel used
0.9%Other fuel
Population in 1990: 25,597.
Place of birth for U.S.-born residents:
This state: 8,636
Northeast: 5,216
Midwest: 1,333
South: 2,185
West: 2,161
46% of the 02143 zip code residents lived in the same house 5 years ago. Out of people who lived in different houses, 43% lived in this county. Out of people who lived in different counties, 50% lived in Massachusetts.
75% of the 02143 zip code residents lived in the same house 1 year ago. Out of people who lived in different houses, 52% moved from this county. Out of people who lived in different houses, 20% moved from different county within same state. Out of people who lived in different houses, 22% moved from different state. Out of people who lived in different houses, 4% moved from abroad.
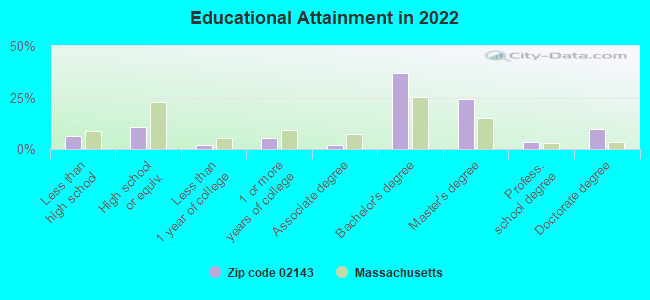
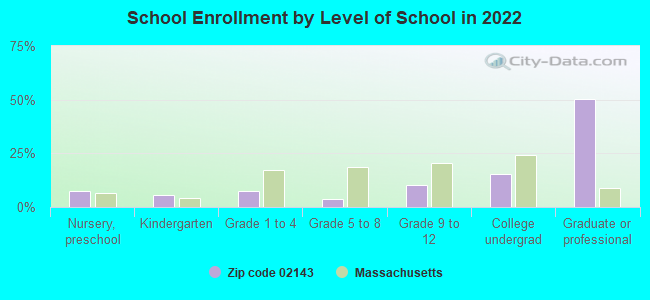
Private vs. public school enrollment:
Students in private schools in grades 1 to 8 (elementary and middle school): 36
Here:
6.7%
Massachusetts:
10.3%
Students in private schools in grades 9 to 12 (high school): 18
Here:
3.6%
Massachusetts:
12.3%
Students in private undergraduate colleges: 516
Here:
68.4%
Massachusetts:
51.2%
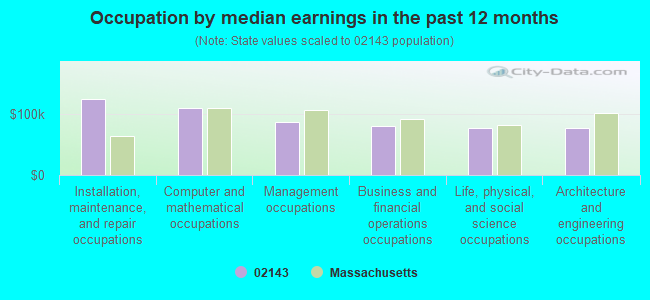
Occupation by median earnings in the past 12 months ($)
125,334Installation, maintenance, and repair occupations
109,745Computer and mathematical occupations
87,320Management occupations
81,125Business and financial operations occupations
77,680Life, physical, and social science occupations
77,270Architecture and engineering occupations
Companies with federal contracts located in this zip code (SOMERVILLE, MA):
LUMARRAY INC (15 WARD ST; small business)
$749,257 with Army for Other Defense -- Applied Research and Exploratory Development (R&D). Signed on 2005-04-11. Completion date: 2006-07-08.
HOLIDAY INN BOSTON SOMERVILLE (30 WASHINGTON ST) : $496,814 in 4 contractsfrom 1999 to 2000
$126,438 with Army for Lodging - Hotel/Motel. Signed on 2000-04-12. Completion date: 2000-04-01.
$126,146, same as above.Signed on 2000-07-13. Completion date: 2000-09-30.
$122,115, same as above.Signed on 1999-10-06. Completion date: 1999-12-31.
$122,115 with Army for Military Personnel Recruitment. Signed on 1999-12-29. Completion date: 2000-03-31.
MOLECULAR MECHANISMS LLC (70 SUMMER STREET; small business)
$69,978 with Navy for Other Defense -- Management and Support (R&D). Signed on 2002-08-23. Completion date: 2003-02-28.
COATING TECHNOLOGY SOLUTIONS (36 MUNROE ST; small business)
$9,700 with Navy for Converters, Electrical, Nonrotating. Signed on 2005-08-05. Completion date: 2008-02-10.
Top industries in this zip code by the number of employees in 2005:
Administrative and Support and Waste Management and Remediation Services: Janitorial Services (500-999 employees: 1 establishment, 5-9 employees: 1 establishment, 1-4 employees: 1 establishment)
Health Care and Social Assistance: General Medical and Surgical Hospitals (500-999: 1)
Other Services (except Public Administration): Drycleaning and Laundry Services (except Coin-Operated) (250-499: 1)
Health Care and Social Assistance: Ambulance Services (250-499: 1)
Health Care and Social Assistance: Home Health Care Services (250-499: 1)
People in group quarters in 2010:
79 people in other noninstitutional facilities
56 people in residential treatment centers for adults
54 people in emergency and transitional shelters (with sleeping facilities) for people experiencing homelessness
32 people in group homes intended for adults
22 people in nursing facilities/skilled-nursing facilities
People in group quarters in 2000:
280 people in nursing homes
52 people in other noninstitutional group quarters
46 people in religious group quarters
38 people in homes or halfway houses for drug/alcohol abuse
38 people in other nonhousehold living situations
20 people in mental (psychiatric) hospitals or wards
16 people in homes for the mentally ill
9 people in homes for the mentally retarded
Fatal accident statistics in 2014:
Fatal accident count: 1
Vehicles involved in fatal accidents: 1
Fatal accidents caused by drunken drivers: 1
Fatalities: 1
Persons involved in fatal accidents: 1
Pedestrians involved in fatal accidents: 0
Fatal accident statistics in 2011:
Fatal accident count: 1
Vehicles involved in fatal accidents: 1
Fatal accidents caused by drunken drivers: 1
Fatalities: 2
Persons involved in fatal accidents: 6
Pedestrians involved in fatal accidents: 0
Home Mortgage Disclosure Act Aggregated Statistics For Year 2009 (Based on 8 full and 2 partial tracts)
A) FHA, FSA/RHS & VA Home Purchase Loans
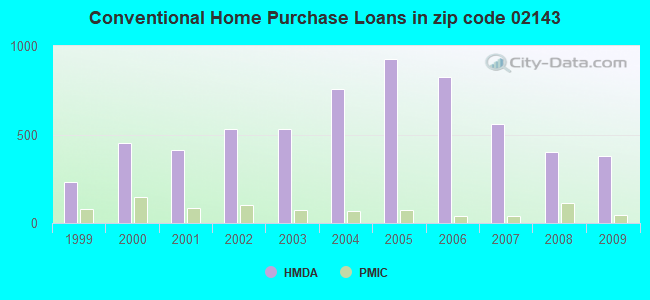
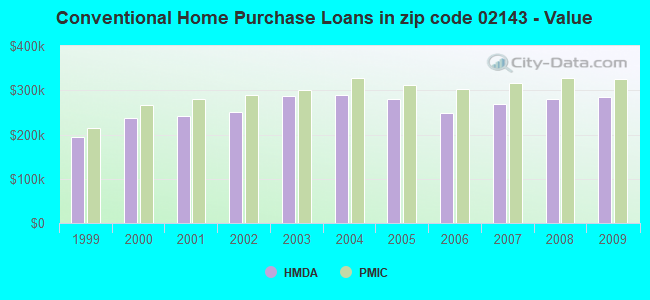
B) Conventional Home Purchase Loans
C) Refinancings
D) Home Improvement Loans
E) Loans on Dwellings For 5+ Families
F) Non-occupant Loans on < 5 Family Dwellings (A B C & D)
Number
Average Value
Number
Average Value
Number
Average Value
Number
Average Value
Number
Average Value
Number
Average Value
LOANS ORIGINATED
21
$375,850
379
$284,145
908
$280,680
48
$178,914
22
$1,063,406
105
$305,484
APPLICATIONS APPROVED, NOT ACCEPTED
2
$293,720
21
$357,175
85
$303,043
4
$22,090
4
$6,746,152
7
$401,817
APPLICATIONS DENIED
11
$437,490
39
$301,175
225
$320,909
14
$301,857
0
$0
30
$307,782
APPLICATIONS WITHDRAWN
5
$313,602
54
$279,110
137
$288,857
9
$219,844
4
$522,665
30
$290,232
FILES CLOSED FOR INCOMPLETENESS
4
$287,360
8
$360,640
44
$307,988
4
$170,300
0
$0
6
$176,792
Aggregated Statistics For Year 2008 (Based on 8 full and 2 partial tracts)
A) FHA, FSA/RHS & VA Home Purchase Loans
B) Conventional Home Purchase Loans
C) Refinancings
D) Home Improvement Loans
E) Loans on Dwellings For 5+ Families
F) Non-occupant Loans on < 5 Family Dwellings (A B C & D)
G) Loans On Manufactured Home Dwelling (A B C & D)
Number
Average Value
Number
Average Value
Number
Average Value
Number
Average Value
Number
Average Value
Number
Average Value
Number
Average Value
LOANS ORIGINATED
13
$386,430
399
$280,468
421
$295,795
43
$131,163
30
$1,578,938
124
$330,114
2
$19,005
APPLICATIONS APPROVED, NOT ACCEPTED
2
$425,735
29
$298,082
60
$312,952
8
$42,821
2
$812,505
9
$373,430
0
$0
APPLICATIONS DENIED
15
$352,226
37
$295,978
188
$363,787
28
$177,880
5
$434,262
34
$355,359
0
$0
APPLICATIONS WITHDRAWN
10
$310,409
44
$275,483
68
$353,452
2
$80,775
4
$1,600,335
6
$385,765
0
$0
FILES CLOSED FOR INCOMPLETENESS
0
$0
5
$360,678
16
$240,779
4
$226,600
0
$0
2
$120,690
0
$0
Aggregated Statistics For Year 2007 (Based on 8 full and 2 partial tracts)
A) FHA, FSA/RHS & VA Home Purchase Loans
B) Conventional Home Purchase Loans
C) Refinancings
D) Home Improvement Loans
E) Loans on Dwellings For 5+ Families
F) Non-occupant Loans on < 5 Family Dwellings (A B C & D)
Number
Average Value
Number
Average Value
Number
Average Value
Number
Average Value
Number
Average Value
Number
Average Value
LOANS ORIGINATED
0
$0
560
$269,209
494
$275,705
81
$170,632
27
$946,715
187
$359,123
APPLICATIONS APPROVED, NOT ACCEPTED
2
$312,575
68
$262,516
60
$292,484
18
$55,318
2
$284,720
7
$324,487
APPLICATIONS DENIED
0
$0
134
$377,516
236
$325,542
42
$130,973
0
$0
66
$313,287
APPLICATIONS WITHDRAWN
0
$0
52
$325,030
91
$273,931
10
$212,142
0
$0
26
$359,410
FILES CLOSED FOR INCOMPLETENESS
0
$0
18
$292,661
36
$352,788
0
$0
2
$245,450
5
$325,992
Aggregated Statistics For Year 2006 (Based on 8 full and 2 partial tracts)
A) FHA, FSA/RHS & VA Home Purchase Loans
B) Conventional Home Purchase Loans
C) Refinancings
D) Home Improvement Loans
E) Loans on Dwellings For 5+ Families
F) Non-occupant Loans on < 5 Family Dwellings (A B C & D)
G) Loans On Manufactured Home Dwelling (A B C & D)
Number
Average Value
Number
Average Value
Number
Average Value
Number
Average Value
Number
Average Value
Number
Average Value
Number
Average Value
LOANS ORIGINATED
0
$0
824
$249,522
580
$279,256
91
$166,991
38
$846,395
208
$332,198
4
$31,930
APPLICATIONS APPROVED, NOT ACCEPTED
2
$287,765
105
$259,838
111
$297,111
15
$108,037
6
$1,626,900
26
$366,938
0
$0
APPLICATIONS DENIED
0
$0
91
$269,981
316
$324,559
38
$133,380
0
$0
83
$410,475
6
$21,608
APPLICATIONS WITHDRAWN
0
$0
86
$237,130
163
$309,119
10
$527,694
1
$1,580,330
29
$433,116
3
$206,123
FILES CLOSED FOR INCOMPLETENESS
0
$0
8
$281,238
55
$372,222
4
$96,605
0
$0
4
$290,680
0
$0
Aggregated Statistics For Year 2005 (Based on 8 full and 2 partial tracts)
B) Conventional Home Purchase Loans
C) Refinancings
D) Home Improvement Loans
E) Loans on Dwellings For 5+ Families
F) Non-occupant Loans on < 5 Family Dwellings (A B C & D)
G) Loans On Manufactured Home Dwelling (A B C & D)
Number
Average Value
Number
Average Value
Number
Average Value
Number
Average Value
Number
Average Value
Number
Average Value
LOANS ORIGINATED
928
$279,645
793
$287,140
76
$173,520
23
$895,376
283
$364,651
0
$0
APPLICATIONS APPROVED, NOT ACCEPTED
96
$270,780
87
$329,238
9
$139,602
4
$269,652
30
$376,066
0
$0
APPLICATIONS DENIED
196
$287,744
246
$339,317
58
$180,487
0
$0
92
$335,910
1
$364,690
APPLICATIONS WITHDRAWN
144
$275,494
216
$295,342
12
$298,410
4
$1,602,332
44
$390,640
0
$0
FILES CLOSED FOR INCOMPLETENESS
47
$368,779
55
$334,949
0
$0
0
$0
23
$374,595
1
$463,610
Aggregated Statistics For Year 2004 (Based on 8 full and 2 partial tracts)
A) FHA, FSA/RHS & VA Home Purchase Loans
B) Conventional Home Purchase Loans
C) Refinancings
D) Home Improvement Loans
E) Loans on Dwellings For 5+ Families
F) Non-occupant Loans on < 5 Family Dwellings (A B C & D)
Number
Average Value
Number
Average Value
Number
Average Value
Number
Average Value
Number
Average Value
Number
Average Value
LOANS ORIGINATED
0
$0
758
$288,993
827
$277,929
75
$146,993
21
$758,999
279
$326,340
APPLICATIONS APPROVED, NOT ACCEPTED
0
$0
62
$283,997
114
$255,908
13
$69,268
0
$0
26
$306,869
APPLICATIONS DENIED
1
$357,540
88
$296,195
242
$308,579
44
$138,364
1
$825,920
55
$342,931
APPLICATIONS WITHDRAWN
0
$0
90
$295,594
191
$283,494
28
$190,635
6
$1,036,127
38
$324,837
FILES CLOSED FOR INCOMPLETENESS
0
$0
24
$276,161
43
$313,127
2
$285,780
2
$332,605
0
$0
Aggregated Statistics For Year 2003 (Based on 8 full and 2 partial tracts)
A) FHA, FSA/RHS & VA Home Purchase Loans
B) Conventional Home Purchase Loans
C) Refinancings
D) Home Improvement Loans
E) Loans on Dwellings For 5+ Families
F) Non-occupant Loans on < 5 Family Dwellings (A B C & D)
Number
Average Value
Number
Average Value
Number
Average Value
Number
Average Value
Number
Average Value
Number
Average Value
LOANS ORIGINATED
0
$0
530
$287,463
2,042
$236,235
34
$77,231
38
$1,895,207
446
$298,692
APPLICATIONS APPROVED, NOT ACCEPTED
0
$0
42
$286,196
199
$221,958
12
$55,437
11
$735,924
30
$187,887
APPLICATIONS DENIED
2
$323,010
97
$332,090
325
$267,318
13
$133,931
2
$2,047,115
71
$335,210
APPLICATIONS WITHDRAWN
0
$0
70
$315,358
257
$235,234
2
$148,975
2
$197,760
38
$305,099
FILES CLOSED FOR INCOMPLETENESS
0
$0
10
$344,491
28
$224,798
2
$60,820
4
$383,525
8
$275,764
Aggregated Statistics For Year 2002 (Based on 8 full and 2 partial tracts)
A) FHA, FSA/RHS & VA Home Purchase Loans
B) Conventional Home Purchase Loans
C) Refinancings
D) Home Improvement Loans
E) Loans on Dwellings For 5+ Families
F) Non-occupant Loans on < 5 Family Dwellings (A B C & D)
Number
Average Value
Number
Average Value
Number
Average Value
Number
Average Value
Number
Average Value
Number
Average Value
LOANS ORIGINATED
2
$130,985
529
$251,722
1,415
$223,517
72
$63,044
24
$777,104
322
$278,159
APPLICATIONS APPROVED, NOT ACCEPTED
0
$0
54
$246,790
154
$218,004
22
$56,412
0
$0
21
$224,131
APPLICATIONS DENIED
2
$220,470
49
$302,105
223
$226,099
50
$71,554
4
$402,065
41
$304,386
APPLICATIONS WITHDRAWN
0
$0
46
$256,261
169
$224,952
10
$123,512
4
$734,302
25
$268,037
FILES CLOSED FOR INCOMPLETENESS
0
$0
10
$184,088
48
$213,367
0
$0
0
$0
11
$242,390
Aggregated Statistics For Year 2001 (Based on 8 full and 2 partial tracts)
A) FHA, FSA/RHS & VA Home Purchase Loans
B) Conventional Home Purchase Loans
C) Refinancings
D) Home Improvement Loans
E) Loans on Dwellings For 5+ Families
F) Non-occupant Loans on < 5 Family Dwellings (A B C & D)
Number
Average Value
Number
Average Value
Number
Average Value
Number
Average Value
Number
Average Value
Number
Average Value
LOANS ORIGINATED
5
$285,620
413
$240,881
1,007
$215,940
41
$105,748
26
$961,265
220
$286,053
APPLICATIONS APPROVED, NOT ACCEPTED
0
$0
40
$198,103
95
$204,025
22
$42,616
2
$392,720
19
$251,709
APPLICATIONS DENIED
6
$282,148
44
$245,365
202
$174,806
54
$62,670
5
$328,702
38
$219,262
APPLICATIONS WITHDRAWN
3
$285,173
26
$291,590
160
$179,902
17
$50,285
6
$2,393,105
24
$235,403
FILES CLOSED FOR INCOMPLETENESS
0
$0
6
$121,722
31
$231,941
4
$45,652
0
$0
4
$265,472
Aggregated Statistics For Year 2000 (Based on 8 full and 2 partial tracts)
A) FHA, FSA/RHS & VA Home Purchase Loans
B) Conventional Home Purchase Loans
C) Refinancings
D) Home Improvement Loans
E) Loans on Dwellings For 5+ Families
F) Non-occupant Loans on < 5 Family Dwellings (A B C & D)
Number
Average Value
Number
Average Value
Number
Average Value
Number
Average Value
Number
Average Value
Number
Average Value
LOANS ORIGINATED
4
$203,598
454
$236,725
243
$186,621
65
$24,468
37
$778,478
125
$254,205
APPLICATIONS APPROVED, NOT ACCEPTED
0
$0
44
$209,111
42
$153,300
16
$36,259
0
$0
13
$223,869
APPLICATIONS DENIED
4
$192,768
68
$231,453
124
$166,325
60
$28,729
0
$0
29
$303,583
APPLICATIONS WITHDRAWN
2
$199,305
36
$196,092
99
$115,603
13
$27,882
4
$982,378
16
$212,358
FILES CLOSED FOR INCOMPLETENESS
0
$0
8
$229,509
22
$174,964
0
$0
0
$0
2
$239,560
Aggregated Statistics For Year 1999 (Based on 3 full and 3 partial tracts)
A) FHA, FSA/RHS & VA Home Purchase Loans
B) Conventional Home Purchase Loans
C) Refinancings
D) Home Improvement Loans
E) Loans on Dwellings For 5+ Families
F) Non-occupant Loans on < 5 Family Dwellings (A B C & D)
2002 - 2018 National Fire Incident Reporting System (NFIRS) incidents
Based on the data from the years 2002 - 2018 the average number of fires per year is 47. The highest number of fire incidents - 139 took place in 2016, and the least - 14 in 2012. The data has a growing trend.
When looking into fire subcategories, the most incidents belonged to: Structure Fires (68.0%), and Outside Fires (16.8%).
Fire incident types reported to NFIRS in Zip Code 02143


 Nearest zip codes: 02145, 02141, 02139, 02142, 02163, 02144.


 Based on the data from the years 2002 - 2018 the average number of fires per year is 47. The highest number of fire incidents - 139 took place in 2016, and the least - 14 in 2012. The data has a growing trend.
 When looking into fire subcategories, the most incidents belonged to: Structure Fires (68.0%), and Outside Fires (16.8%).