Estimated zip code population in 2022: 27,683 Zip code population in 2010: 25,439 Zip code population in 2000: 26,887
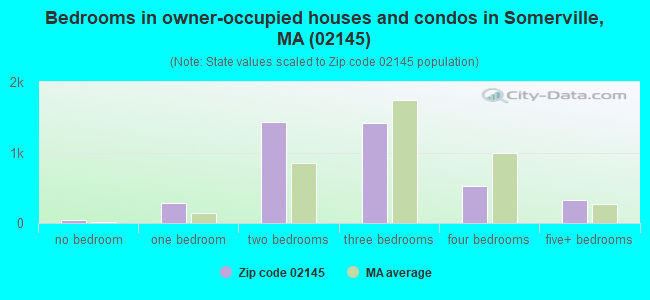
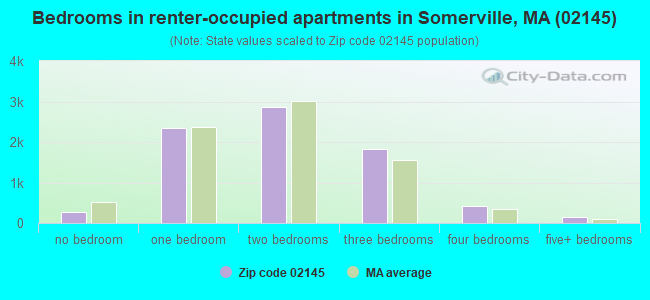
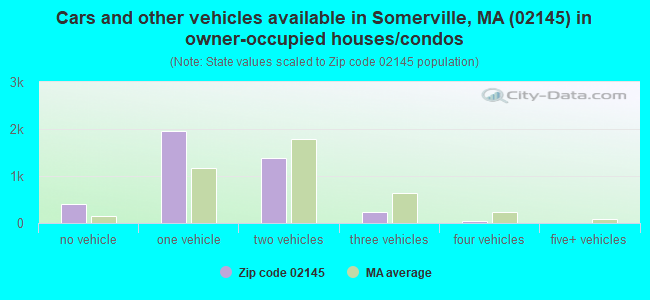
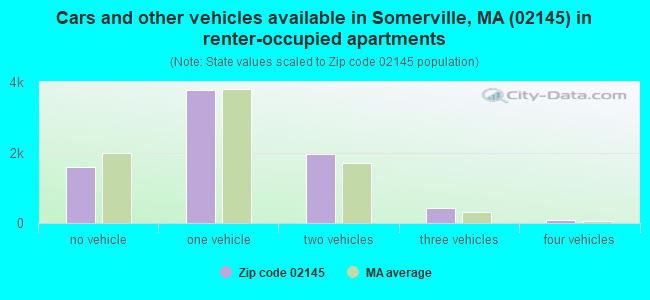
Houses and condos: 12,417 Renter-occupied apartments: 7,875
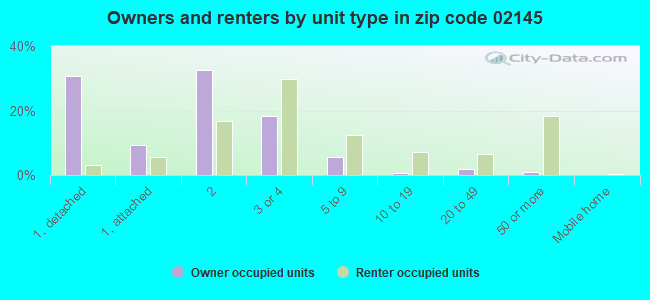
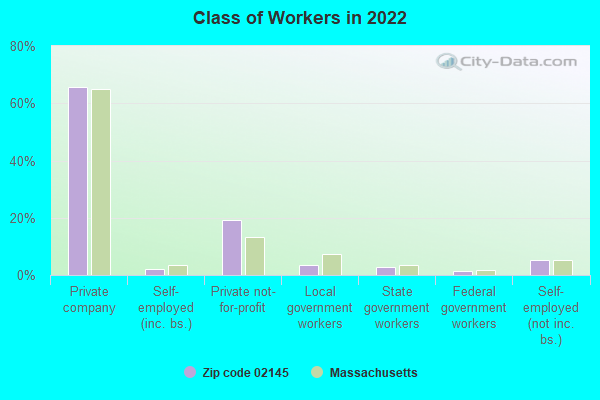
% of renters here:
66%
State:
38%
March 2022 cost of living index in zip code 02145: 138.7 (high, U.S. average is 100)
Land area: 1.4 sq. mi. Water area: 0.1 sq. mi.
Population density: 19,833 people per square mile
(very high).
OSM Map
Google Map
MSN Map
OSM Map
General Map
Google Map
MSN Map
OSM Map
Google Map
MSN Map
OSM Map
Google Map
MSN Map
Please wait while loading the map...
Real estate property taxes paid for housing units in 2022:
This zip code:
0.5% ($4,490)
Massachusetts:
1.0% ($5,536)
Median real estate property taxes paid for housing units with mortgages in 2022: $4,865 (0.6%) Median real estate property taxes paid for housing units with no mortgage in 2022: $3,864 (0.4%)
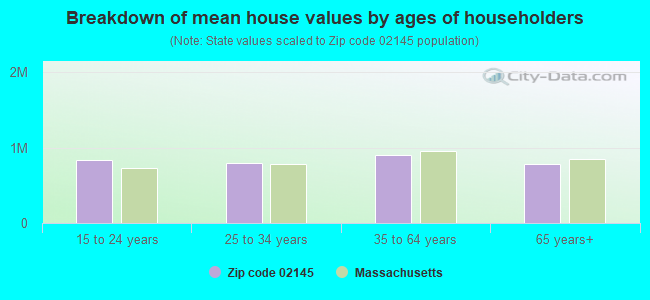
Estimated median house/condo value in 2022: $867,189
02145:
$867,189
Massachusetts:
$534,700
According to our research of Massachusetts and other state lists, there were 5 registered sex offenders living in 02145 zip code as of April 26, 2024. The ratio of all residents to sex offenders in zip code 02145 is 5,276 to 1. The ratio of registered sex offenders to all residents in this zip code is much lower than the state average.
Median resident age:
This zip code:
33.9 years
Massachusetts median age:
40.3 years
Average household size:
This zip code:
2.3 people
Massachusetts:
2.4 people
Averages for the 2020 tax year for zip code 02145, filed in 2021:
Average Adjusted Gross Income (AGI) in 2020: $77,339 (Individual Income Tax Returns)
Here:
$77,339
State:
$105,130
Salary/wage: $72,856 (reported on 87.9% of returns)
Here:
$72,856
State:
$82,951
(% of AGI for various income ranges: 1312.1% for AGIs below $25k, 3964.9% for AGIs $25k-50k, 7118.0% for AGIs $50k-75k, 11455.7% for AGIs $75k-100k, 20985.8% for AGIs $100k-200k, 97757.9% for AGIs over 200k)
Taxable interest for individuals: $1,020 (reported on 32.2% of returns)
This zip code:
$1,020
Massachusetts:
$2,361
(% of AGI for various income ranges: 16.1% for AGIs below $25k, 14.6% for AGIs $25k-50k, 24.1% for AGIs $50k-75k, 41.7% for AGIs $75k-100k, 94.1% for AGIs $100k-200k, 696.9% for AGIs over 200k)
Ordinary dividends: $4,042 (reported on 22.1% of returns)
Here:
$4,042
State:
$10,365
(% of AGI for various income ranges: 16.7% for AGIs below $25k, 20.7% for AGIs $25k-50k, 42.2% for AGIs $50k-75k, 91.5% for AGIs $75k-100k, 213.5% for AGIs $100k-200k, 2728.3% for AGIs over 200k)
Net capital gain/loss in AGI: +$13,633 (reported on 20.8% of returns)
Here:
+$13,633
State:
+$48,178
(% of AGI for various income ranges: 12.6% for AGIs below $25k, 18.7% for AGIs $25k-50k, 43.9% for AGIs $50k-75k, 127.4% for AGIs $75k-100k, 515.0% for AGIs $100k-200k, 11461.0% for AGIs over 200k)
Profit/loss from business: +$12,771 (reported on 15.6% of returns)
Here:
+$12,771
State:
+$20,792
(% of AGI for various income ranges: 216.4% for AGIs below $25k, 191.8% for AGIs $25k-50k, 183.0% for AGIs $50k-75k, 253.2% for AGIs $75k-100k, 458.2% for AGIs $100k-200k, 2452.1% for AGIs over 200k)
Taxable individual retirement arrangement distribution: $15,957 (reported on 3.7% of returns)
02145:
$15,957
Massachusetts:
$22,790
(% of AGI for various income ranges: 25.1% for AGIs below $25k, 36.1% for AGIs $25k-50k, 58.3% for AGIs $50k-75k, 76.6% for AGIs $75k-100k, 161.9% for AGIs $100k-200k, 1107.9% for AGIs over 200k)
Self-employed (Keogh) retirement plans: $18,714 (reported on 0.5% of returns)
02145:
$18,714
Massachusetts:
$26,868
(% of AGI for various income ranges: 26.4% for AGIs $75k-100k, 350.7% for AGIs over 200k)
Total itemized deductions: $27,919 (reported on 8.5% of returns)
Here:
$27,919
State:
$36,722
(% of AGI for various income ranges: 38.3% for AGIs below $25k, 41.1% for AGIs $25k-50k, 111.2% for AGIs $50k-75k, 256.9% for AGIs $75k-100k, 991.9% for AGIs $100k-200k, 5559.3% for AGIs over 200k)
Charity contributions: $5,431 (reported on 6.2% of returns)
Here:
$5,431
State:
$12,529
(% of AGI for various income ranges: 1.5% for AGIs below $25k, 3.8% for AGIs $25k-50k, 13.4% for AGIs $50k-75k, 33.2% for AGIs $75k-100k, 93.8% for AGIs $100k-200k, 1064.8% for AGIs over 200k)
Taxes paid: $8,505 (reported on 8.5% of returns)
02145:
$8,505
State:
$8,782
(% of AGI for various income ranges: 7.2% for AGIs below $25k, 9.2% for AGIs $25k-50k, 33.5% for AGIs $50k-75k, 81.8% for AGIs $75k-100k, 334.8% for AGIs $100k-200k, 1612.8% for AGIs over 200k)
Earned income credit: $1,712 (reported on 8.8% of returns)
Here:
$1,712
State:
$1,909
(% of AGI for various income ranges: 60.1% for AGIs below $25k, 31.0% for AGIs $25k-50k)
Percentage of individuals using paid preparers for their 2020 taxes: 91.8%
Here:
92%
State:
92%
(% for various income ranges: 86.1% for AGIs below $25k, 91.9% for AGIs $25k-50k, 93.8% for AGIs $50k-75k, 94.6% for AGIs $75k-100k, 94.5% for AGIs $100k-200k, 96.9% for AGIs over 200k)
Averages for the 2012 tax year for zip code 02145, filed in 2013:
Average Adjusted Gross Income (AGI) in 2012: $45,057 (Individual Income Tax Returns)
Here:
$45,057
State:
$81,425
Salary/wage: $43,510 (reported on 88.5% of returns)
Here:
$43,510
State:
$64,752
(% of AGI for various income ranges: 79.8% for AGIs below $25k, 88.8% for AGIs $25k-50k, 89.6% for AGIs $50k-75k, 89.8% for AGIs $75k-100k, 86.9% for AGIs $100k-200k, 63.0% for AGIs over 200k)
Taxable interest for individuals: $692 (reported on 29.5% of returns)
This zip code:
$692
Massachusetts:
$2,136
(% of AGI for various income ranges: 0.5% for AGIs below $25k, 0.3% for AGIs $25k-50k, 0.4% for AGIs $50k-75k, 0.4% for AGIs $75k-100k, 0.4% for AGIs $100k-200k, 1.0% for AGIs over 200k)
Ordinary dividends: $2,288 (reported on 13.1% of returns)
Here:
$2,288
State:
$9,473
(% of AGI for various income ranges: 0.7% for AGIs below $25k, 0.4% for AGIs $25k-50k, 0.4% for AGIs $50k-75k, 0.6% for AGIs $75k-100k, 0.8% for AGIs $100k-200k, 1.8% for AGIs over 200k)
Net capital gain/loss in AGI: +$3,971 (reported on 9.6% of returns)
Here:
+$3,971
State:
+$31,437
(% of AGI for various income ranges: 0.2% for AGIs $25k-50k, 0.2% for AGIs $50k-75k, 0.6% for AGIs $75k-100k, 1.8% for AGIs $100k-200k, 3.7% for AGIs over 200k)
Profit/loss from business: +$13,218 (reported on 14.9% of returns)
Here:
+$13,218
State:
+$20,662
(% of AGI for various income ranges: 11.8% for AGIs below $25k, 4.2% for AGIs $25k-50k, 2.4% for AGIs $50k-75k, 2.4% for AGIs $75k-100k, 2.9% for AGIs $100k-200k, 6.5% for AGIs over 200k)
Taxable individual retirement arrangement distribution: $10,374 (reported on 4.2% of returns)
02145:
$10,374
Massachusetts:
$18,892
(% of AGI for various income ranges: 1.3% for AGIs below $25k, 0.9% for AGIs $25k-50k, 0.8% for AGIs $50k-75k, 1.2% for AGIs $75k-100k, 1.3% for AGIs $100k-200k)
Self-employment retirement plans: $14,350 (reported on 0.3% of returns)
02145:
$14,350
Massachusetts:
$20,669
Total itemized deductions: $17,717 (20% of AGI, reported on 19.9% of returns)
Here:
$17,717
State:
$28,907
Here:
19.6% of AGI
State:
18.2% of AGI
(% of AGI for various income ranges: 4.7% for AGIs below $25k, 5.1% for AGIs $25k-50k, 7.8% for AGIs $50k-75k, 8.9% for AGIs $75k-100k, 11.4% for AGIs $100k-200k, 10.1% for AGIs over 200k)
Charity contributions: $1,953 (reported on 14.5% of returns)
Here:
$1,953
State:
$4,208
(% of AGI for various income ranges: 0.2% for AGIs below $25k, 0.4% for AGIs $25k-50k, 0.5% for AGIs $50k-75k, 0.6% for AGIs $75k-100k, 0.9% for AGIs $100k-200k, 1.2% for AGIs over 200k)
Taxes paid: $6,650 (reported on 19.9% of returns)
02145:
$6,650
State:
$13,303
(% of AGI for various income ranges: 0.9% for AGIs below $25k, 1.3% for AGIs $25k-50k, 2.4% for AGIs $50k-75k, 3.4% for AGIs $75k-100k, 5.0% for AGIs $100k-200k, 6.0% for AGIs over 200k)
Earned income credit: $1,918 (reported on 14.9% of returns)
Here:
$1,918
State:
$1,971
(% of AGI for various income ranges: 4.3% for AGIs below $25k, 0.6% for AGIs $25k-50k)
Percentage of individuals using paid preparers for their 2012 taxes: 51.4%
Here:
51%
State:
56%
(% for various income ranges: 52.6% for AGIs below $25k, 49.4% for AGIs $25k-50k, 49.8% for AGIs $50k-75k, 53.0% for AGIs $75k-100k, 53.7% for AGIs $100k-200k, 60.0% for AGIs over 200k)
Averages for the 2004 tax year for zip code 02145, filed in 2005:
Average Adjusted Gross Income (AGI) in 2004: $35,254 (Individual Income Tax Returns)
Here:
$35,254
State:
$62,877
Salary/wage: $35,004 (reported on 87.1% of returns)
Here:
$35,004
State:
$52,969
(% of AGI for various income ranges: 89.3% for AGIs below $10k, 83.7% for AGIs $10k-25k, 91.3% for AGIs $25k-50k, 89.9% for AGIs $50k-75k, 90.7% for AGIs $75k-100k, 71.5% for AGIs over 100k)
Taxable interest for individuals: $1,065 (reported on 38.4% of returns)
This zip code:
$1,065
Massachusetts:
$1,945
(% of AGI for various income ranges: 3.2% for AGIs below $10k, 1.4% for AGIs $10k-25k, 0.8% for AGIs $25k-50k, 0.9% for AGIs $50k-75k, 0.8% for AGIs $75k-100k, 2.0% for AGIs over 100k)
Taxable dividends: $1,408 (reported on 14.0% of returns)
Here:
$1,408
State:
$5,323
(% of AGI for various income ranges: 1.2% for AGIs below $10k, 0.4% for AGIs $10k-25k, 0.3% for AGIs $25k-50k, 0.5% for AGIs $50k-75k, 0.4% for AGIs $75k-100k, 1.3% for AGIs over 100k)
Net capital gain/loss: +$7,694 (reported on 10.4% of returns)
Here:
+$7,694
State:
+$20,377
(% of AGI for various income ranges: -0.1% for AGIs below $10k, 0.2% for AGIs $10k-25k, 0.3% for AGIs $25k-50k, 0.5% for AGIs $50k-75k, 0.9% for AGIs $75k-100k, 11.3% for AGIs over 100k)
Profit/loss from business: +$9,393 (reported on 13.3% of returns)
Here:
+$9,393
State:
+$17,837
(% of AGI for various income ranges: 17.1% for AGIs below $10k, 7.6% for AGIs $10k-25k, 2.9% for AGIs $25k-50k, 1.9% for AGIs $50k-75k, 2.2% for AGIs $75k-100k, 2.9% for AGIs over 100k)
IRA payment deduction: $2,964 (reported on 1.8% of returns)
02145:
$2,964
Massachusetts:
$3,100
(% of AGI for various income ranges: 0.3% for AGIs below $10k, 0.2% for AGIs $10k-25k, 0.2% for AGIs $25k-50k, 0.2% for AGIs $50k-75k, 0.1% for AGIs $75k-100k, 0.1% for AGIs over 100k)
Self-employed pension: $9,489 (reported on 0.4% of returns)
Here:
$9,489
Massachusetts:
$14,516
Total itemized deductions: $15,623 (25% of AGI, reported on 22.1% of returns)
Here:
$15,623
State:
$22,573
Here:
24.5% of AGI
State:
19.5% of AGI
(% of AGI for various income ranges: 13.9% for AGIs below $10k, 8.6% for AGIs $10k-25k, 7.6% for AGIs $25k-50k, 9.8% for AGIs $50k-75k, 11.8% for AGIs $75k-100k, 12.9% for AGIs over 100k)
Charity contributions deductions: $1,668 (2% of AGI, reported on 17.7% of returns)
Here:
$1,668
State:
$3,295
Here:
2.4% of AGI
State:
2.7% of AGI
(% of AGI for various income ranges: 0.4% for AGIs below $10k, 0.6% for AGIs $10k-25k, 0.7% for AGIs $25k-50k, 0.9% for AGIs $50k-75k, 1.0% for AGIs $75k-100k, 1.1% for AGIs over 100k)
Total tax: $4,753 (reported on 77.7% of returns)
02145:
$4,753
State:
$11,494
(% of AGI for various income ranges: 3.4% for AGIs below $10k, 5.0% for AGIs $10k-25k, 8.4% for AGIs $25k-50k, 11.1% for AGIs $50k-75k, 12.5% for AGIs $75k-100k, 17.5% for AGIs over 100k)
Earned income credit: $1,439 (reported on 13.8% of returns)
Here:
$1,439
State:
$1,518
Percentage of individuals using paid preparers for their 2004 taxes: 54.8%
Here:
55%
State:
58%
(% for various income ranges: 49.7% for AGIs below $10k, 58.3% for AGIs $10k-25k, 52.8% for AGIs $25k-50k, 56.9% for AGIs $50k-75k, 58.1% for AGIs $75k-100k, 61.9% for AGIs over 100k)
Likely homosexual households (counted as self-reported same-sex unmarried-partner households)
Lesbian couples: 0.0% of all households
Gay men: 0.3% of all households
Household received Food Stamps/SNAP in the past 12 months: 1,435 Household did not receive Food Stamps/SNAP in the past 12 months: 10,339
Women who had a birth in the past 12 months: 376 (346 now married, 40 unmarried) Women who did not have a birth in the past 12 months: 8,020 (2,342 now married, 5,715 unmarried)
Housing units in zip code 02145 with a mortgage: 2,662 (457 second mortgage, 23 home equity loan, 374 both second mortgage and home equity loan) Houses without a mortgage: 59
Median monthly owner costs for units with a mortgage: $2,930 Median monthly owner costs for units without a mortgage: $848
Residents with income below the poverty level in 2022:
This zip code:
10.7%
Whole state:
10.4%
Residents with income below 50% of the poverty level in 2022:
This zip code:
5.6%
Whole state:
5.1%
Median number of rooms in houses and condos:
Here:
5.9
State:
6.5
Median number of rooms in apartments:
Here:
4.1
State:
4.0
Notable locations in this zip code not listed on our city pages
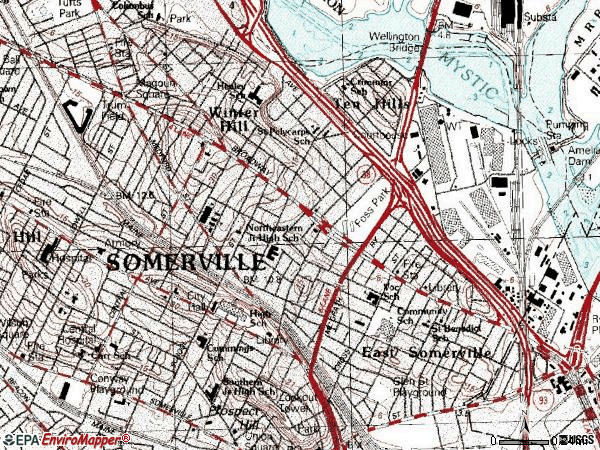
Notable locations in zip code 02145: Trum Field (A), Innerbelt Industrial Park (B), Somerville Fire Department Station 1 Headquarters (C), Saint Ann's Rectory (D), East Somerville Branch Public Library of the City of Somerville (E), Middlesex County District Court of Somerville (F). Display/hide their locations on the map
Churches in zip code 02145 include: Temple Bnai Brith (A), Full Gospel Restoration Church (B), Evangelical-Haitian Church (C), Christ Episcopal Church (D), Broadway Winter Hill Congregational Church (E), Assembly of God in Boston (F), Hebrew Temple (G). Display/hide their locations on the map
Parks in zip code 02145 include: Foss Park (1), Paul Revere Park (2), Glen Street Playground (3), Mount Vernon Street Historic District (4), Hoyt Sullivan Playground (5). Display/hide their locations on the map
2,110 married couples with children.
929 single-parent households (122 men, 807 women).
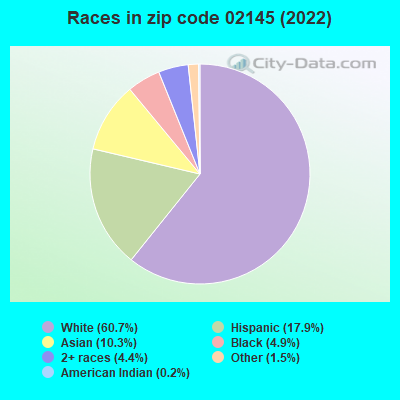
58.3% of residents of 02145 zip code speak English at home.
15.9% of residents speak Spanish at home (48% very well, 18% well, 21% not well, 13% not at all).
19.2% of residents speak other Indo-European language at home (54% very well, 19% well, 18% not well, 9% not at all).
4.7% of residents speak Asian or Pacific Island language at home (63% very well, 18% well, 12% not well, 7% not at all).
1.7% of residents speak other language at home (74% very well, 16% well, 11% not well).
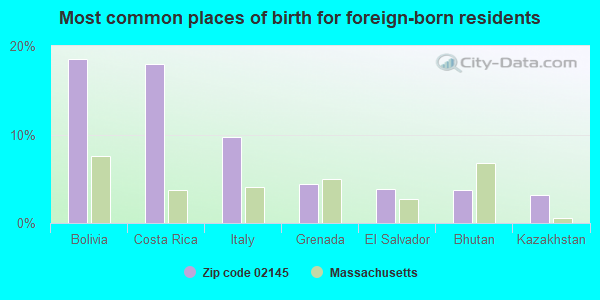
Foreign born population: 9,089 (32.8%) (43.5% of them are naturalized citizens)
Major facilities with environmental interests located in this zip code:
BOWIES RAY SERVICE STATION INC (258 BROADWAY in SOMERVILLE, MA)
STATE MASTER (MA-EPICS) - RCRAINFO-MAD084210137, HAZARDOUS WASTE PROGRAM (Resource Conservation and Recovery Act (tracking hazardous waste)) Organizations: SUNOCO INC (CONTACT/OPERATOR)
, SUN OIL CO OF PENN (CONTACT/OWNER)
, RAYMOND & GRACE BOWIE (CONTACT/OWNER)
Alternative names: SUNOCO SERVICE STA
PACKAGEMASTERS INC (61 CLYDE STREET in SOMERVILLE, MA)
AIR MINOR (AIRS/AFS) (Resource Conservation and Recovery Act (tracking hazardous waste)) TRI REPORTER (Tracking of toxic chemicals releasing facilities) Alternative names: CLYDE SAINT SERVICES, CLYDE STREET SERVICE, FLEXIBLE PACKAGING LIMITED PARTNERSHIP FORMERLY CLYDE ST. SERVICES, LINVURE CO. INC., MAX PAK IND, MAX PAX INDUSTRIES
ARTHUR D HEALEY (5 MEACHAM STREET in SOMERVILLE, MA)
(National Center for Education Statistics) - STATE ID-274075 Organizations: SOMERVILLE (SCHOOL DISTRICT)
CAMBRIDGE MACHINED P (100 FOLEY ST in SOMERVILLE, MA)
AIR MINOR (AIRS/AFS) (Resource Conservation and Recovery Act (tracking hazardous waste)) Business SIC classification: SCREW MACHINE PRODUCTS Organizations: FISHER WILLIAM B JR (CONTACT/OWNER)
Alternative names: CAMBRIDGE MACHINED PRODUCTS CORP
E SOMERVILLE COMMUNITY (115 PEARL STREET in SOMERVILLE, MA)
(National Center for Education Statistics) - STATE ID-274111
EDGERLY (8 BONAIR STREET in SOMERVILLE, MA)
(National Center for Education Statistics) - STATE ID-274005 Organizations: SOMERVILLE (SCHOOL DISTRICT)
ELECTRO SALES CO INC (100 FELLSWAY WEST in SOMERVILLE, MA)
COMPLIANCE ACTIVITY (Tracking inspections of insecticide, fungicide, and rodenticide, and toxic substances) (Resource Conservation and Recovery Act (tracking hazardous waste))
MDC AMELIA EARHART DAM (200 FOLEY STREET in SOMERVILLE, MA)
AIR MINOR (AIRS/AFS) AIR SYNTHETIC MINOR (AIRS/AFS) CRITERIA AND HAZARDOUS AIR POLLUTANT INVENTORY (Inventory of air pollution sources) Business SIC classification: AIR AND WATER RESOURCE AND SOLID WASTE MANAGEMENT; NONCLASSIFIABLE ESTABLISHMENTS Alternative names: MDC CHARLES RIVER DA, MYSTIC RIVER DAM PUM
JOHN J DANAIS COMPANY INCORPORATED (50 TUFTS STREET in SOMERVILLE, MA)
AIR MINOR (AIRS/AFS) CRITERIA AND HAZARDOUS AIR POLLUTANT INVENTORY (Inventory of air pollution sources) TRI REPORTER (Tracking of toxic chemicals releasing facilities) Business SIC classification: SOAP AND OTHER DETERGENTS, EXCEPT SPECIALTY CLEANERS; CHEMICALS AND ALLIED PRODUCTS Alternative names: JOHN DANAIS CO. INC.
BOBS AUTO BODY (14 MARSHALL ST in SOMERVILLE, MA)
(Resource Conservation and Recovery Act (tracking hazardous waste))
BURRELLS EXPRESS INC (852 MCGRATH HWY in SOMERVILLE, MA)
CAMBRIDGE PRESS INCORPORATED (11 BLAKLEY AVE. in SOMERVILLE, MA)
AIR MINOR (AIRS/AFS) CRITERIA AND HAZARDOUS AIR POLLUTANT INVENTORY (Inventory of air pollution sources) Business SIC classification: MISCELLANEOUS STRUCTURAL METALWORK
MCGRATH AUTO BODY INC (42 DANA ST in SOMERVILLE, MA)
(Resource Conservation and Recovery Act (tracking hazardous waste))
Housing units lacking complete plumbing facilities: 0.3% Housing units lacking complete kitchen facilities: 1.5%
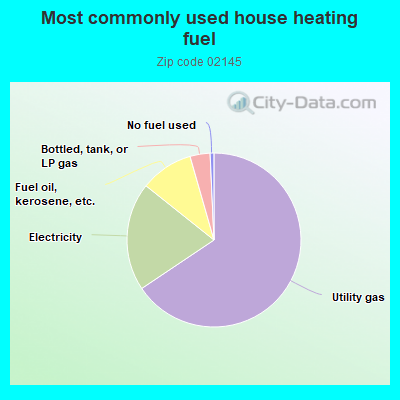
65.2%Utility gas
20.0%Electricity
9.8%Fuel oil, kerosene, etc.
3.7%Bottled, tank, or LP gas
0.7%No fuel used
Population in 1990: 24,422. Population change in the 1990s: +2,465 (+10.1%).
Place of birth for U.S.-born residents:
This state: 11,227
Northeast: 3,609
Midwest: 1,107
South: 1,372
West: 1,025
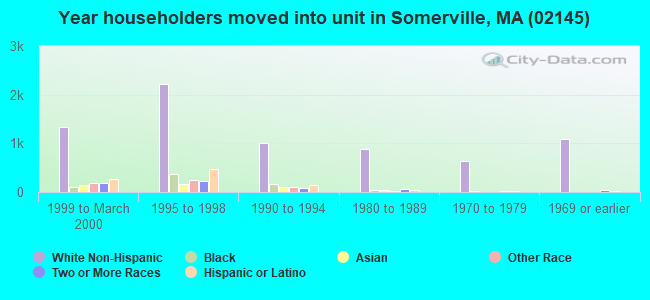
57% of the 02145 zip code residents lived in the same house 5 years ago. Out of people who lived in different houses, 61% lived in this county. Out of people who lived in different counties, 50% lived in Massachusetts.
84% of the 02145 zip code residents lived in the same house 1 year ago. Out of people who lived in different houses, 46% moved from this county. Out of people who lived in different houses, 27% moved from different county within same state. Out of people who lived in different houses, 17% moved from different state. Out of people who lived in different houses, 9% moved from abroad.
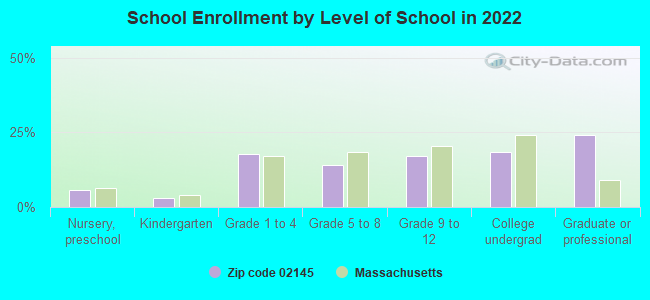
Private vs. public school enrollment:
Students in private schools in grades 1 to 8 (elementary and middle school): 67
Here:
4.3%
Massachusetts:
10.3%
Students in private schools in grades 9 to 12 (high school): 115
Here:
13.7%
Massachusetts:
12.3%
Students in private undergraduate colleges: 405
Here:
44.3%
Massachusetts:
51.2%
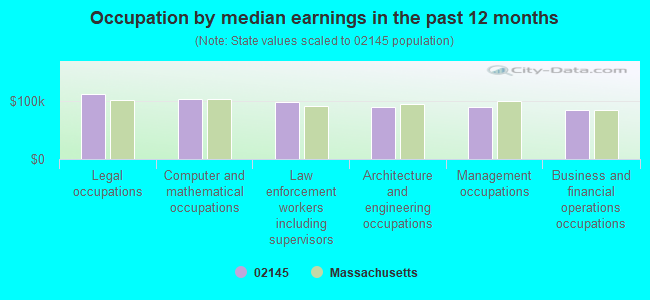
Occupation by median earnings in the past 12 months ($)
113,318Legal occupations
103,317Computer and mathematical occupations
98,365Law enforcement workers including supervisors
89,707Architecture and engineering occupations
89,503Management occupations
85,575Business and financial operations occupations
Companies with federal contracts located in this zip code (SOMERVILLE, MA):
TRACER TECHNOLOGIES INC (20 ASSEMBLY SQUARE DR; small business) : $9,544,247 in 14 contractsfrom 2001 to 2005
Contracts for Underwater Mine Inert Components, Batteries, Nonrechargeable, Underwater Mine Explosive Components, Other Defense -- Operational Systems Development (R&D), and moreby Navy Signed by year:2000: $0; 2001: $1,252,330; 2002: $1,556,610; 2003: $3,304,445; 2004: $1,623,750; 2005: $1,807,112; 2006: $0.
Biggest contracts:
$1,488,000 with Navy for Underwater Mine Inert Components. Signed on 2002-05-07. Completion date: 2004-01-19.
$1,478,000 with Navy for Batteries, Nonrechargeable. Signed on 2005-01-13. Completion date: 2007-03-05.
$1,448,800, same as above.Signed on 2003-10-22. Completion date: 2004-10-08.
$1,357,825, same as above.Signed on 2003-01-15. Completion date: 2004-11-22.
ROGERS FOAM CORPORATION (20 VERNON ST STE 1; small business) : $12,310 in 2 contractsfrom 2004 to 2005
$12,166 with Army for Miscellaneous Items. Signed on 2004-09-14. Completion date: 2004-09-30.
$144 with Army for Miscellaneous Items. Taking place in MS. Signed on 2005-08-09. Completion date: 2005-08-31.
GRAYBAR ELECTRIC COMPANY, INC (34 STURTEVANT ST)
$4,595 with Navy for Telephone and Telegraph Equipment. Signed on 2005-05-11. Completion date: 2005-05-31.
FIRST CLASS CLEANING COMPANY, (68 SYDNEY STREET; small business) : $4,272 in 5 contractsfrom 2001 to 2002
Contracts for Custodial Janitorial Services by Army Signed by year:2000: $0; 2001: $2,048; 2002: $2,224; 2003: $0; 2004: $0; 2005: $0; 2006: $0.
Biggest contracts:
$1,668 with Army for Custodial Janitorial Services. Signed on 2001-11-14. Completion date: 2001-12-14.
$1,390, same as above.Signed on 2002-01-16. Completion date: 2002-01-15.
$834, same as above.Signed on 2002-02-28. Completion date: 2002-02-02.
$380, same as above.Signed on 2001-10-25. Completion date: 2001-11-02.
Top industries in this zip code by the number of employees in 2005:
Professional, Scientific, and Technical Services: Computer Systems Design Services (100-249 employees: 1 establishment, 1-4 employees: 2 establishments)
2002 - 2018 National Fire Incident Reporting System (NFIRS) incidents
Based on the data from the years 2002 - 2018 the average number of fires per year is 66. The highest number of fire incidents - 195 took place in 2017, and the least - 13 in 2013. The data has a growing trend.
When looking into fire subcategories, the most incidents belonged to: Structure Fires (64.9%), and Outside Fires (17.3%).
Fire incident types reported to NFIRS in Zip Code 02145


 Nearest zip codes: 02143, 02141, 02129, 02142, 02139, 02144.


 Based on the data from the years 2002 - 2018 the average number of fires per year is 66. The highest number of fire incidents - 195 took place in 2017, and the least - 13 in 2013. The data has a growing trend.
 When looking into fire subcategories, the most incidents belonged to: Structure Fires (64.9%), and Outside Fires (17.3%).