Estimated zip code population in 2022: 20,902 Zip code population in 2010: 19,583 Zip code population in 2000: 19,623
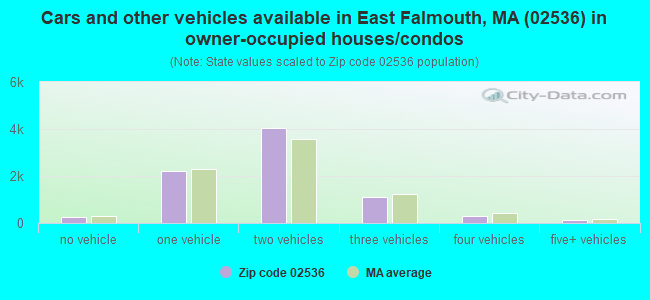
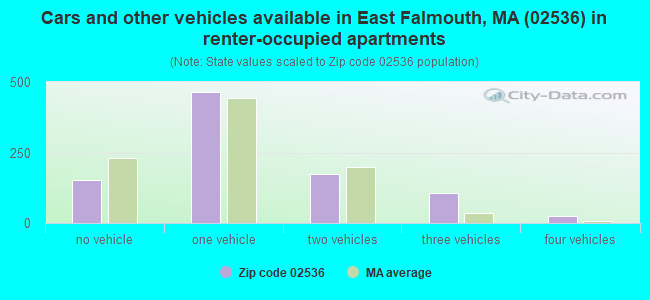
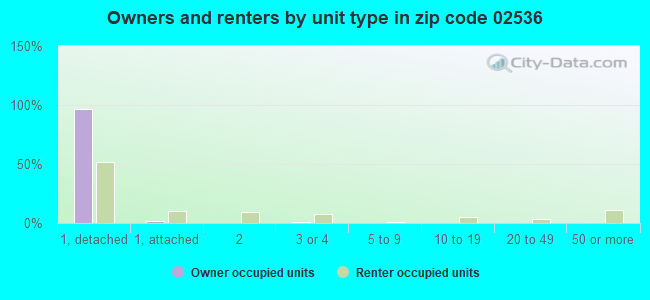
Houses and condos: 12,298 Renter-occupied apartments: 922
% of renters here:
10%
State:
38%
March 2022 cost of living index in zip code 02536: 117.3 (more than average, U.S. average is 100)
Land area: 27.7 sq. mi. Water area: 3.5 sq. mi.
Population density: 755 people per square mile
(low).
OSM Map
Google Map
MSN Map
OSM Map
General Map
Google Map
MSN Map
OSM Map
Google Map
MSN Map
OSM Map
Google Map
MSN Map
Please wait while loading the map...
Real estate property taxes paid for housing units in 2022:
This zip code:
0.6% ($2,967)
Massachusetts:
1.0% ($5,536)
Median real estate property taxes paid for housing units with mortgages in 2022: $2,920 (0.6%) Median real estate property taxes paid for housing units with no mortgage in 2022: $3,063 (0.6%)
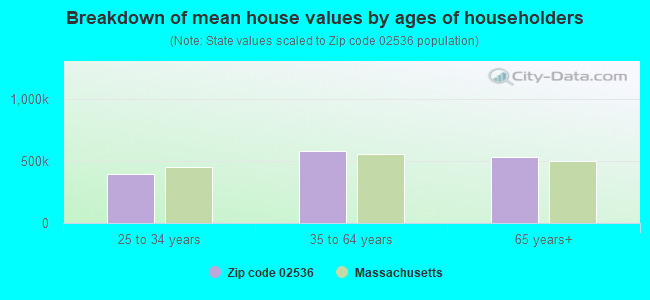
Estimated median house/condo value in 2022: $505,418
02536:
$505,418
Massachusetts:
$534,700
According to our research of Massachusetts and other state lists, there were 12 registered sex offenders living in 02536 zip code as of April 27, 2024. The ratio of all residents to sex offenders in zip code 02536 is 1,637 to 1. The ratio of registered sex offenders to all residents in this zip code is near the state average.
Median resident age:
This zip code:
55.2 years
Massachusetts median age:
40.3 years
Average household size:
This zip code:
2.3 people
Massachusetts:
2.4 people
Averages for the 2020 tax year for zip code 02536, filed in 2021:
Average Adjusted Gross Income (AGI) in 2020: $83,118 (Individual Income Tax Returns)
Here:
$83,118
State:
$105,130
Salary/wage: $64,144 (reported on 73.6% of returns)
Here:
$64,144
State:
$82,951
(% of AGI for various income ranges: 1121.2% for AGIs below $25k, 3443.6% for AGIs $25k-50k, 5934.5% for AGIs $50k-75k, 8630.4% for AGIs $75k-100k, 16470.7% for AGIs $100k-200k, 83789.0% for AGIs over 200k)
Taxable interest for individuals: $1,690 (reported on 42.1% of returns)
This zip code:
$1,690
Massachusetts:
$2,361
(% of AGI for various income ranges: 33.1% for AGIs below $25k, 30.3% for AGIs $25k-50k, 82.5% for AGIs $50k-75k, 122.3% for AGIs $75k-100k, 234.8% for AGIs $100k-200k, 1433.8% for AGIs over 200k)
Ordinary dividends: $8,061 (reported on 27.9% of returns)
Here:
$8,061
State:
$10,365
(% of AGI for various income ranges: 56.8% for AGIs below $25k, 71.8% for AGIs $25k-50k, 179.4% for AGIs $50k-75k, 307.7% for AGIs $75k-100k, 745.1% for AGIs $100k-200k, 5877.6% for AGIs over 200k)
Net capital gain/loss in AGI: +$22,851 (reported on 23.9% of returns)
Here:
+$22,851
State:
+$48,178
(% of AGI for various income ranges: 21.1% for AGIs below $25k, 46.7% for AGIs $25k-50k, 133.7% for AGIs $50k-75k, 394.2% for AGIs $75k-100k, 967.4% for AGIs $100k-200k, 23188.1% for AGIs over 200k)
Profit/loss from business: +$19,539 (reported on 17.6% of returns)
Here:
+$19,539
State:
+$20,792
(% of AGI for various income ranges: 182.8% for AGIs below $25k, 283.1% for AGIs $25k-50k, 381.0% for AGIs $50k-75k, 622.1% for AGIs $75k-100k, 1065.9% for AGIs $100k-200k, 5860.0% for AGIs over 200k)
Taxable individual retirement arrangement distribution: $26,245 (reported on 14.8% of returns)
02536:
$26,245
Massachusetts:
$22,790
(% of AGI for various income ranges: 97.5% for AGIs below $25k, 150.3% for AGIs $25k-50k, 406.1% for AGIs $50k-75k, 801.9% for AGIs $75k-100k, 1633.1% for AGIs $100k-200k, 6867.1% for AGIs over 200k)
Self-employed (Keogh) retirement plans: $20,067 (reported on 1.0% of returns)
02536:
$20,067
Massachusetts:
$26,868
(% of AGI for various income ranges: 21.6% for AGIs $50k-75k, 73.8% for AGIs $100k-200k, 687.6% for AGIs over 200k)
Total itemized deductions: $30,191 (reported on 11.9% of returns)
Here:
$30,191
State:
$36,722
(% of AGI for various income ranges: 116.2% for AGIs below $25k, 151.6% for AGIs $25k-50k, 491.7% for AGIs $50k-75k, 745.1% for AGIs $75k-100k, 1301.8% for AGIs $100k-200k, 6308.6% for AGIs over 200k)
Charity contributions: $6,360 (reported on 9.2% of returns)
Here:
$6,360
State:
$12,529
(% of AGI for various income ranges: 6.0% for AGIs below $25k, 8.4% for AGIs $25k-50k, 28.6% for AGIs $50k-75k, 67.8% for AGIs $75k-100k, 169.6% for AGIs $100k-200k, 1936.7% for AGIs over 200k)
Taxes paid: $7,852 (reported on 11.9% of returns)
02536:
$7,852
State:
$8,782
(% of AGI for various income ranges: 20.1% for AGIs below $25k, 31.8% for AGIs $25k-50k, 115.4% for AGIs $50k-75k, 214.0% for AGIs $75k-100k, 403.4% for AGIs $100k-200k, 1498.1% for AGIs over 200k)
Earned income credit: $1,725 (reported on 8.5% of returns)
Here:
$1,725
State:
$1,909
(% of AGI for various income ranges: 49.8% for AGIs below $25k, 41.4% for AGIs $25k-50k)
Percentage of individuals using paid preparers for their 2020 taxes: 90.7%
Here:
91%
State:
92%
(% for various income ranges: 87.2% for AGIs below $25k, 91.5% for AGIs $25k-50k, 92.3% for AGIs $50k-75k, 91.5% for AGIs $75k-100k, 92.5% for AGIs $100k-200k, 92.3% for AGIs over 200k)
Averages for the 2012 tax year for zip code 02536, filed in 2013:
Average Adjusted Gross Income (AGI) in 2012: $62,559 (Individual Income Tax Returns)
Here:
$62,559
State:
$81,425
Salary/wage: $49,606 (reported on 77.2% of returns)
Here:
$49,606
State:
$64,752
(% of AGI for various income ranges: 66.8% for AGIs below $25k, 67.3% for AGIs $25k-50k, 64.5% for AGIs $50k-75k, 66.0% for AGIs $75k-100k, 64.7% for AGIs $100k-200k, 48.0% for AGIs over 200k)
Taxable interest for individuals: $1,482 (reported on 42.7% of returns)
This zip code:
$1,482
Massachusetts:
$2,136
(% of AGI for various income ranges: 1.5% for AGIs below $25k, 1.1% for AGIs $25k-50k, 0.9% for AGIs $50k-75k, 0.7% for AGIs $75k-100k, 0.9% for AGIs $100k-200k, 1.2% for AGIs over 200k)
Ordinary dividends: $5,415 (reported on 27.9% of returns)
Here:
$5,415
State:
$9,473
(% of AGI for various income ranges: 3.1% for AGIs below $25k, 2.1% for AGIs $25k-50k, 1.9% for AGIs $50k-75k, 1.8% for AGIs $75k-100k, 2.6% for AGIs $100k-200k, 2.8% for AGIs over 200k)
Net capital gain/loss in AGI: +$11,870 (reported on 21.8% of returns)
Here:
+$11,870
State:
+$31,437
(% of AGI for various income ranges: 0.4% for AGIs $25k-50k, 0.3% for AGIs $50k-75k, 1.2% for AGIs $75k-100k, 2.5% for AGIs $100k-200k, 13.1% for AGIs over 200k)
Profit/loss from business: +$16,699 (reported on 17.4% of returns)
Here:
+$16,699
State:
+$20,662
(% of AGI for various income ranges: 9.6% for AGIs below $25k, 6.5% for AGIs $25k-50k, 4.5% for AGIs $50k-75k, 4.1% for AGIs $75k-100k, 4.0% for AGIs $100k-200k, 3.3% for AGIs over 200k)
Taxable individual retirement arrangement distribution: $17,145 (reported on 15.2% of returns)
02536:
$17,145
Massachusetts:
$18,892
(% of AGI for various income ranges: 4.3% for AGIs below $25k, 3.8% for AGIs $25k-50k, 3.8% for AGIs $50k-75k, 4.6% for AGIs $75k-100k, 4.8% for AGIs $100k-200k, 3.5% for AGIs over 200k)
Self-employment retirement plans: $15,264 (reported on 1.1% of returns)
02536:
$15,264
Massachusetts:
$20,669
(% of AGI for various income ranges: 0.3% for AGIs $50k-75k, 0.4% for AGIs $100k-200k, 0.5% for AGIs over 200k)
Total itemized deductions: $22,328 (21% of AGI, reported on 40.4% of returns)
Here:
$22,328
State:
$28,907
Here:
20.8% of AGI
State:
18.2% of AGI
(% of AGI for various income ranges: 17.3% for AGIs below $25k, 14.2% for AGIs $25k-50k, 15.1% for AGIs $50k-75k, 15.4% for AGIs $75k-100k, 16.1% for AGIs $100k-200k, 10.9% for AGIs over 200k)
Charity contributions: $2,294 (reported on 33.6% of returns)
Here:
$2,294
State:
$4,208
(% of AGI for various income ranges: 0.8% for AGIs below $25k, 1.0% for AGIs $25k-50k, 1.1% for AGIs $50k-75k, 1.1% for AGIs $75k-100k, 1.3% for AGIs $100k-200k, 1.6% for AGIs over 200k)
Taxes paid: $8,368 (reported on 40.3% of returns)
02536:
$8,368
State:
$13,303
(% of AGI for various income ranges: 3.5% for AGIs below $25k, 3.8% for AGIs $25k-50k, 4.9% for AGIs $50k-75k, 5.4% for AGIs $75k-100k, 6.5% for AGIs $100k-200k, 5.9% for AGIs over 200k)
Earned income credit: $1,890 (reported on 12.4% of returns)
Here:
$1,890
State:
$1,971
(% of AGI for various income ranges: 4.1% for AGIs below $25k, 0.7% for AGIs $25k-50k)
Percentage of individuals using paid preparers for their 2012 taxes: 54.1%
Here:
54%
State:
56%
(% for various income ranges: 47.0% for AGIs below $25k, 52.8% for AGIs $25k-50k, 58.8% for AGIs $50k-75k, 61.2% for AGIs $75k-100k, 58.7% for AGIs $100k-200k, 79.4% for AGIs over 200k)
Averages for the 2004 tax year for zip code 02536, filed in 2005:
Average Adjusted Gross Income (AGI) in 2004: $49,696 (Individual Income Tax Returns)
Here:
$49,696
State:
$62,877
Salary/wage: $40,712 (reported on 78.9% of returns)
Here:
$40,712
State:
$52,969
(% of AGI for various income ranges: 126.1% for AGIs below $10k, 64.8% for AGIs $10k-25k, 71.4% for AGIs $25k-50k, 69.2% for AGIs $50k-75k, 75.4% for AGIs $75k-100k, 52.3% for AGIs over 100k)
Taxable interest for individuals: $1,723 (reported on 56.1% of returns)
This zip code:
$1,723
Massachusetts:
$1,945
(% of AGI for various income ranges: 8.1% for AGIs below $10k, 3.3% for AGIs $10k-25k, 1.8% for AGIs $25k-50k, 1.6% for AGIs $50k-75k, 1.3% for AGIs $75k-100k, 2.0% for AGIs over 100k)
Taxable dividends: $3,369 (reported on 31.5% of returns)
Here:
$3,369
State:
$5,323
(% of AGI for various income ranges: 6.0% for AGIs below $10k, 2.4% for AGIs $10k-25k, 1.8% for AGIs $25k-50k, 2.0% for AGIs $50k-75k, 1.4% for AGIs $75k-100k, 2.5% for AGIs over 100k)
Net capital gain/loss: +$14,317 (reported on 24.7% of returns)
Here:
+$14,317
State:
+$20,377
(% of AGI for various income ranges: -2.9% for AGIs below $10k, 0.2% for AGIs $10k-25k, 0.7% for AGIs $25k-50k, 1.1% for AGIs $50k-75k, 2.4% for AGIs $75k-100k, 17.2% for AGIs over 100k)
Profit/loss from business: +$14,921 (reported on 17.8% of returns)
Here:
+$14,921
State:
+$17,837
(% of AGI for various income ranges: 9.1% for AGIs below $10k, 9.6% for AGIs $10k-25k, 6.7% for AGIs $25k-50k, 4.9% for AGIs $50k-75k, 3.8% for AGIs $75k-100k, 4.6% for AGIs over 100k)
IRA payment deduction: $3,084 (reported on 3.9% of returns)
02536:
$3,084
Massachusetts:
$3,100
(% of AGI for various income ranges: 0.4% for AGIs below $10k, 0.4% for AGIs $10k-25k, 0.4% for AGIs $25k-50k, 0.2% for AGIs $50k-75k, 0.3% for AGIs $75k-100k, 0.1% for AGIs over 100k)
Self-employed pension: $9,795 (reported on 1.3% of returns)
Here:
$9,795
Massachusetts:
$14,516
(% of AGI for various income ranges: 0.2% for AGIs $10k-25k, 0.2% for AGIs $25k-50k, 0.2% for AGIs $50k-75k, 0.2% for AGIs $75k-100k, 0.4% for AGIs over 100k)
Total itemized deductions: $18,490 (23% of AGI, reported on 44.5% of returns)
Here:
$18,490
State:
$22,573
Here:
23.3% of AGI
State:
19.5% of AGI
(% of AGI for various income ranges: 35.1% for AGIs below $10k, 16.8% for AGIs $10k-25k, 17.2% for AGIs $25k-50k, 18.5% for AGIs $50k-75k, 18.8% for AGIs $75k-100k, 13.6% for AGIs over 100k)
Charity contributions deductions: $1,891 (2% of AGI, reported on 39.5% of returns)
Here:
$1,891
State:
$3,295
Here:
2.3% of AGI
State:
2.7% of AGI
(% of AGI for various income ranges: 1.5% for AGIs below $10k, 1.1% for AGIs $10k-25k, 1.3% for AGIs $25k-50k, 1.5% for AGIs $50k-75k, 1.7% for AGIs $75k-100k, 1.6% for AGIs over 100k)
Total tax: $7,297 (reported on 80.7% of returns)
02536:
$7,297
State:
$11,494
(% of AGI for various income ranges: 4.7% for AGIs below $10k, 5.0% for AGIs $10k-25k, 7.7% for AGIs $25k-50k, 9.2% for AGIs $50k-75k, 10.1% for AGIs $75k-100k, 17.7% for AGIs over 100k)
Earned income credit: $1,557 (reported on 9.9% of returns)
Here:
$1,557
State:
$1,518
Percentage of individuals using paid preparers for their 2004 taxes: 58.1%
Here:
58%
State:
58%
(% for various income ranges: 45.8% for AGIs below $10k, 58.1% for AGIs $10k-25k, 59.8% for AGIs $25k-50k, 62.1% for AGIs $50k-75k, 59.0% for AGIs $75k-100k, 69.2% for AGIs over 100k)
Household received Food Stamps/SNAP in the past 12 months: 1,100 Household did not receive Food Stamps/SNAP in the past 12 months: 7,808
Women who had a birth in the past 12 months: 88 (93 now married, 0 unmarried) Women who did not have a birth in the past 12 months: 3,406 (1,279 now married, 2,125 unmarried)
Housing units in zip code 02536 with a mortgage: 4,778 (921 second mortgage, 854 both second mortgage and home equity loan) Houses without a mortgage: 81
Median monthly owner costs for units with a mortgage: $2,150 Median monthly owner costs for units without a mortgage: $746
Residents with income below the poverty level in 2022:
This zip code:
7.4%
Whole state:
10.4%
Residents with income below 50% of the poverty level in 2022:
This zip code:
4.0%
Whole state:
5.1%
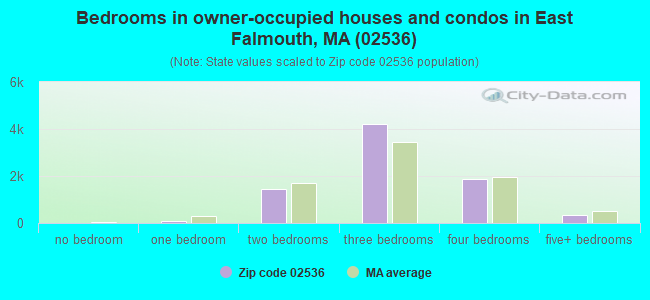
Median number of rooms in houses and condos:
Here:
6.2
State:
6.5
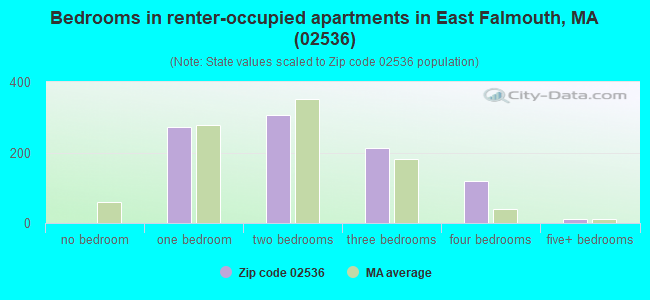
Median number of rooms in apartments:
Here:
4.2
State:
4.0
Notable locations in this zip code not listed on our city pages
Notable locations in zip code 02536: Ballymeade Golf Course (A), Green Pond Harbor Light (B), Butler Flats Light (C), Falmouth Plaza (D), Teaticket Plaza (E), Falmouth Fire Department Station 5 (F), Teaticket Elementary School Media Center (G). Display/hide their locations on the map
Churches in zip code 02536 include: East End Meetinghouse Church (A), Grace Memorial Chapel (B), Saint Anthonys Church (C). Display/hide their locations on the map
2,129 married couples with children.
344 single-parent households (131 men, 213 women).
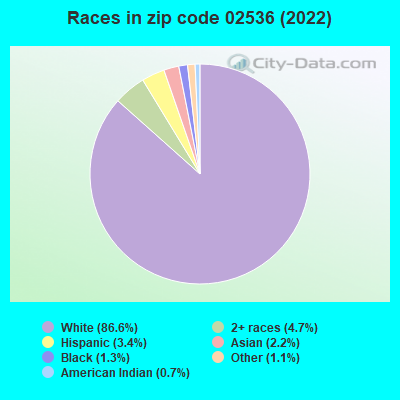
90.9% of residents of 02536 zip code speak English at home.
0.7% of residents speak Spanish at home (80% very well, 20% well).
6.3% of residents speak other Indo-European language at home (62% very well, 20% well, 8% not well, 11% not at all).
1.8% of residents speak Asian or Pacific Island language at home (70% very well, 26% well, 5% not well).
0.8% of residents speak other language at home (100% very well).
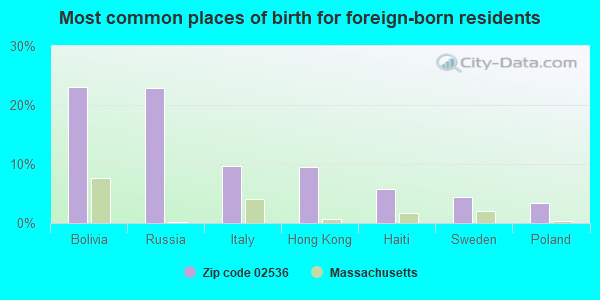
Foreign born population: 1,572 (7.5%) (65.8% of them are naturalized citizens)
This zip code:
7.5%
Whole state:
18.0%
23%Bolivia
23%Russia
10%Italy
10%Hong Kong
6%Haiti
4%Sweden
3%Poland
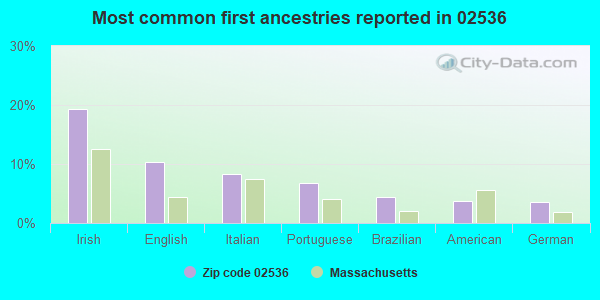
19%Irish
10%English
8%Italian
7%Portuguese
4%Brazilian
4%American
4%German
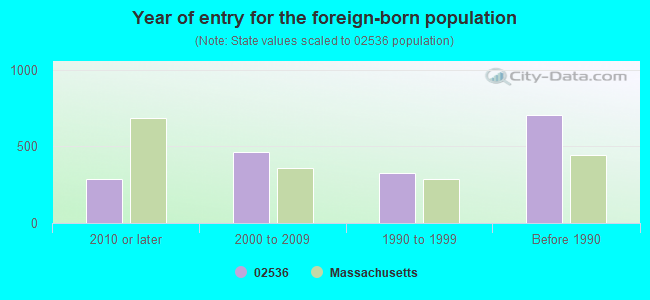
Year of entry for the foreign-born population
2842010 or later
4642000 to 2009
3281990 to 1999
705Before 1990
Facilities with environmental interests located in this zip code:
EAST FALMOUTH ELEM (33 DAVISVILLE RD in EAST FALMOUTH, MA)
(National Center for Education Statistics) - STATE ID-096005
ACCURATE PLASTICS IN (33 TECHNOLOGY PARK DRIVE in EAST FALMOUTH, MA)
AIR MINOR (AIRS/AFS) CRITERIA AND HAZARDOUS AIR POLLUTANT INVENTORY (Inventory of air pollution sources) TRI REPORTER (Tracking of toxic chemicals releasing facilities) Business SIC classification: COATED FABRICS, NOT RUBBERIZED; COATED AND LAMINATED PAPER; COATING, ENGRAVING, AND ALLIED SERVICES
OIL EXPRESS (132 EAST FALMOUTH HWY in FALMOUTH, MA)
(Resource Conservation and Recovery Act (tracking hazardous waste)) Business NAICS classification: HEATING OIL DEALERS. Organizations: COATING OIL PARTNERS LF (CONTACT/OWNER)
BRAGA AUTO REPAIR (108 TROTTING PARK RD in FALMOUTH, MA)
Conditionally Exempt Small Quantity Generators, less than 100 kg/month of hazardous waste (Resource Conservation and Recovery Act (tracking hazardous waste)) - notification Organizations: DONALD BRAGA (CONTACT/OWNER)
DONS FOREION CAR (121 EAST FALMOUTH HWY in EAST FALMOUTH, MA)
Conditionally Exempt Small Quantity Generators, less than 100 kg/month of hazardous waste (Resource Conservation and Recovery Act (tracking hazardous waste)) - notification Organizations: DONALD J BARABE (CONTACT/OWNER)
EDWARDS BOATYARD INC (1209 MAIN ST in EAST FALMOUTH, MA)
Conditionally Exempt Small Quantity Generators, less than 100 kg/month of hazardous waste (Resource Conservation and Recovery Act (tracking hazardous waste)) - notification Organizations: CHARLES SWAIN (CONTACT/OWNER)
DRIFTWOOD CLEANERS (198 MAIN STREET in FALMOUTH, MA)
Small Quantity Generators, between 100 kg and 1000 kg of hazardous waste/month (Resource Conservation and Recovery Act (tracking hazardous waste)) - notification
Housing units lacking complete plumbing facilities: 0.3% Housing units lacking complete kitchen facilities: 1.2%
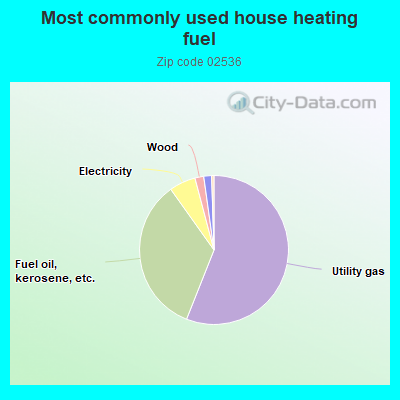
55.8%Utility gas
34.0%Fuel oil, kerosene, etc.
5.7%Electricity
1.9%Wood
1.7%Bottled, tank, or LP gas
0.5%No fuel used
Population in 1990: 15,976. Population change in the 1990s: +3,647 (+22.8%).
Place of birth for U.S.-born residents:
This state: 14,381
Northeast: 2,799
Midwest: 716
South: 526
West: 533
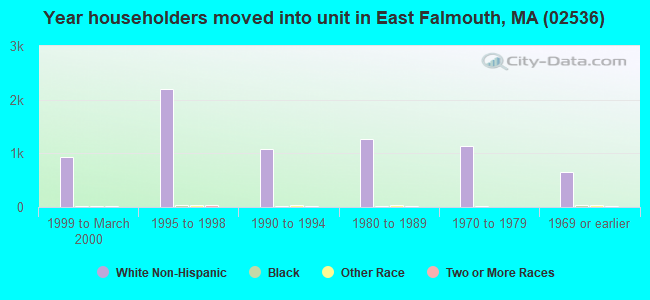
58% of the 02536 zip code residents lived in the same house 5 years ago. Out of people who lived in different houses, 56% lived in this county. Out of people who lived in different counties, 50% lived in Massachusetts.
92% of the 02536 zip code residents lived in the same house 1 year ago. Out of people who lived in different houses, 40% moved from this county. Out of people who lived in different houses, 40% moved from different county within same state. Out of people who lived in different houses, 17% moved from different state. Out of people who lived in different houses, 4% moved from abroad.
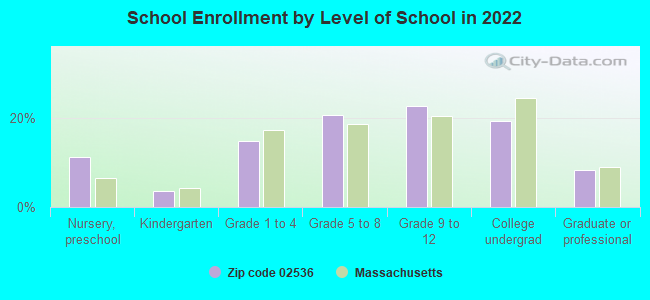
Private vs. public school enrollment:
Students in private schools in grades 1 to 8 (elementary and middle school): 36
Here:
2.7%
Massachusetts:
10.3%
Students in private schools in grades 9 to 12 (high school): 136
Here:
15.9%
Massachusetts:
12.3%
Students in private undergraduate colleges: 185
Here:
26.2%
Massachusetts:
51.2%
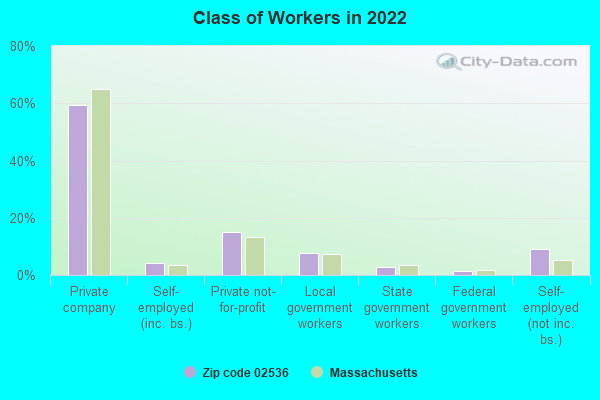
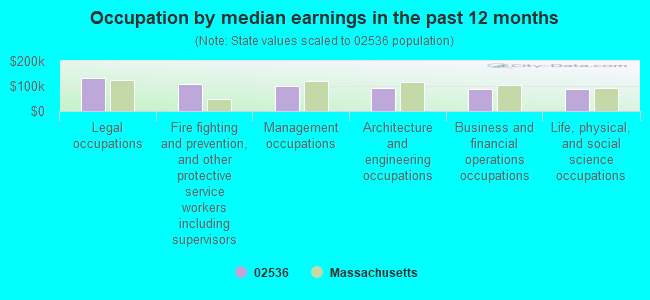
Occupation by median earnings in the past 12 months ($)
132,515Legal occupations
108,142Fire fighting and prevention, and other protective service workers including supervisors
98,896Management occupations
92,817Architecture and engineering occupations
89,889Business and financial operations occupations
86,012Life, physical, and social science occupations
Companies with federal contracts located in this zip code (EAST FALMOUTH, MA):
HYDROID INC (81 TECHNOLOGY PARK DR; small business) 750 employees, $0 revenue. : $27,438,466 in 81 contractsfrom 2002 to 2006
Contracts for Miscellaneous Ship and Marine Equipment, Miscellaneous Communication Equipment, Other Defense -- Advanced Development (R&D), Underwater Use Explosive Ordnance Disposal and Swimmer Weapons Systems Tools and Equipment, and moreby Navy, Department of Defense, National Oceanic and Atmospheric Administration/Under Secretary for Oceans and Atmosphere, Virginia Contracting Activity, and others Signed by year:2000: $0; 2001: $0; 2002: $7,288,145; 2003: $4,409,692; 2004: $4,879,321; 2005: $5,911,153; 2006: $4,950,155.
Biggest contracts:
$3,208,487 with Navy for Miscellaneous Ship and Marine Equipment. Signed on 2002-10-31. Completion date: 2003-05-31.
$2,652,389, same as above.Signed on 2002-05-23. Completion date: 2003-05-31.
$2,355,418 with Navy for Miscellaneous Communication Equipment. Signed on 2006-05-17. Completion date: 2007-05-12.
$1,958,466, same as above.Signed on 2005-09-22. Completion date: 2006-03-31.
CAPE COD RESEARCH, INC (19 RESEARCH ROAD; small business) : $8,175,843 in 44 contractsfrom 1999 to 2006
Contracts for Defense Electronics and Communication Equipment -- Applied Research and Exploratory Development (R&D), Engineering -- Basic Research (R&D), Other Defense -- Applied Research and Exploratory Development (R&D), Other Defense -- Management and Support (R&D), and moreby Navy, Air Force, Army, Department of Defense, and others Signed by year:2000: $1,167,572; 2001: $975,107; 2002: $1,420,740; 2003: $1,528,430; 2004: $734,277; 2005: $974,296; 2006: $674,421.
Biggest contracts:
$701,000 with Navy for Defense Electronics and Communication Equipment -- Applied Research and Exploratory Development (R&D). Signed on 1999-11-05. Completion date: 2000-05-05.
$400,000 with Air Force for Engineering -- Basic Research (R&D). Signed on 2000-01-31. Completion date: 2001-04-30.
$377,219 with Army for Other Defense -- Applied Research and Exploratory Development (R&D). Signed on 2002-10-30. Completion date: 2005-02-28.
$376,070 with Department of Defense for Other Defense -- Management and Support (R&D). Signed on 2003-07-07. Completion date: 2004-09-30.
AUBREY CONSULTING INC (81 TECHNOLOGY PARK DRIVE; small business) : $898,198 in 8 contractsfrom 1999 to 2002
Contracts for Oceanological Studies, Other Defense -- Basic Research (R&D), Marine and Oceanographic -- Basic Research (R&D) by Minerals Management Service, Navy Signed by year:2000: $66,474; 2001: $782,633; 2002: $19,687; 2003: $0; 2004: $0; 2005: $0; 2006: $0.
Biggest contracts:
$599,000 with Minerals Management Service for Oceanological Studies. Signed on 2001-08-15. Completion date: 2002-03-15.
$76,830 with Navy for Other Defense -- Basic Research (R&D). Signed on 2001-05-25. Completion date: 2003-06-01.
$75,303, same as above.Signed on 2001-12-28. Completion date: 2003-06-01.
$38,000, same as above.Signed on 2000-09-27. Completion date: 2000-12-31.
MAC/PC SALES & SERVICE INC (278 TEATICKET HWY; small business) : $14,583 in 4 contractsin 2005
$4,794 with Air Force for ADP Central Processing Unit (CPU, Computer), Digital. Taking place in FL. Signed on 2005-09-21. Completion date: 2005-10-04.
$3,648 with Geological Survey for ADP Central Processing Unit (CPU, Computer), Digital. Signed on 2005-07-28. Completion date: 2005-07-29.
$3,391, same as above.Signed on 2005-06-29. Completion date: 2005-07-08.
$2,750, same as above.Signed on 2005-09-09. Completion date: 2005-09-12.
CAPE COD MOVING INC (385 SANDWICH RD; small business)
$8,648 with Army for Packing/Crating Services. Signed on 2006-05-15. Completion date: 2006-07-28.
CAPE COD CLEANING , INC (391 CURRIER RD; small business) : $6,100 in 2 contractsfrom 2004 to 2006
$3,050 with Army for Carpet Laying and Cleaning. Signed on 2006-05-02. Completion date: 2006-05-26.
$3,050, same as above.Signed on 2004-12-08. Completion date: 2005-01-15.
MAHONEY & DOUGLAS LTD (27 SOPHIE LN; small business)
$3,411 with U.S. Army Corps of Engineers - civil program financing only for Well Drilling/Exploratory Services. Signed on 2003-07-29. Completion date: 2003-08-30.
Top industries in this zip code by the number of employees in 2005:
Professional, Scientific, and Technical Services: Research and Development in the Physical, Engineering, and Life Sciences (250-499 employees: 1 establishment, 10-19 employees: 1 establishment, 1-4 employees: 1 establishment)
Administrative and Support and Waste Management and Remediation Services: Landscaping Services (20-49: 1, 10-19: 2, 1-4: 19)
2002 - 2018 National Fire Incident Reporting System (NFIRS) incidents
According to the data from the years 2002 - 2018 the average number of fire incidents per year is 48. The highest number of reported fires - 110 took place in 2008, and the least - 7 in 2015. The data has a rising trend.
When looking into fire subcategories, the most incidents belonged to: Outside Fires (41.0%), and Structure Fires (35.4%).
Fire incident types reported to NFIRS in Zip Code 02536


 Nearest zip codes: 02540, 02556, 02649, 02534, 02644, 02559.


 According to the data from the years 2002 - 2018 the average number of fire incidents per year is 48. The highest number of reported fires - 110 took place in 2008, and the least - 7 in 2015. The data has a rising trend.
 When looking into fire subcategories, the most incidents belonged to: Outside Fires (41.0%), and Structure Fires (35.4%).