Estimated zip code population in 2022: 15,139 Zip code population in 2010: 14,006 Zip code population in 2000: 12,951
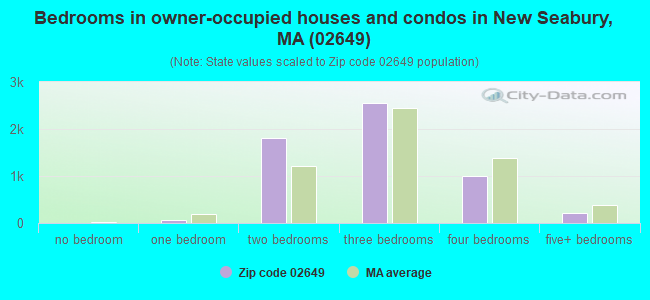
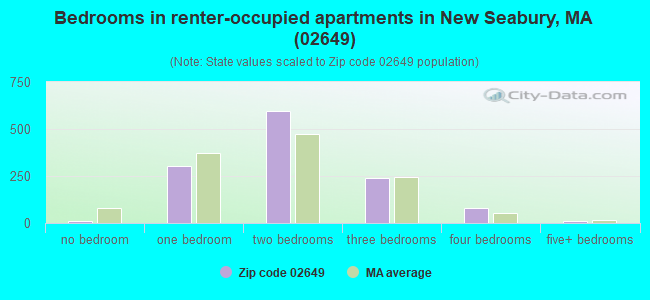
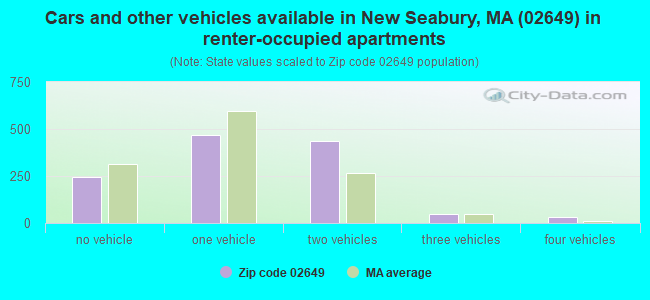
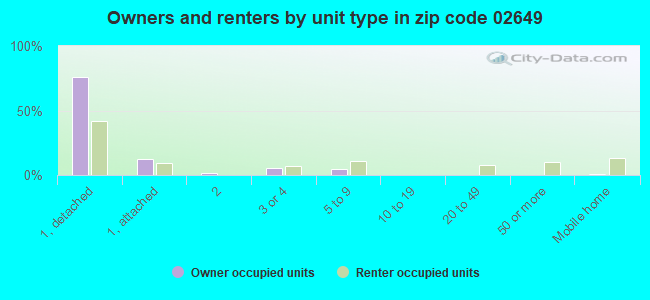
Houses and condos: 10,513 Renter-occupied apartments: 1,239
% of renters here:
18%
State:
38%
March 2022 cost of living index in zip code 02649: 117.7 (more than average, U.S. average is 100)
Land area: 23.2 sq. mi. Water area: 4.1 sq. mi.
Population density: 651 people per square mile
(low).
OSM Map
Google Map
MSN Map
OSM Map
General Map
Google Map
MSN Map
OSM Map
Google Map
MSN Map
OSM Map
Google Map
MSN Map
Please wait while loading the map...
Real estate property taxes paid for housing units in 2022:
This zip code:
0.7% ($3,484)
Massachusetts:
1.0% ($5,536)
Median real estate property taxes paid for housing units with mortgages in 2022: $3,210 (0.6%) Median real estate property taxes paid for housing units with no mortgage in 2022: $3,861 (0.7%)
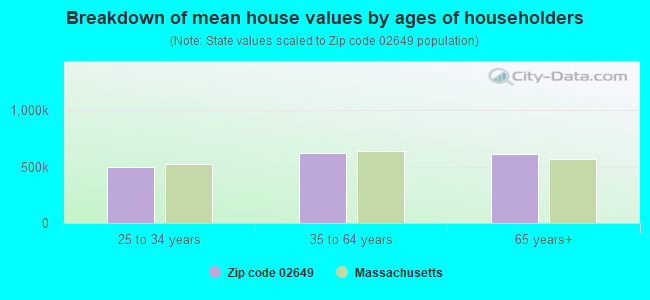
Estimated median house/condo value in 2022: $517,794
02649:
$517,794
Massachusetts:
$534,700
According to our research of Massachusetts and other state lists, there were 12 registered sex offenders living in 02649 zip code as of April 27, 2024. The ratio of all residents to sex offenders in zip code 02649 is 1,190 to 1.
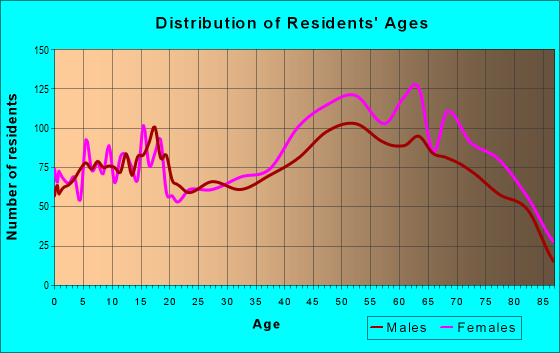
Median resident age:
This zip code:
54.4 years
Massachusetts median age:
40.3 years
Average household size:
This zip code:
2.2 people
Massachusetts:
2.4 people
Averages for the 2020 tax year for zip code 02649, filed in 2021:
Average Adjusted Gross Income (AGI) in 2020: $97,833 (Individual Income Tax Returns)
Here:
$97,833
State:
$105,130
Salary/wage: $77,306 (reported on 70.9% of returns)
Here:
$77,306
State:
$82,951
(% of AGI for various income ranges: 1060.9% for AGIs below $25k, 3226.9% for AGIs $25k-50k, 5513.5% for AGIs $50k-75k, 8364.2% for AGIs $75k-100k, 15301.5% for AGIs $100k-200k, 110644.2% for AGIs over 200k)
Taxable interest for individuals: $2,140 (reported on 43.8% of returns)
This zip code:
$2,140
Massachusetts:
$2,361
(% of AGI for various income ranges: 40.6% for AGIs below $25k, 42.7% for AGIs $25k-50k, 85.4% for AGIs $50k-75k, 160.7% for AGIs $75k-100k, 220.1% for AGIs $100k-200k, 1991.1% for AGIs over 200k)
Ordinary dividends: $9,311 (reported on 30.9% of returns)
Here:
$9,311
State:
$10,365
(% of AGI for various income ranges: 74.4% for AGIs below $25k, 106.4% for AGIs $25k-50k, 206.9% for AGIs $50k-75k, 387.2% for AGIs $75k-100k, 733.5% for AGIs $100k-200k, 6961.6% for AGIs over 200k)
Net capital gain/loss in AGI: +$30,618 (reported on 28.3% of returns)
Here:
+$30,618
State:
+$48,178
(% of AGI for various income ranges: 14.4% for AGIs below $25k, 67.2% for AGIs $25k-50k, 171.9% for AGIs $50k-75k, 354.9% for AGIs $75k-100k, 960.5% for AGIs $100k-200k, 34213.7% for AGIs over 200k)
Profit/loss from business: +$23,488 (reported on 17.2% of returns)
Here:
+$23,488
State:
+$20,792
(% of AGI for various income ranges: 128.1% for AGIs below $25k, 330.4% for AGIs $25k-50k, 297.9% for AGIs $50k-75k, 583.7% for AGIs $75k-100k, 973.9% for AGIs $100k-200k, 8530.0% for AGIs over 200k)
Taxable individual retirement arrangement distribution: $27,327 (reported on 17.7% of returns)
02649:
$27,327
Massachusetts:
$22,790
(% of AGI for various income ranges: 99.9% for AGIs below $25k, 227.6% for AGIs $25k-50k, 551.5% for AGIs $50k-75k, 869.8% for AGIs $75k-100k, 1902.8% for AGIs $100k-200k, 6923.2% for AGIs over 200k)
Self-employed (Keogh) retirement plans: $26,444 (reported on 1.0% of returns)
02649:
$26,444
Massachusetts:
$26,868
(% of AGI for various income ranges: 47.9% for AGIs $100k-200k, 1038.4% for AGIs over 200k)
Total itemized deductions: $31,646 (reported on 15.8% of returns)
Here:
$31,646
State:
$36,722
(% of AGI for various income ranges: 184.2% for AGIs below $25k, 304.7% for AGIs $25k-50k, 583.7% for AGIs $50k-75k, 931.9% for AGIs $75k-100k, 1442.0% for AGIs $100k-200k, 8302.1% for AGIs over 200k)
Charity contributions: $6,348 (reported on 12.3% of returns)
Here:
$6,348
State:
$12,529
(% of AGI for various income ranges: 8.5% for AGIs below $25k, 22.2% for AGIs $25k-50k, 46.0% for AGIs $50k-75k, 85.8% for AGIs $75k-100k, 187.8% for AGIs $100k-200k, 2186.3% for AGIs over 200k)
Taxes paid: $7,857 (reported on 15.8% of returns)
02649:
$7,857
State:
$8,782
(% of AGI for various income ranges: 34.0% for AGIs below $25k, 63.3% for AGIs $25k-50k, 147.0% for AGIs $50k-75k, 263.9% for AGIs $75k-100k, 435.2% for AGIs $100k-200k, 1776.3% for AGIs over 200k)
Earned income credit: $1,782 (reported on 7.2% of returns)
Here:
$1,782
State:
$1,909
(% of AGI for various income ranges: 47.0% for AGIs below $25k, 40.1% for AGIs $25k-50k)
Percentage of individuals using paid preparers for their 2020 taxes: 92.3%
Here:
92%
State:
92%
(% for various income ranges: 90.6% for AGIs below $25k, 92.3% for AGIs $25k-50k, 92.8% for AGIs $50k-75k, 91.9% for AGIs $75k-100k, 93.6% for AGIs $100k-200k, 94.7% for AGIs over 200k)
Averages for the 2012 tax year for zip code 02649, filed in 2013:
Average Adjusted Gross Income (AGI) in 2012: $65,815 (Individual Income Tax Returns)
Here:
$65,815
State:
$81,425
Salary/wage: $51,555 (reported on 75.1% of returns)
Here:
$51,555
State:
$64,752
(% of AGI for various income ranges: 65.9% for AGIs below $25k, 64.8% for AGIs $25k-50k, 61.5% for AGIs $50k-75k, 61.1% for AGIs $75k-100k, 64.3% for AGIs $100k-200k, 45.5% for AGIs over 200k)
Taxable interest for individuals: $2,107 (reported on 41.8% of returns)
This zip code:
$2,107
Massachusetts:
$2,136
(% of AGI for various income ranges: 1.6% for AGIs below $25k, 1.0% for AGIs $25k-50k, 0.9% for AGIs $50k-75k, 1.0% for AGIs $75k-100k, 1.0% for AGIs $100k-200k, 2.2% for AGIs over 200k)
Ordinary dividends: $6,740 (reported on 28.3% of returns)
Here:
$6,740
State:
$9,473
(% of AGI for various income ranges: 3.2% for AGIs below $25k, 2.1% for AGIs $25k-50k, 2.6% for AGIs $50k-75k, 2.2% for AGIs $75k-100k, 2.9% for AGIs $100k-200k, 3.8% for AGIs over 200k)
Net capital gain/loss in AGI: +$17,636 (reported on 23.2% of returns)
Here:
+$17,636
State:
+$31,437
(% of AGI for various income ranges: 0.1% for AGIs $25k-50k, 0.7% for AGIs $50k-75k, 0.9% for AGIs $75k-100k, 2.7% for AGIs $100k-200k, 21.0% for AGIs over 200k)
Profit/loss from business: +$17,489 (reported on 16.6% of returns)
Here:
+$17,489
State:
+$20,662
(% of AGI for various income ranges: 9.8% for AGIs below $25k, 6.5% for AGIs $25k-50k, 3.3% for AGIs $50k-75k, 3.3% for AGIs $75k-100k, 4.0% for AGIs $100k-200k, 3.9% for AGIs over 200k)
Taxable individual retirement arrangement distribution: $19,242 (reported on 19.1% of returns)
02649:
$19,242
Massachusetts:
$18,892
(% of AGI for various income ranges: 6.4% for AGIs below $25k, 4.8% for AGIs $25k-50k, 5.4% for AGIs $50k-75k, 6.6% for AGIs $75k-100k, 6.1% for AGIs $100k-200k, 4.8% for AGIs over 200k)
Self-employment retirement plans: $20,017 (reported on 0.8% of returns)
02649:
$20,017
Massachusetts:
$20,669
Total itemized deductions: $23,174 (22% of AGI, reported on 45.5% of returns)
Here:
$23,174
State:
$28,907
Here:
21.7% of AGI
State:
18.2% of AGI
(% of AGI for various income ranges: 20.0% for AGIs below $25k, 16.2% for AGIs $25k-50k, 17.9% for AGIs $50k-75k, 16.5% for AGIs $75k-100k, 17.0% for AGIs $100k-200k, 12.6% for AGIs over 200k)
Charity contributions: $2,298 (reported on 37.5% of returns)
Here:
$2,298
State:
$4,208
(% of AGI for various income ranges: 1.0% for AGIs below $25k, 1.0% for AGIs $25k-50k, 1.3% for AGIs $50k-75k, 1.3% for AGIs $75k-100k, 1.4% for AGIs $100k-200k, 1.4% for AGIs over 200k)
Taxes paid: $8,795 (reported on 45.3% of returns)
02649:
$8,795
State:
$13,303
(% of AGI for various income ranges: 4.5% for AGIs below $25k, 4.3% for AGIs $25k-50k, 5.7% for AGIs $50k-75k, 5.7% for AGIs $75k-100k, 6.9% for AGIs $100k-200k, 6.8% for AGIs over 200k)
Earned income credit: $1,805 (reported on 10.6% of returns)
Here:
$1,805
State:
$1,971
(% of AGI for various income ranges: 3.4% for AGIs below $25k, 0.7% for AGIs $25k-50k)
Percentage of individuals using paid preparers for their 2012 taxes: 55.7%
Here:
56%
State:
56%
(% for various income ranges: 46.7% for AGIs below $25k, 53.9% for AGIs $25k-50k, 60.8% for AGIs $50k-75k, 58.1% for AGIs $75k-100k, 65.7% for AGIs $100k-200k, 82.8% for AGIs over 200k)
Averages for the 2004 tax year for zip code 02649, filed in 2005:
Average Adjusted Gross Income (AGI) in 2004: $55,477 (Individual Income Tax Returns)
Here:
$55,477
State:
$62,877
Salary/wage: $44,529 (reported on 76.9% of returns)
Here:
$44,529
State:
$52,969
(% of AGI for various income ranges: 121.1% for AGIs below $10k, 62.2% for AGIs $10k-25k, 68.7% for AGIs $25k-50k, 67.5% for AGIs $50k-75k, 67.8% for AGIs $75k-100k, 52.7% for AGIs over 100k)
Taxable interest for individuals: $2,151 (reported on 57.4% of returns)
This zip code:
$2,151
Massachusetts:
$1,945
(% of AGI for various income ranges: 8.5% for AGIs below $10k, 3.4% for AGIs $10k-25k, 2.3% for AGIs $25k-50k, 2.0% for AGIs $50k-75k, 2.0% for AGIs $75k-100k, 2.1% for AGIs over 100k)
Taxable dividends: $4,174 (reported on 32.6% of returns)
Here:
$4,174
State:
$5,323
(% of AGI for various income ranges: 8.7% for AGIs below $10k, 3.2% for AGIs $10k-25k, 2.1% for AGIs $25k-50k, 1.7% for AGIs $50k-75k, 1.8% for AGIs $75k-100k, 2.9% for AGIs over 100k)
Net capital gain/loss: +$12,661 (reported on 27.7% of returns)
Here:
+$12,661
State:
+$20,377
(% of AGI for various income ranges: -4.1% for AGIs below $10k, 0.4% for AGIs $10k-25k, 0.4% for AGIs $25k-50k, 1.2% for AGIs $50k-75k, 1.8% for AGIs $75k-100k, 13.6% for AGIs over 100k)
Profit/loss from business: +$17,085 (reported on 18.3% of returns)
Here:
+$17,085
State:
+$17,837
(% of AGI for various income ranges: 15.7% for AGIs below $10k, 10.1% for AGIs $10k-25k, 5.6% for AGIs $25k-50k, 4.9% for AGIs $50k-75k, 4.3% for AGIs $75k-100k, 5.6% for AGIs over 100k)
IRA payment deduction: $3,190 (reported on 3.2% of returns)
02649:
$3,190
Massachusetts:
$3,100
(% of AGI for various income ranges: 0.2% for AGIs $10k-25k, 0.4% for AGIs $25k-50k, 0.2% for AGIs $50k-75k, 0.2% for AGIs $75k-100k, 0.1% for AGIs over 100k)
Self-employed pension: $15,240 (reported on 1.5% of returns)
Here:
$15,240
Massachusetts:
$14,516
(% of AGI for various income ranges: 0.1% for AGIs $25k-50k, 0.2% for AGIs $50k-75k, 0.3% for AGIs $75k-100k, 0.8% for AGIs over 100k)
Total itemized deductions: $20,390 (24% of AGI, reported on 51.6% of returns)
Here:
$20,390
State:
$22,573
Here:
24.5% of AGI
State:
19.5% of AGI
(% of AGI for various income ranges: 43.2% for AGIs below $10k, 23.7% for AGIs $10k-25k, 21.4% for AGIs $25k-50k, 21.3% for AGIs $50k-75k, 20.1% for AGIs $75k-100k, 15.3% for AGIs over 100k)
Charity contributions deductions: $2,261 (3% of AGI, reported on 46.2% of returns)
Here:
$2,261
State:
$3,295
Here:
2.6% of AGI
State:
2.7% of AGI
(% of AGI for various income ranges: 1.5% for AGIs below $10k, 1.6% for AGIs $10k-25k, 1.6% for AGIs $25k-50k, 1.7% for AGIs $50k-75k, 1.7% for AGIs $75k-100k, 2.2% for AGIs over 100k)
Total tax: $8,857 (reported on 80.4% of returns)
02649:
$8,857
State:
$11,494
(% of AGI for various income ranges: 4.7% for AGIs below $10k, 4.7% for AGIs $10k-25k, 7.3% for AGIs $25k-50k, 8.9% for AGIs $50k-75k, 10.1% for AGIs $75k-100k, 19.1% for AGIs over 100k)
Earned income credit: $1,478 (reported on 9.6% of returns)
Here:
$1,478
State:
$1,518
Percentage of individuals using paid preparers for their 2004 taxes: 61.0%
Here:
61%
State:
58%
(% for various income ranges: 46.2% for AGIs below $10k, 59.3% for AGIs $10k-25k, 62.6% for AGIs $25k-50k, 64.8% for AGIs $50k-75k, 64.6% for AGIs $75k-100k, 73.5% for AGIs over 100k)
Likely homosexual households (counted as self-reported same-sex unmarried-partner households)
Lesbian couples: 0.1% of all households
Gay men: 0.0% of all households
Household received Food Stamps/SNAP in the past 12 months: 547 Household did not receive Food Stamps/SNAP in the past 12 months: 6,264
Women who had a birth in the past 12 months: 139 (83 now married, 51 unmarried) Women who did not have a birth in the past 12 months: 2,442 (762 now married, 1,688 unmarried)
Housing units in zip code 02649 with a mortgage: 3,022 (588 second mortgage, 7 home equity loan, 519 both second mortgage and home equity loan) Houses without a mortgage: 209
Median monthly owner costs for units with a mortgage: $2,189 Median monthly owner costs for units without a mortgage: $912
Residents with income below the poverty level in 2022:
This zip code:
5.5%
Whole state:
10.4%
Residents with income below 50% of the poverty level in 2022:
This zip code:
1.5%
Whole state:
5.1%
Median number of rooms in houses and condos:
Here:
6.1
State:
6.5
Median number of rooms in apartments:
Here:
4.6
State:
4.0
Notable locations in this zip code not listed on our city pages
Notable locations in zip code 02649: 4-H Club Camp (A), New Seabury Golf Club (B), Mashpee Fire and Rescue Department (C), Mashpee Public Library (D). Display/hide their locations on the map
Lakes and swamps: Combs Pond (A), Washburn pond (B), James Pond (C), Witch Pond (D), Santuit Pond (E), Lily Pond (F), Jim Pond (G), Jehu Pond (H). Display/hide their locations on the map
Streams, rivers, and creeks: Abigails Brook (A), Red Brook (B), Mashpee River (C), Quaker Run (D), Santuit River (E). Display/hide their locations on the map
1,301 married couples with children.
624 single-parent households (216 men, 408 women).
95.8% of residents of 02649 zip code speak English at home.
1.1% of residents speak Spanish at home (92% very well, 7% well, 1% not at all).
3.1% of residents speak other Indo-European language at home (78% very well, 9% well, 13% not well).
0.1% of residents speak Asian or Pacific Island language at home (100% well).
0.3% of residents speak other language at home (66% very well, 34% well).
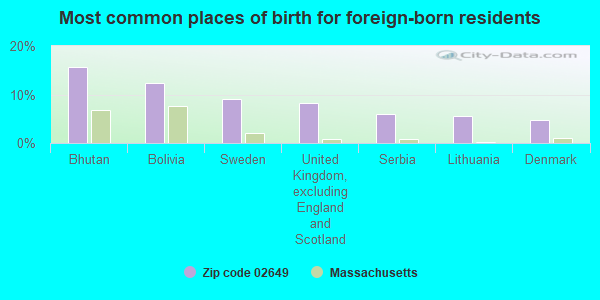
Foreign born population: 835 (5.5%) (69.7% of them are naturalized citizens)
This zip code:
5.5%
Whole state:
18.0%
16%Bhutan
12%Bolivia
9%Sweden
8%United Kingdom, excluding England and Scotland
6%Serbia
6%Lithuania
5%Denmark
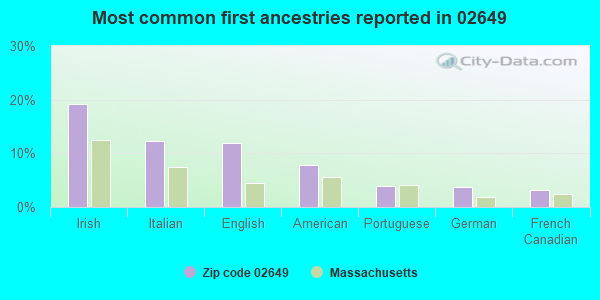
19%Irish
12%Italian
12%English
8%American
4%Portuguese
4%German
3%French Canadian
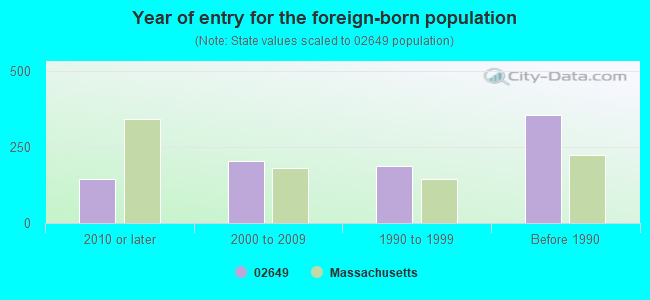
Year of entry for the foreign-born population
1442010 or later
2042000 to 2009
1891990 to 1999
355Before 1990
Facilities with environmental interests located in this zip code:
NEW SEABURY PROPERTIES CORPORATION (1 MALLWAY in MASHPEE, MA)
AIR MINOR (AIRS/AFS) (Integrated Compliance Information System) - ICIS-01-1999-0010, FORMAL ENFORCEMENT ACTION Business SIC classification: LAND SUBDIVIDERS AND DEVELOPERS, EXCEPT CEMETERIES; NONCLASSIFIABLE ESTABLISHMENTS
AUGAT INC (106 FALMOUTH RD in MASHPEE, MA)
AIR MINOR (AIRS/AFS) (Resource Conservation and Recovery Act (tracking hazardous waste)) TRI REPORTER (Tracking of toxic chemicals releasing facilities) Business SIC classification: ELECTRONIC COMPONENTS Business NAICS classification: SEMICONDUCTOR AND RELATED DEVICE MANUFACTURING. Alternative names: AUGAT INC., AUGAT INTERCONNECTION COMPONENTS
KENNETH COOMBS SCHOOL (152 OLD BARNSTABLE ROAD in MASHPEE, MA)
(National Center for Education Statistics) - STATE ID-172005 Organizations: MASHPEE (SCHOOL DISTRICT)
MASHPEE HIGH (500 OLD BARNSTABLE ROAD in MASHPEE, MA)
(National Center for Education Statistics) - STATE ID-172505
CAPE COD PHOTO & ART SUPPLY (NORTH MARKET ST in MASHPEE, MA)
(Resource Conservation and Recovery Act (tracking hazardous waste)) Organizations: CAPE COD PHOTO & ART SUPPLY INC (CONTACT/OPERATOR)
MASHPEE TRANSFER STATION (380 ASHERS PATH EAST in MASHPEE, MA)
AIR MINOR (AIRS/AFS) SUPERFUND (Superfund database) CRITERIA AND HAZARDOUS AIR POLLUTANT INVENTORY (Inventory of air pollution sources) Business SIC classification: REFUSE SYSTEMS; NONCLASSIFIABLE ESTABLISHMENTS Business NAICS classification: SOLID WASTE LANDFILL. Alternative names: MASHPEE LANDFILL, MASPEE LANDFILL
Conditionally Exempt Small Quantity Generators, less than 100 kg/month of hazardous waste (Resource Conservation and Recovery Act (tracking hazardous waste)) - notification Business NAICS classification: ALL OTHER AUTOMOTIVE REPAIR AND MAINTENANCE. Organizations: CAPE COD VENTURES INC (CONTACT/OWNER)
, JOE MENENDER (CONTACT/OWNER)
CAPE COD COFFEE CO (ROUTE 130 in MASHPEE, MA)
AIR SYNTHETIC MINOR (AIRS/AFS) CRITERIA AND HAZARDOUS AIR POLLUTANT INVENTORY (Inventory of air pollution sources) Business SIC classification: ROASTED COFFEE
NEW SEABURY CORP (ROCK LANDING RD in MASHPEE, MA)
AIR MINOR (AIRS/AFS) Business SIC classification: NONCLASSIFIABLE ESTABLISHMENTS
MASHPEE (TOWN OF in MASHPEE, MA)
AIR MINOR (AIRS/AFS) Business SIC classification: GENERAL GOVERNMENT
MASHPEE MEDICAL FACILITY (5 INDUSTRIAL DR in MASHPEE, MA)
Small Quantity Generators, between 100 kg and 1000 kg of hazardous waste/month (Resource Conservation and Recovery Act (tracking hazardous waste)) Organizations: FALMOUTH HOSPITAL (CONTACT/OWNER)
Alternative names: MASHPEE HEALTH CENTER, MASHPEE MEDICAL CENTER
MASHPEE PUBLIC SCHOOLS (16 GREAT NECK ROAD NORTH in MASHPEE, MA)
COMPLIANCE ACTIVITY (Tracking inspections of insecticide, fungicide, and rodenticide, and toxic substances)
Housing units lacking complete plumbing facilities: 0.4% Housing units lacking complete kitchen facilities: 0.2%
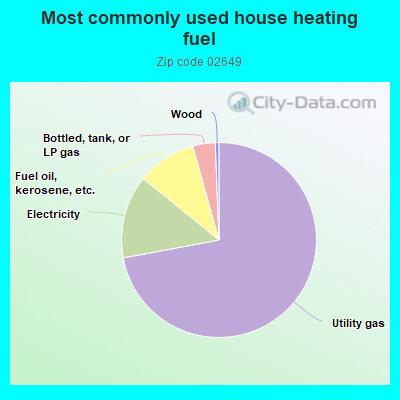
71.7%Utility gas
13.7%Electricity
9.8%Fuel oil, kerosene, etc.
3.7%Bottled, tank, or LP gas
0.6%Wood
Population in 1990: 4,469. Population change in the 1990s: +8,482 (+189.8%).
Place of birth for U.S.-born residents:
This state: 9,994
Northeast: 2,461
Midwest: 484
South: 942
West: 300
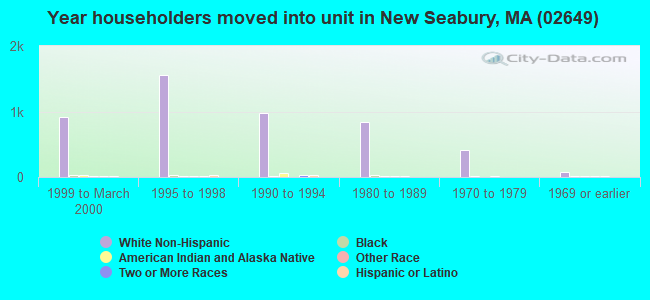
50% of the 02649 zip code residents lived in the same house 5 years ago. Out of people who lived in different houses, 54% lived in this county. Out of people who lived in different counties, 50% lived in Massachusetts.
88% of the 02649 zip code residents lived in the same house 1 year ago. Out of people who lived in different houses, 45% moved from this county. Out of people who lived in different houses, 41% moved from different county within same state. Out of people who lived in different houses, 13% moved from different state.
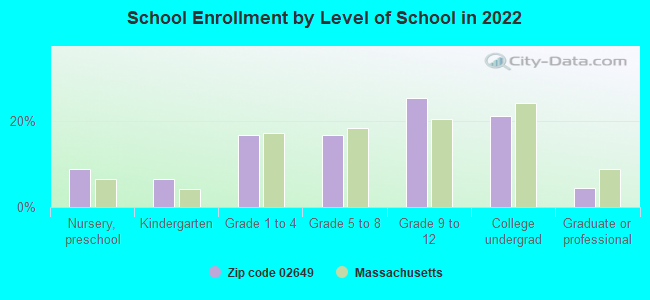
Private vs. public school enrollment:
Students in private schools in grades 1 to 8 (elementary and middle school): 44
Here:
5.5%
Massachusetts:
10.3%
Students in private schools in grades 9 to 12 (high school): 94
Here:
15.4%
Massachusetts:
12.3%
Students in private undergraduate colleges: 177
Here:
35.2%
Massachusetts:
51.2%
Occupation by median earnings in the past 12 months ($)
112,821Law enforcement workers including supervisors
90,215Computer and mathematical occupations
84,237Installation, maintenance, and repair occupations
77,742Architecture and engineering occupations
75,114Life, physical, and social science occupations
73,774Business and financial operations occupations
Companies with federal contracts located in this zip code (MASHPEE, MA):
C S R M INCORPORATION (7 HOLLY FARM DRIVE; small business) : $253,358 in 6 contractsfrom 2001 to 2005
Contracts for Food Services by Army Signed by year:2000: $0; 2001: $51,684; 2002: $54,400; 2003: $44,161; 2004: $50,578; 2005: $52,535; 2006: $0.
Biggest contracts:
$54,400 with Army for Food Services. Signed on 2002-05-15. Completion date: 2002-07-02.
$51,684, same as above.Signed on 2001-05-30. Completion date: 2001-06-29.
$50,578, same as above.Signed on 2004-06-16. Completion date: 2004-07-02.
$49,387, same as above.Signed on 2005-05-14. Completion date: 2005-07-01.
C-MAP USA INC (133 FALMOUTH RD; small business) : $73,824 in 12 contractsfrom 2004 to 2006
Contracts for Maps, Atlases, Charts, and Globes, ADP Software, Hydrographic Maps, Charts and Geodesic Products, Radio Navigation Equipment, Except Airborne by Navy, U.S. Special Operations Command, Department of Defense Signed by year:2000: $0; 2001: $0; 2002: $0; 2003: $0; 2004: $10,604; 2005: $49,090; 2006: $14,130.
Biggest contracts:
$17,501 with Navy for Maps, Atlases, Charts, and Globes. Signed on 2005-01-06. Completion date: 2005-01-14.
$9,330 with U.S. Special Operations Command for ADP Software. Signed on 2006-06-01. Completion date: 2006-07-12.
$7,504 with U.S. Special Operations Command for Hydrographic Maps, Charts and Geodesic Products. Signed on 2005-12-07. Completion date: 2005-12-15.
$5,975 with Department of Defense for Hydrographic Maps, Charts and Geodesic Products. Signed on 2004-10-18. Completion date: 2004-10-28.
EMPIRE PROTECTIVE SERVICES, IN (52 DORAN DR; small business) 33 employees, $500000 revenue.
$32,130 with National Oceanic and Atmospheric Administration/Under Secretary for Oceans and Atmosphere for Guard Services. Signed on 2003-06-15. Completion date: 2007-06-15.
WAMPWORX, LLC (299 FALMOUTH RD; small business)
$29,000 with Army for Maintenance, Repair or Alteration of Real Property -- Other Administrative Facilities and Service Buildings. Signed on 2006-06-01. Completion date: 2006-07-14.
J & T CONSTRUCTION (9 CACCAWACK RD; small business) 2 employees, $95000 revenue.
$29,000 with United States Coast Guard (disused code: now 7008) for Maintenance, Repair or Alteration of Real Property -- Family Housing Facilities. Signed on 2001-06-15. Completion date: 2001-08-15.
PAINTING PLUS (11 ANTUCKS; small business)
$21,580 with United States Coast Guard (disused code: now 7008) for Maintenance, Repair or Alteration of Real Property -- Other Administrative Facilities and Service Buildings. Signed on 2002-11-15. Completion date: 2003-02-15.
DUNNING & KIRRANE L L P (133 FALMOUTH RD STE A; small business) : $13,050 in 8 contractsfrom 2004 to 2006
Contracts for Other Professional Services by Army Signed by year:2000: $0; 2001: $0; 2002: $0; 2003: $0; 2004: $20,700; 2005: -$450; 2006: -$7,200.
Biggest contracts:
$9,000 with Army for Other Professional Services. Signed on 2004-08-20. Completion date: 2004-09-24.
$7,200, same as above.Signed on 2004-08-19. Completion date: 2004-09-22.
$1,800, same as above.Signed on 2004-05-11. Completion date: 2004-06-16.
$1,350, same as above.Signed on 2004-06-07. Completion date: 2004-07-09.
JMW ASSOCIATES (102 PINE HILL BLVD; small business)
$8,700 with Army for Physical Sciences -- Applied Research and Exploratory Development (R&D). Taking place in MD. Signed on 2005-11-29. Completion date: 2006-01-25.
Top industries in this zip code by the number of employees in 2005:
Other Services (except Public Administration): Beauty Salons (20-49: 2, 10-19: 2, 5-9: 2, 1-4: 2)
Other Services (except Public Administration): Other Similar Organizations (except Business, Professional, Labor, and Political Organizations) (20-49: 3, 1-4: 3)
Arts, Entertainment, and Recreation: Fitness and Recreational Sports Centers (50-99: 1, 5-9: 4, 1-4: 2)
Health Care and Social Assistance: Vocational Rehabilitation Services (50-99: 1, 10-19: 1)
People in group quarters in 2010:
96 people in nursing facilities/skilled-nursing facilities
4 people in group homes intended for adults
People in group quarters in 2000:
93 people in nursing homes
20 people in homes for the mentally retarded
16 people in other workers' dormitories
Fatal accident statistics in 2011:
Fatal accident count: 2
Vehicles involved in fatal accidents: 3
Fatal accidents caused by drunken drivers: 1
Fatalities: 2
Persons involved in fatal accidents: 3
Pedestrians involved in fatal accidents: 1
Fatal accident statistics in 2010:
Fatal accident count: 1
Vehicles involved in fatal accidents: 2
Fatal accidents caused by drunken drivers: 0
Fatalities: 1
Persons involved in fatal accidents: 2
Pedestrians involved in fatal accidents: 0
Home Mortgage Disclosure Act Aggregated Statistics For Year 2009 (Based on 4 full and 4 partial tracts)
A) FHA, FSA/RHS & VA Home Purchase Loans
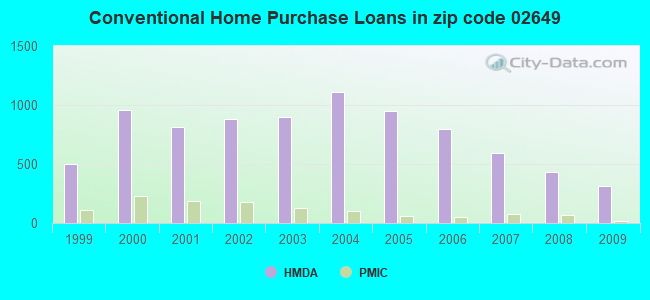
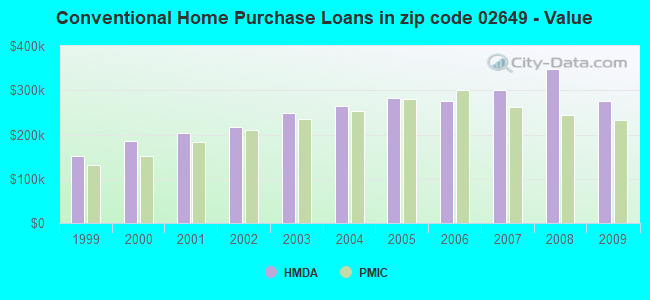
B) Conventional Home Purchase Loans
C) Refinancings
D) Home Improvement Loans
F) Non-occupant Loans on < 5 Family Dwellings (A B C & D)
G) Loans On Manufactured Home Dwelling (A B C & D)
Number
Average Value
Number
Average Value
Number
Average Value
Number
Average Value
Number
Average Value
Number
Average Value
LOANS ORIGINATED
117
$244,600
313
$276,043
1,405
$268,663
62
$164,124
639
$338,404
0
$0
APPLICATIONS APPROVED, NOT ACCEPTED
12
$224,217
17
$230,848
100
$259,708
4
$13,112
38
$292,345
0
$0
APPLICATIONS DENIED
19
$184,685
48
$209,109
402
$316,991
23
$128,883
146
$331,816
4
$57,660
APPLICATIONS WITHDRAWN
10
$232,149
27
$308,922
229
$228,864
12
$125,397
57
$268,942
0
$0
FILES CLOSED FOR INCOMPLETENESS
6
$239,157
2
$71,425
65
$272,548
0
$0
13
$284,023
0
$0
Aggregated Statistics For Year 2008 (Based on 4 full and 4 partial tracts)
A) FHA, FSA/RHS & VA Home Purchase Loans
B) Conventional Home Purchase Loans
C) Refinancings
D) Home Improvement Loans
F) Non-occupant Loans on < 5 Family Dwellings (A B C & D)
G) Loans On Manufactured Home Dwelling (A B C & D)
Number
Average Value
Number
Average Value
Number
Average Value
Number
Average Value
Number
Average Value
Number
Average Value
LOANS ORIGINATED
70
$220,804
435
$348,898
686
$293,072
56
$146,354
479
$381,926
0
$0
APPLICATIONS APPROVED, NOT ACCEPTED
6
$259,348
35
$357,071
94
$280,033
8
$34,681
50
$299,562
0
$0
APPLICATIONS DENIED
2
$154,585
56
$345,973
333
$328,237
55
$49,471
57
$343,155
2
$35,725
APPLICATIONS WITHDRAWN
6
$211,008
75
$453,286
158
$315,255
4
$41,358
76
$445,343
2
$71,445
FILES CLOSED FOR INCOMPLETENESS
4
$145,782
13
$213,799
40
$372,390
4
$41,678
17
$301,715
0
$0
Aggregated Statistics For Year 2007 (Based on 4 full and 4 partial tracts)
A) FHA, FSA/RHS & VA Home Purchase Loans
B) Conventional Home Purchase Loans
C) Refinancings
D) Home Improvement Loans
E) Loans on Dwellings For 5+ Families
F) Non-occupant Loans on < 5 Family Dwellings (A B C & D)
G) Loans On Manufactured Home Dwelling (A B C & D)
Number
Average Value
Number
Average Value
Number
Average Value
Number
Average Value
Number
Average Value
Number
Average Value
Number
Average Value
LOANS ORIGINATED
16
$257,487
593
$300,301
917
$269,080
141
$122,499
2
$220,140
452
$360,154
2
$1,930
APPLICATIONS APPROVED, NOT ACCEPTED
0
$0
78
$325,115
150
$303,969
33
$119,287
0
$0
42
$407,958
2
$71,445
APPLICATIONS DENIED
8
$250,450
95
$250,356
541
$288,062
90
$70,078
0
$0
65
$286,550
0
$0
APPLICATIONS WITHDRAWN
0
$0
70
$231,270
213
$301,682
17
$176,865
0
$0
46
$334,015
2
$71,445
FILES CLOSED FOR INCOMPLETENESS
0
$0
15
$225,294
77
$311,788
14
$113,471
0
$0
12
$227,923
0
$0
Aggregated Statistics For Year 2006 (Based on 4 full and 4 partial tracts)
A) FHA, FSA/RHS & VA Home Purchase Loans
B) Conventional Home Purchase Loans
C) Refinancings
D) Home Improvement Loans
F) Non-occupant Loans on < 5 Family Dwellings (A B C & D)
G) Loans On Manufactured Home Dwelling (A B C & D)
Number
Average Value
Number
Average Value
Number
Average Value
Number
Average Value
Number
Average Value
Number
Average Value
LOANS ORIGINATED
20
$208,750
797
$275,010
1,398
$272,588
251
$140,115
515
$365,659
4
$44,412
APPLICATIONS APPROVED, NOT ACCEPTED
2
$289,605
50
$404,131
170
$229,042
33
$75,657
46
$435,525
2
$45,380
APPLICATIONS DENIED
2
$270,040
118
$267,178
670
$268,526
117
$122,258
63
$296,640
4
$19,568
APPLICATIONS WITHDRAWN
4
$223,215
48
$276,936
473
$268,832
14
$129,092
52
$254,317
0
$0
FILES CLOSED FOR INCOMPLETENESS
0
$0
11
$420,741
124
$281,214
2
$83,165
10
$513,250
0
$0
Aggregated Statistics For Year 2005 (Based on 4 full and 4 partial tracts)
A) FHA, FSA/RHS & VA Home Purchase Loans
B) Conventional Home Purchase Loans
C) Refinancings
D) Home Improvement Loans
F) Non-occupant Loans on < 5 Family Dwellings (A B C & D)
G) Loans On Manufactured Home Dwelling (A B C & D)
Number
Average Value
Number
Average Value
Number
Average Value
Number
Average Value
Number
Average Value
Number
Average Value
LOANS ORIGINATED
8
$224,880
950
$282,977
1,581
$245,787
219
$180,061
579
$372,217
4
$93,900
APPLICATIONS APPROVED, NOT ACCEPTED
0
$0
75
$250,945
182
$306,543
21
$174,580
38
$501,845
2
$78,270
APPLICATIONS DENIED
2
$112,965
149
$223,130
536
$229,694
107
$93,274
58
$250,838
14
$72,129
APPLICATIONS WITHDRAWN
2
$230,900
127
$255,486
557
$263,580
56
$160,951
67
$301,461
0
$0
FILES CLOSED FOR INCOMPLETENESS
0
$0
21
$298,157
97
$243,474
2
$50,205
17
$290,684
2
$66,530
Aggregated Statistics For Year 2004 (Based on 4 full and 4 partial tracts)
A) FHA, FSA/RHS & VA Home Purchase Loans
B) Conventional Home Purchase Loans
C) Refinancings
D) Home Improvement Loans
E) Loans on Dwellings For 5+ Families
F) Non-occupant Loans on < 5 Family Dwellings (A B C & D)
G) Loans On Manufactured Home Dwelling (A B C & D)
Number
Average Value
Number
Average Value
Number
Average Value
Number
Average Value
Number
Average Value
Number
Average Value
Number
Average Value
LOANS ORIGINATED
15
$262,899
1,108
$265,067
1,765
$229,202
164
$188,882
4
$1,393,142
703
$308,299
2
$74,360
APPLICATIONS APPROVED, NOT ACCEPTED
2
$238,730
85
$270,649
191
$254,427
41
$70,389
0
$0
63
$303,096
0
$0
APPLICATIONS DENIED
2
$240,685
130
$271,141
450
$218,355
97
$56,756
0
$0
75
$266,179
4
$61,640
APPLICATIONS WITHDRAWN
0
$0
75
$262,060
655
$220,896
47
$106,787
0
$0
83
$312,703
0
$0
FILES CLOSED FOR INCOMPLETENESS
0
$0
25
$211,088
103
$252,140
6
$202,258
0
$0
17
$307,005
0
$0
Aggregated Statistics For Year 2003 (Based on 4 full and 4 partial tracts)
A) FHA, FSA/RHS & VA Home Purchase Loans
B) Conventional Home Purchase Loans
C) Refinancings
D) Home Improvement Loans
F) Non-occupant Loans on < 5 Family Dwellings (A B C & D)
Number
Average Value
Number
Average Value
Number
Average Value
Number
Average Value
Number
Average Value
LOANS ORIGINATED
23
$234,789
899
$247,662
3,929
$194,829
83
$83,570
1,125
$264,975
APPLICATIONS APPROVED, NOT ACCEPTED
2
$255,360
79
$270,746
459
$201,046
29
$55,432
101
$281,937
APPLICATIONS DENIED
8
$174,931
110
$231,475
636
$208,495
76
$25,341
93
$282,426
APPLICATIONS WITHDRAWN
2
$205,650
61
$256,378
618
$193,740
27
$33,825
61
$236,370
FILES CLOSED FOR INCOMPLETENESS
0
$0
12
$211,327
90
$251,416
2
$43,445
17
$208,053
Aggregated Statistics For Year 2002 (Based on 4 full and 4 partial tracts)
A) FHA, FSA/RHS & VA Home Purchase Loans
B) Conventional Home Purchase Loans
C) Refinancings
D) Home Improvement Loans
F) Non-occupant Loans on < 5 Family Dwellings (A B C & D)
Number
Average Value
Number
Average Value
Number
Average Value
Number
Average Value
Number
Average Value
LOANS ORIGINATED
58
$163,278
879
$217,428
2,835
$178,937
141
$66,611
838
$246,461
APPLICATIONS APPROVED, NOT ACCEPTED
2
$154,585
60
$218,924
239
$175,502
45
$31,140
51
$263,800
APPLICATIONS DENIED
10
$174,867
77
$215,333
457
$159,909
86
$42,205
74
$243,826
APPLICATIONS WITHDRAWN
4
$221,608
64
$247,454
365
$167,391
43
$47,302
44
$214,701
FILES CLOSED FOR INCOMPLETENESS
2
$178,070
13
$402,542
81
$173,489
0
$0
15
$356,927
Aggregated Statistics For Year 2001 (Based on 4 full and 4 partial tracts)
A) FHA, FSA/RHS & VA Home Purchase Loans
B) Conventional Home Purchase Loans
C) Refinancings
D) Home Improvement Loans
F) Non-occupant Loans on < 5 Family Dwellings (A B C & D)
Number
Average Value
Number
Average Value
Number
Average Value
Number
Average Value
Number
Average Value
LOANS ORIGINATED
66
$151,152
814
$203,064
2,178
$160,247
112
$40,026
647
$228,474
APPLICATIONS APPROVED, NOT ACCEPTED
0
$0
77
$178,267
222
$161,753
37
$45,089
59
$225,299
APPLICATIONS DENIED
6
$121,028
68
$162,429
326
$130,487
91
$34,590
29
$174,405
APPLICATIONS WITHDRAWN
2
$61,790
56
$220,552
376
$179,399
27
$32,239
28
$577,219
FILES CLOSED FOR INCOMPLETENESS
0
$0
13
$297,042
45
$144,723
4
$66,190
15
$274,618
Aggregated Statistics For Year 2000 (Based on 4 full and 4 partial tracts)
A) FHA, FSA/RHS & VA Home Purchase Loans
B) Conventional Home Purchase Loans
C) Refinancings
D) Home Improvement Loans
F) Non-occupant Loans on < 5 Family Dwellings (A B C & D)
Number
Average Value
Number
Average Value
Number
Average Value
Number
Average Value
Number
Average Value
LOANS ORIGINATED
109
$122,842
961
$184,713
578
$142,856
91
$29,169
441
$235,708
APPLICATIONS APPROVED, NOT ACCEPTED
2
$158,500
100
$204,020
99
$140,341
48
$32,968
42
$256,364
APPLICATIONS DENIED
14
$110,661
89
$154,129
256
$83,289
89
$36,900
25
$136,919
APPLICATIONS WITHDRAWN
4
$149,205
60
$167,179
241
$110,104
27
$18,246
15
$119,004
FILES CLOSED FOR INCOMPLETENESS
2
$82,185
14
$165,437
67
$154,317
2
$9,785
4
$296,302
Aggregated Statistics For Year 1999 (Based on 2 full and 2 partial tracts)
A) FHA, FSA/RHS & VA Home Purchase Loans
B) Conventional Home Purchase Loans
C) Refinancings
D) Home Improvement Loans
F) Non-occupant Loans on < 5 Family Dwellings (A B C & D)
2002 - 2018 National Fire Incident Reporting System (NFIRS) incidents
According to the data from the years 2002 - 2018 the average number of fire incidents per year is 54. The highest number of fires - 81 took place in 2003, and the least - 8 in 2002. The data has an increasing trend.
When looking into fire subcategories, the most incidents belonged to: Structure Fires (45.8%), and Outside Fires (39.1%).
Fire incident types reported to NFIRS in Zip Code 02649


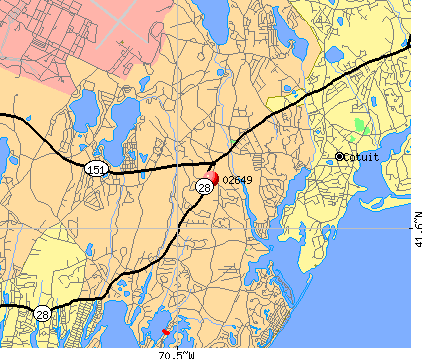 Nearest zip codes: 02635, 02644, 02536, 02648, 02655, 02542.


 According to the data from the years 2002 - 2018 the average number of fire incidents per year is 54. The highest number of fires - 81 took place in 2003, and the least - 8 in 2002. The data has an increasing trend.
 When looking into fire subcategories, the most incidents belonged to: Structure Fires (45.8%), and Outside Fires (39.1%).