Estimated zip code population in 2022: 11,925 Zip code population in 2010: 10,742 Zip code population in 2000: 11,341
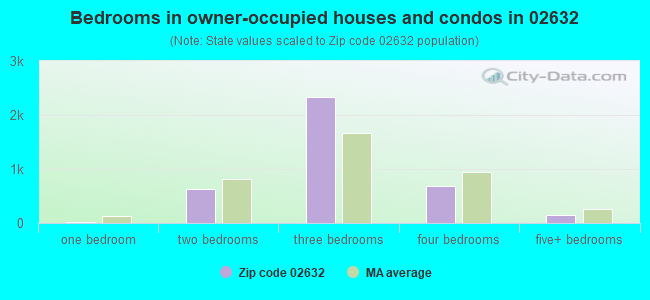
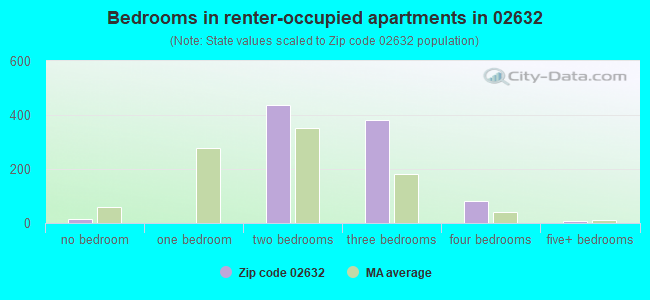
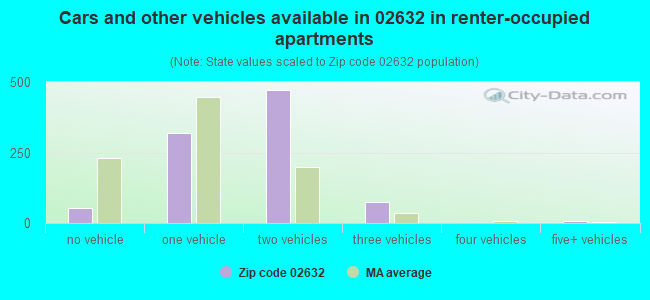
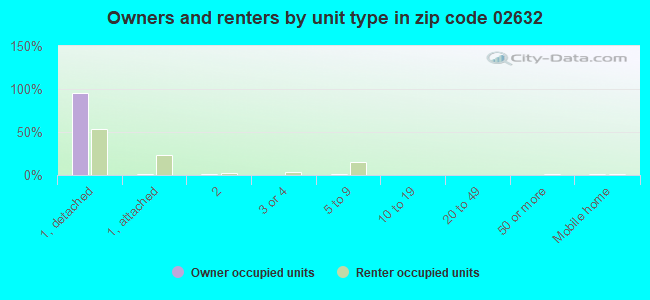
Houses and condos: 6,260 Renter-occupied apartments: 919
% of renters here:
19%
State:
38%
March 2022 cost of living index in zip code 02632: 118.0 (more than average, U.S. average is 100)
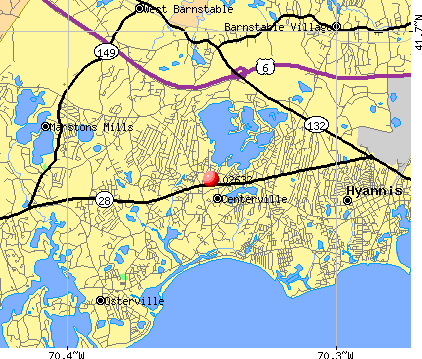
Land area: 7.3 sq. mi. Water area: 1.5 sq. mi.
Population density: 1,629 people per square mile
(low).
OSM Map
Google Map
MSN Map
OSM Map
General Map
Google Map
MSN Map
OSM Map
Google Map
MSN Map
OSM Map
Google Map
MSN Map
Please wait while loading the map...
Real estate property taxes paid for housing units in 2022:
This zip code:
0.7% ($3,481)
Massachusetts:
1.0% ($5,536)
Median real estate property taxes paid for housing units with mortgages in 2022: $3,441 (0.6%) Median real estate property taxes paid for housing units with no mortgage in 2022: $3,552 (0.7%)
Business Search- 14 Million verified businesses
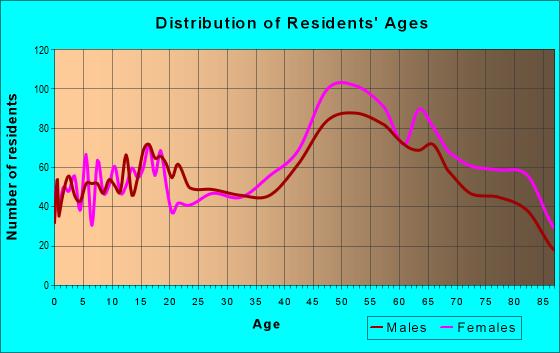
Males: 5,939
(49.8%)
Females: 5,986
(50.2%)
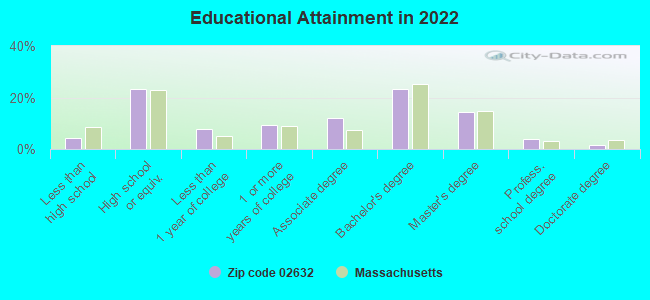
For population 25 years and over in 02632:
High school or higher: 95.8%
Bachelor's degree or higher: 43.4%
Graduate or professional degree: 20.0%
Unemployed: 2.4%
Mean travel time to work (commute): 29.4 minutes
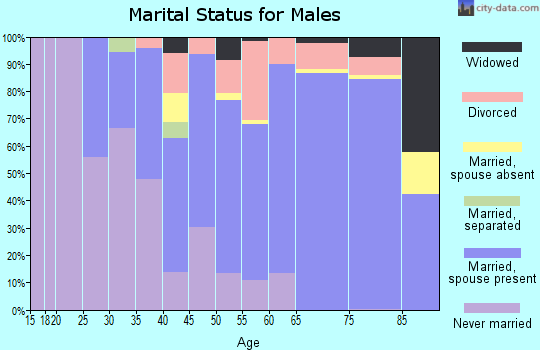
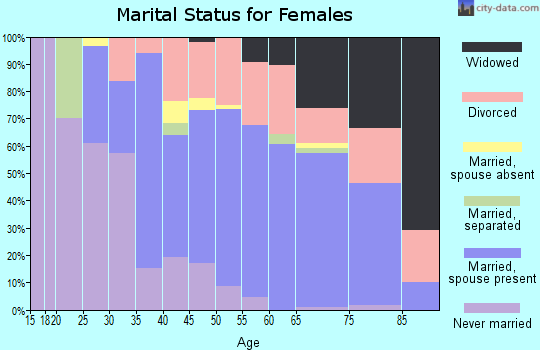
For population 15 years and over in 02632:
Never married: 24.7%
Now married: 60.3%
Separated: 1.1%
Widowed: 4.1%
Divorced: 9.8%
Zip code 02632 compared to state average:
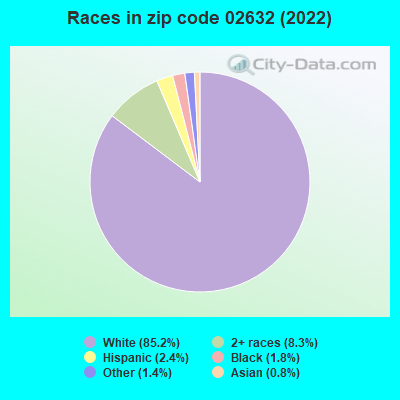
Black race population percentage significantly below state average.
Hispanic race population percentage significantly below state average.
Median age significantly above state average.
Renting percentage below state average.
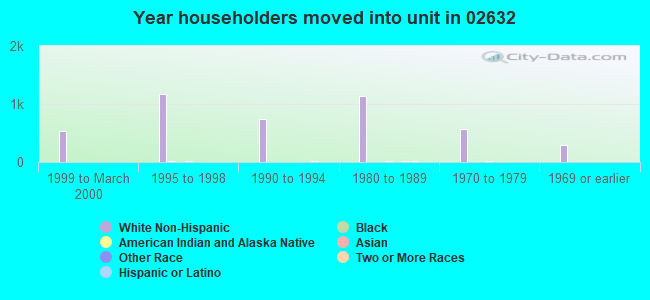
Length of stay since moving in significantly above state average.
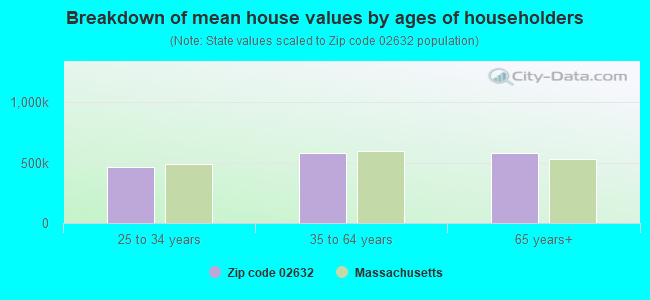
Estimated median house/condo value in 2022: $528,512
02632:
$528,512
Massachusetts:
$534,700
According to our research of Massachusetts and other state lists, there were 9 registered sex offenders living in 02632 zip code as of May 09, 2024. The ratio of all residents to sex offenders in zip code 02632 is 1,160 to 1.
Median resident age:
This zip code:
49.4 years
Massachusetts median age:
40.3 years
Average household size:
This zip code:
2.5 people
Massachusetts:
2.4 people
Averages for the 2020 tax year for zip code 02632, filed in 2021:
Average Adjusted Gross Income (AGI) in 2020: $83,936 (Individual Income Tax Returns)
Here:
$83,936
State:
$105,130
Salary/wage: $67,063 (reported on 73.9% of returns)
Here:
$67,063
State:
$82,951
(% of AGI for various income ranges: 1178.2% for AGIs below $25k, 3283.2% for AGIs $25k-50k, 6451.5% for AGIs $50k-75k, 9214.3% for AGIs $75k-100k, 17666.0% for AGIs $100k-200k, 111194.4% for AGIs over 200k)
Taxable interest for individuals: $1,326 (reported on 38.7% of returns)
This zip code:
$1,326
Massachusetts:
$2,361
(% of AGI for various income ranges: 31.7% for AGIs below $25k, 45.0% for AGIs $25k-50k, 57.3% for AGIs $50k-75k, 89.7% for AGIs $75k-100k, 150.3% for AGIs $100k-200k, 1120.0% for AGIs over 200k)
Ordinary dividends: $7,368 (reported on 26.0% of returns)
Here:
$7,368
State:
$10,365
(% of AGI for various income ranges: 73.7% for AGIs below $25k, 79.7% for AGIs $25k-50k, 181.5% for AGIs $50k-75k, 392.3% for AGIs $75k-100k, 678.8% for AGIs $100k-200k, 4823.3% for AGIs over 200k)
Net capital gain/loss in AGI: +$18,634 (reported on 23.5% of returns)
Here:
+$18,634
State:
+$48,178
(% of AGI for various income ranges: 16.5% for AGIs below $25k, 61.5% for AGIs $25k-50k, 169.7% for AGIs $50k-75k, 247.7% for AGIs $75k-100k, 942.4% for AGIs $100k-200k, 22042.2% for AGIs over 200k)
Profit/loss from business: +$21,384 (reported on 20.3% of returns)
Here:
+$21,384
State:
+$20,792
(% of AGI for various income ranges: 262.7% for AGIs below $25k, 407.4% for AGIs $25k-50k, 433.1% for AGIs $50k-75k, 726.6% for AGIs $75k-100k, 1254.8% for AGIs $100k-200k, 9967.8% for AGIs over 200k)
Taxable individual retirement arrangement distribution: $22,980 (reported on 13.9% of returns)
02632:
$22,980
Massachusetts:
$22,790
(% of AGI for various income ranges: 89.1% for AGIs below $25k, 197.1% for AGIs $25k-50k, 402.4% for AGIs $50k-75k, 729.4% for AGIs $75k-100k, 1333.4% for AGIs $100k-200k, 5537.8% for AGIs over 200k)
Self-employed (Keogh) retirement plans: $26,967 (reported on 0.9% of returns)
02632:
$26,967
Massachusetts:
$26,868
(% of AGI for various income ranges: 124.0% for AGIs $100k-200k, 998.9% for AGIs over 200k)
Total itemized deductions: $28,358 (reported on 14.4% of returns)
Here:
$28,358
State:
$36,722
(% of AGI for various income ranges: 163.9% for AGIs below $25k, 273.4% for AGIs $25k-50k, 687.4% for AGIs $50k-75k, 880.9% for AGIs $75k-100k, 1348.6% for AGIs $100k-200k, 7556.7% for AGIs over 200k)
Charity contributions: $5,447 (reported on 11.0% of returns)
Here:
$5,447
State:
$12,529
(% of AGI for various income ranges: 6.7% for AGIs below $25k, 19.2% for AGIs $25k-50k, 76.6% for AGIs $50k-75k, 84.0% for AGIs $75k-100k, 173.4% for AGIs $100k-200k, 1994.4% for AGIs over 200k)
Taxes paid: $7,799 (reported on 14.2% of returns)
02632:
$7,799
State:
$8,782
(% of AGI for various income ranges: 27.0% for AGIs below $25k, 60.0% for AGIs $25k-50k, 183.5% for AGIs $50k-75k, 285.1% for AGIs $75k-100k, 420.2% for AGIs $100k-200k, 1896.7% for AGIs over 200k)
Earned income credit: $1,581 (reported on 7.5% of returns)
Here:
$1,581
State:
$1,909
(% of AGI for various income ranges: 40.1% for AGIs below $25k, 39.8% for AGIs $25k-50k)
Percentage of individuals using paid preparers for their 2020 taxes: 91.4%
Here:
91%
State:
92%
(% for various income ranges: 87.9% for AGIs below $25k, 90.6% for AGIs $25k-50k, 93.1% for AGIs $50k-75k, 92.2% for AGIs $75k-100k, 94.1% for AGIs $100k-200k, 95.2% for AGIs over 200k)
Averages for the 2012 tax year for zip code 02632, filed in 2013:
Average Adjusted Gross Income (AGI) in 2012: $66,381 (Individual Income Tax Returns)
Here:
$66,381
State:
$81,425
Salary/wage: $53,438 (reported on 75.7% of returns)
Here:
$53,438
State:
$64,752
(% of AGI for various income ranges: 64.3% for AGIs below $25k, 66.1% for AGIs $25k-50k, 62.1% for AGIs $50k-75k, 60.8% for AGIs $75k-100k, 68.0% for AGIs $100k-200k, 49.9% for AGIs over 200k)
Taxable interest for individuals: $1,373 (reported on 42.3% of returns)
This zip code:
$1,373
Massachusetts:
$2,136
(% of AGI for various income ranges: 1.6% for AGIs below $25k, 0.8% for AGIs $25k-50k, 0.9% for AGIs $50k-75k, 1.0% for AGIs $75k-100k, 0.7% for AGIs $100k-200k, 0.9% for AGIs over 200k)
Ordinary dividends: $6,320 (reported on 28.4% of returns)
Here:
$6,320
State:
$9,473
(% of AGI for various income ranges: 4.1% for AGIs below $25k, 1.9% for AGIs $25k-50k, 2.4% for AGIs $50k-75k, 2.5% for AGIs $75k-100k, 2.0% for AGIs $100k-200k, 3.7% for AGIs over 200k)
Net capital gain/loss in AGI: +$12,318 (reported on 22.0% of returns)
Here:
+$12,318
State:
+$31,437
(% of AGI for various income ranges: 0.5% for AGIs $25k-50k, 0.9% for AGIs $75k-100k, 1.8% for AGIs $100k-200k, 12.9% for AGIs over 200k)
Profit/loss from business: +$16,327 (reported on 20.6% of returns)
Here:
+$16,327
State:
+$20,662
(% of AGI for various income ranges: 10.0% for AGIs below $25k, 8.7% for AGIs $25k-50k, 5.8% for AGIs $50k-75k, 4.7% for AGIs $75k-100k, 3.3% for AGIs $100k-200k, 4.0% for AGIs over 200k)
Taxable individual retirement arrangement distribution: $17,940 (reported on 16.9% of returns)
02632:
$17,940
Massachusetts:
$18,892
(% of AGI for various income ranges: 5.1% for AGIs below $25k, 4.3% for AGIs $25k-50k, 5.0% for AGIs $50k-75k, 5.8% for AGIs $75k-100k, 5.7% for AGIs $100k-200k, 2.5% for AGIs over 200k)
Self-employment retirement plans: $15,983 (reported on 1.1% of returns)
02632:
$15,983
Massachusetts:
$20,669
Total itemized deductions: $23,108 (21% of AGI, reported on 44.6% of returns)
Here:
$23,108
State:
$28,907
Here:
20.9% of AGI
State:
18.2% of AGI
(% of AGI for various income ranges: 20.2% for AGIs below $25k, 14.8% for AGIs $25k-50k, 17.1% for AGIs $50k-75k, 16.7% for AGIs $75k-100k, 15.8% for AGIs $100k-200k, 13.1% for AGIs over 200k)
Charity contributions: $2,497 (reported on 36.9% of returns)
Here:
$2,497
State:
$4,208
(% of AGI for various income ranges: 1.3% for AGIs below $25k, 1.1% for AGIs $25k-50k, 1.3% for AGIs $50k-75k, 1.4% for AGIs $75k-100k, 1.5% for AGIs $100k-200k, 1.5% for AGIs over 200k)
Taxes paid: $9,027 (reported on 44.6% of returns)
02632:
$9,027
State:
$13,303
(% of AGI for various income ranges: 4.2% for AGIs below $25k, 4.0% for AGIs $25k-50k, 5.3% for AGIs $50k-75k, 5.8% for AGIs $75k-100k, 6.7% for AGIs $100k-200k, 7.3% for AGIs over 200k)
Earned income credit: $1,716 (reported on 10.1% of returns)
Here:
$1,716
State:
$1,971
(% of AGI for various income ranges: 3.1% for AGIs below $25k, 0.6% for AGIs $25k-50k)
Percentage of individuals using paid preparers for their 2012 taxes: 60.1%
Here:
60%
State:
56%
(% for various income ranges: 54.1% for AGIs below $25k, 56.5% for AGIs $25k-50k, 62.8% for AGIs $50k-75k, 64.4% for AGIs $75k-100k, 68.4% for AGIs $100k-200k, 82.6% for AGIs over 200k)
Averages for the 2004 tax year for zip code 02632, filed in 2005:
Average Adjusted Gross Income (AGI) in 2004: $57,214 (Individual Income Tax Returns)
Here:
$57,214
State:
$62,877
Salary/wage: $45,652 (reported on 74.2% of returns)
Here:
$45,652
State:
$52,969
(% of AGI for various income ranges: 184.8% for AGIs below $10k, 59.7% for AGIs $10k-25k, 64.1% for AGIs $25k-50k, 65.6% for AGIs $50k-75k, 70.1% for AGIs $75k-100k, 50.3% for AGIs over 100k)
Taxable interest for individuals: $2,408 (reported on 59.8% of returns)
This zip code:
$2,408
Massachusetts:
$1,945
(% of AGI for various income ranges: 17.8% for AGIs below $10k, 4.4% for AGIs $10k-25k, 2.5% for AGIs $25k-50k, 1.8% for AGIs $50k-75k, 2.2% for AGIs $75k-100k, 2.4% for AGIs over 100k)
Taxable dividends: $4,147 (reported on 36.5% of returns)
Here:
$4,147
State:
$5,323
(% of AGI for various income ranges: 17.5% for AGIs below $10k, 3.8% for AGIs $10k-25k, 2.4% for AGIs $25k-50k, 2.0% for AGIs $50k-75k, 2.5% for AGIs $75k-100k, 2.7% for AGIs over 100k)
Net capital gain/loss: +$11,043 (reported on 29.8% of returns)
Here:
+$11,043
State:
+$20,377
(% of AGI for various income ranges: -11.2% for AGIs below $10k, 0.3% for AGIs $10k-25k, 1.1% for AGIs $25k-50k, 1.7% for AGIs $50k-75k, 2.0% for AGIs $75k-100k, 10.9% for AGIs over 100k)
Profit/loss from business: +$23,090 (reported on 20.4% of returns)
Here:
+$23,090
State:
+$17,837
(% of AGI for various income ranges: 17.1% for AGIs below $10k, 11.9% for AGIs $10k-25k, 7.4% for AGIs $25k-50k, 6.6% for AGIs $50k-75k, 5.4% for AGIs $75k-100k, 9.4% for AGIs over 100k)
IRA payment deduction: $3,567 (reported on 3.9% of returns)
02632:
$3,567
Massachusetts:
$3,100
(% of AGI for various income ranges: 0.4% for AGIs $10k-25k, 0.5% for AGIs $25k-50k, 0.3% for AGIs $50k-75k, 0.2% for AGIs $75k-100k, 0.1% for AGIs over 100k)
Self-employed pension: $13,770 (reported on 2.0% of returns)
Here:
$13,770
Massachusetts:
$14,516
(% of AGI for various income ranges: 0.2% for AGIs $25k-50k, 0.3% for AGIs $50k-75k, 0.3% for AGIs $75k-100k, 0.8% for AGIs over 100k)
Total itemized deductions: $20,484 (23% of AGI, reported on 50.0% of returns)
Here:
$20,484
State:
$22,573
Here:
23.1% of AGI
State:
19.5% of AGI
(% of AGI for various income ranges: 77.4% for AGIs below $10k, 22.8% for AGIs $10k-25k, 20.4% for AGIs $25k-50k, 20.6% for AGIs $50k-75k, 20.2% for AGIs $75k-100k, 14.0% for AGIs over 100k)
Charity contributions deductions: $2,514 (3% of AGI, reported on 44.5% of returns)
Here:
$2,514
State:
$3,295
Here:
2.7% of AGI
State:
2.7% of AGI
(% of AGI for various income ranges: 3.6% for AGIs below $10k, 1.5% for AGIs $10k-25k, 1.7% for AGIs $25k-50k, 2.1% for AGIs $50k-75k, 1.7% for AGIs $75k-100k, 2.1% for AGIs over 100k)
Total tax: $9,715 (reported on 81.9% of returns)
02632:
$9,715
State:
$11,494
(% of AGI for various income ranges: 7.8% for AGIs below $10k, 5.5% for AGIs $10k-25k, 7.7% for AGIs $25k-50k, 9.4% for AGIs $50k-75k, 10.0% for AGIs $75k-100k, 20.1% for AGIs over 100k)
Earned income credit: $1,272 (reported on 7.0% of returns)
Here:
$1,272
State:
$1,518
Percentage of individuals using paid preparers for their 2004 taxes: 62.6%
Here:
63%
State:
58%
(% for various income ranges: 53.7% for AGIs below $10k, 59.0% for AGIs $10k-25k, 61.3% for AGIs $25k-50k, 65.1% for AGIs $50k-75k, 66.4% for AGIs $75k-100k, 78.0% for AGIs over 100k)
Likely homosexual households (counted as self-reported same-sex unmarried-partner households)
Lesbian couples: 0.3% of all households
Gay men: 0.5% of all households
Household received Food Stamps/SNAP in the past 12 months: 338 Household did not receive Food Stamps/SNAP in the past 12 months: 4,357
Women who had a birth in the past 12 months: 269 (232 now married, 42 unmarried) Women who did not have a birth in the past 12 months: 1,881 (843 now married, 1,028 unmarried)
Housing units in zip code 02632 with a mortgage: 2,600 (590 second mortgage, 530 both second mortgage and home equity loan) Houses without a mortgage: 94
Median monthly owner costs for units with a mortgage: $2,279 Median monthly owner costs for units without a mortgage: $797
Residents with income below the poverty level in 2022:
This zip code:
7.2%
Whole state:
10.4%
Residents with income below 50% of the poverty level in 2022:
This zip code:
2.0%
Whole state:
5.1%
Median number of rooms in houses and condos:
Here:
6.6
State:
6.5
Median number of rooms in apartments:
Here:
5.0
State:
4.0
Notable locations in this zip code not listed on our city pages
Lakes and swamps: Scudder Bay (A), Wequaquet Lake (B), Shallow Pond (C), Long Pond (D), Lake Elizabeth (E), Bearse Pond (F), Lumbert Pond (G), Red Lily Pond (H). Display/hide their locations on the map
In group quarters: 111 (-1 institutionalized population)
Size of family households: 1,979 2-persons, 775 3-persons, 421 4-persons, 250 5-persons, 69 6-persons, 59 7-or-more-persons
Size of nonfamily households: 906 1-person, 270 2-persons, 32 3-persons
1,410 married couples with children.
348 single-parent households (81 men, 267 women).
82.9% of residents of 02632 zip code speak English at home.
0.9% of residents speak Spanish at home (90% very well, 5% well, 5% not at all).
15.1% of residents speak other Indo-European language at home (56% very well, 11% well, 31% not well, 2% not at all).
0.8% of residents speak Asian or Pacific Island language at home (54% very well, 46% well).
1.0% of residents speak other language at home (61% very well, 30% well, 9% not well).
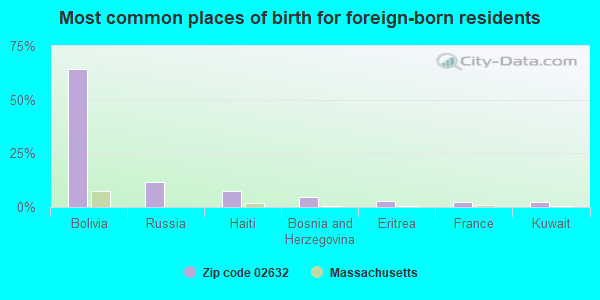
Foreign born population: 1,809 (15.2%) (43.4% of them are naturalized citizens)
This zip code:
15.2%
Whole state:
18.0%
64%Bolivia
12%Russia
7%Haiti
5%Bosnia and Herzegovina
3%Eritrea
2%France
2%Kuwait
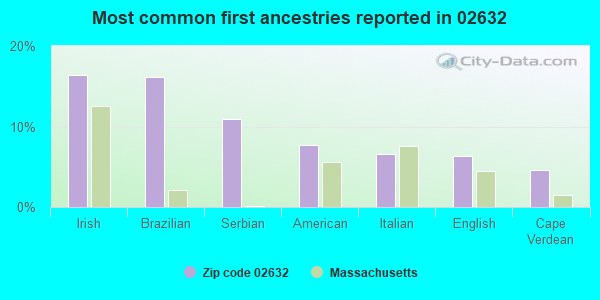
16%Irish
16%Brazilian
11%Serbian
8%American
7%Italian
6%English
5%Cape Verdean
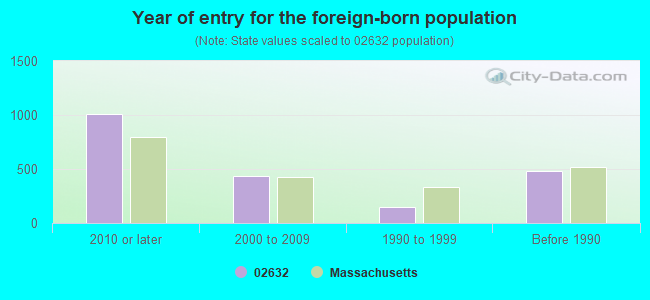
Year of entry for the foreign-born population
1,0122010 or later
4392000 to 2009
1471990 to 1999
483Before 1990
Facilities with environmental interests located in this zip code:
KENMARK OFFICE SYSTEMS (1678 FALMOUTH RD in CENTERVILLE, MA)
(Resource Conservation and Recovery Act (tracking hazardous waste)) Organizations: KEN PEDICINI (CONTACT/OWNER)
MSPCA CAPE COD BRANCH (1577 FALMOUTH RD in CENTERVILLE, MA)
AIR MINOR (AIRS/AFS) Business SIC classification: ANIMAL SPECIALTY SERVICES, EXCEPT VETERINARY Alternative names: MSPCA - CAPE COD
Housing units lacking complete plumbing facilities: 1.1% Housing units lacking complete kitchen facilities: 1.8%
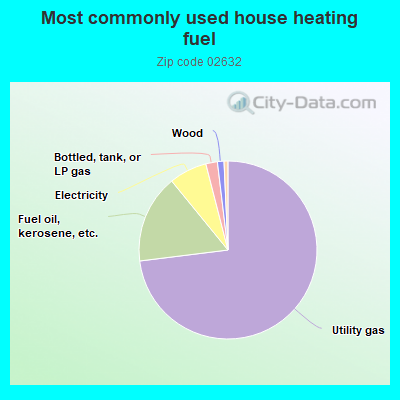
73.1%Utility gas
16.1%Fuel oil, kerosene, etc.
6.9%Electricity
2.1%Bottled, tank, or LP gas
1.2%Wood
Population in 1990: 10,636. Population change in the 1990s: +705 (+6.6%).
Place of birth for U.S.-born residents:
This state: 7,317
Northeast: 1,665
Midwest: 249
South: 512
West: 121
61% of the 02632 zip code residents lived in the same house 5 years ago. Out of people who lived in different houses, 54% lived in this county. Out of people who lived in different counties, 50% lived in Massachusetts.
94% of the 02632 zip code residents lived in the same house 1 year ago. Out of people who lived in different houses, 62% moved from this county. Out of people who lived in different houses, 12% moved from different county within same state. Out of people who lived in different houses, 22% moved from different state. Out of people who lived in different houses, 4% moved from abroad.
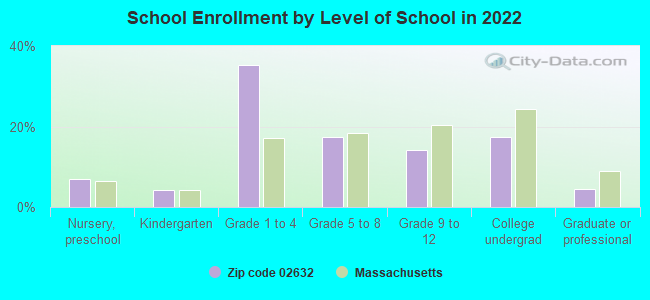
Private vs. public school enrollment:
Students in private schools in grades 1 to 8 (elementary and middle school): 18
Here:
1.8%
Massachusetts:
10.3%
Students in private schools in grades 9 to 12 (high school): 17
Here:
6.2%
Massachusetts:
12.3%
Students in private undergraduate colleges: 71
Here:
21.0%
Massachusetts:
51.2%
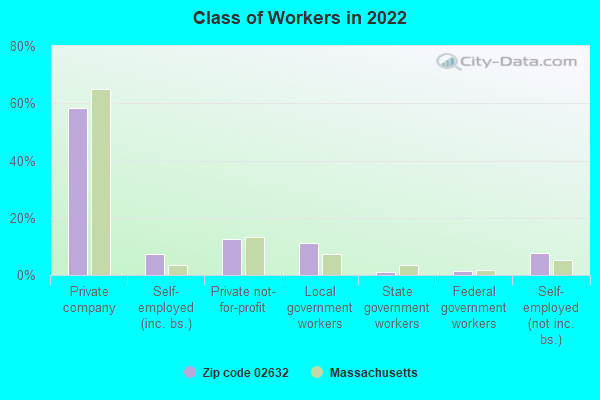
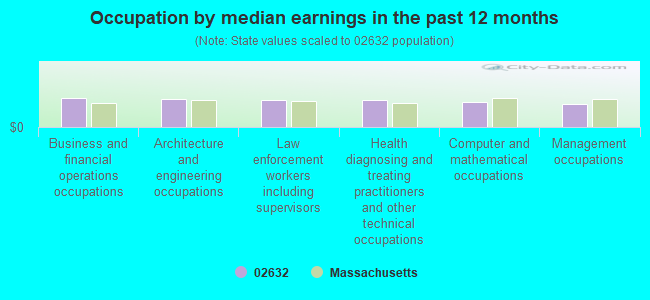
Occupation by median earnings in the past 12 months ($)
99,099Business and financial operations occupations
94,218Architecture and engineering occupations
93,234Law enforcement workers including supervisors
91,394Health diagnosing and treating practitioners and other technical occupations
85,525Computer and mathematical occupations
78,472Management occupations
Companies with federal contracts located in this zip code (CENTERVILLE, MA):
PAUL DUBIN CO ,INC (586 STRAWBERRY HILL ROAD; small business) : $218,562 in 7 contractsfrom 2001 to 2005
Contracts for Textile Fabrics, Household Furnishings by Army Signed by year:2000: $0; 2001: $107,352; 2002: $0; 2003: $111,380; 2004: $0; 2005: -$170; 2006: $0.
Biggest contracts:
$125,850 with Army for Textile Fabrics. Taking place in VT. Signed on 2003-06-25. Completion date: 2004-09-30.
$107,352 with Army for Textile Fabrics. Signed on 2001-09-18. Completion date: 2002-08-01.
$102,000 with Army for Textile Fabrics. Taking place in VT. Signed on 2003-09-24. Completion date: 2004-09-30.
$9,380 with Army for Household Furnishings. Taking place in HI. Signed on 2003-06-19. Completion date: 2003-07-18.
EASTERN COLLEGE ATHLETIC CONFE (1311 CRAIGVILLE BEACH RD) : $26,349 in 3 contractsfrom 2003 to 2004
$17,124 with Army for Other Professional Services. Taking place in NY. Signed on 2004-04-15. Completion date: 2004-05-02.
$4,700, same as above.Signed on 2004-08-04. Completion date: 2005-06-30.
$4,525, same as above.Signed on 2003-08-12. Completion date: 2004-06-30.
INOVA COMPUTERS, INC (1550 FALMOUTH ROAD, SUITE; small business) : $22,068 in 3 contractsfrom 2003 to 2004
$8,272 with Navy for ADP Input/Output and Storage Devices. Signed on 2003-12-31. Completion date: 2004-02-12.
$6,898, same as above.Signed on 2004-02-20. Completion date: 2004-03-19.
$6,898 with Navy for ADP Central Processing Unit (CPU, Computer), Analog. Signed on 2004-05-26. Completion date: 2004-07-16.
SCHILLING, THEODORE A (1550 FALMOUTH RD STE 10; small business) : $21,650 in 15 contractsfrom 2004 to 2005
Contracts for Other Professional Services, Real Property Appraisals Services (SIC 6531), Legal Services by U.S. Army Corps of Engineers - civil program financing only, Army Signed by year:2000: $0; 2001: $0; 2002: $0; 2003: $0; 2004: $11,000; 2005: $10,650; 2006: $0.
Biggest contracts:
$3,750 with U.S. Army Corps of Engineers - civil program financing only for Other Professional Services. Signed on 2005-03-18. Completion date: 2005-04-29.
$3,750 with Army for Other Professional Services. Signed on 2005-03-18. Completion date: 2005-04-29.
$2,500, same as above.Signed on 2005-05-20. Completion date: 2005-06-30.
$2,500, same as above.Signed on 2004-05-19. Completion date: 2004-06-22.
Top industries in this zip code by the number of employees in 2005:
Health Care and Social Assistance: Nursing Care Facilities (100-249 employees: 1 establishment)
2002 - 2018 National Fire Incident Reporting System (NFIRS) incidents
Based on the data from the years 2002 - 2018 the average number of fire incidents per year is 32. The highest number of fire incidents - 42 took place in 2008, and the least - 20 in 2014. The data has a decreasing trend.
When looking into fire subcategories, the most reports belonged to: Structure Fires (54.9%), and Outside Fires (31.2%).
Fire incident types reported to NFIRS in Zip Code 02632


 Nearest zip codes: 02672, 02647, 02601, 02655, 02668, 02630.


 Based on the data from the years 2002 - 2018 the average number of fire incidents per year is 32. The highest number of fire incidents - 42 took place in 2008, and the least - 20 in 2014. The data has a decreasing trend.
 When looking into fire subcategories, the most reports belonged to: Structure Fires (54.9%), and Outside Fires (31.2%).