Estimated zip code population in 2022: 19,866 Zip code population in 2010: 18,082 Zip code population in 2000: 18,370
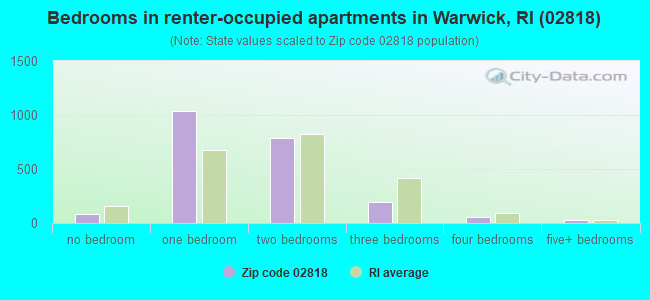
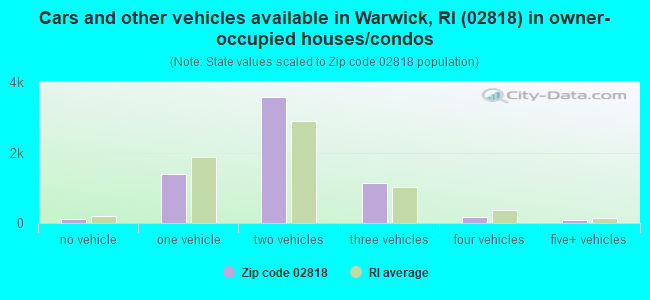
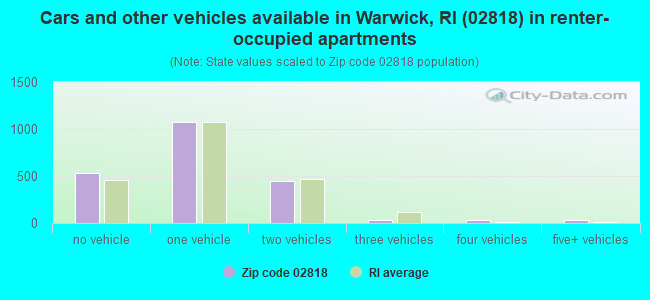
Houses and condos: 8,978 Renter-occupied apartments: 2,163
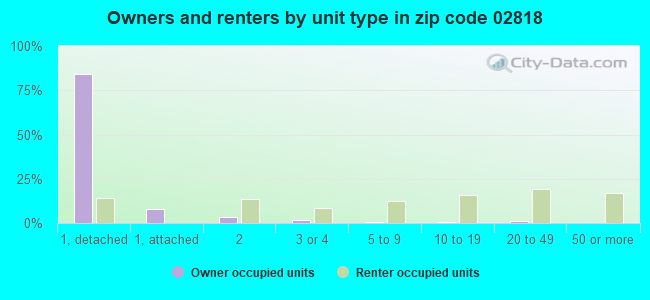
% of renters here:
25%
State:
37%
March 2022 cost of living index in zip code 02818: 92.1 (less than average, U.S. average is 100)
Land area: 21.8 sq. mi. Water area: 3.4 sq. mi.
Population density: 910 people per square mile
(low).
OSM Map
Google Map
MSN Map
OSM Map
General Map
Google Map
MSN Map
OSM Map
Google Map
MSN Map
OSM Map
Google Map
MSN Map
Please wait while loading the map...
Real estate property taxes paid for housing units in 2022:
This zip code:
1.6% ($9,078)
Rhode Island:
1.2% ($4,726)
Median real estate property taxes paid for housing units with mortgages in 2022: $9,841 (1.6%) Median real estate property taxes paid for housing units with no mortgage in 2022: $7,657 (1.5%)
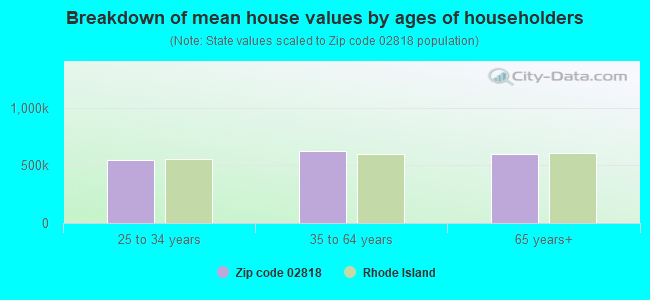
Estimated median house/condo value in 2022: $573,556
02818:
$573,556
Rhode Island:
$383,900
According to our research of Rhode Island and other state lists, there were 7 registered sex offenders living in 02818 zip code as of April 27, 2024. The ratio of all residents to sex offenders in zip code 02818 is 2,652 to 1. The ratio of registered sex offenders to all residents in this zip code is much lower than the state average.
Median resident age:
This zip code:
46.7 years
Rhode Island median age:
40.7 years
Average household size:
This zip code:
2.3 people
Rhode Island:
2.4 people
Averages for the 2020 tax year for zip code 02818, filed in 2021:
Average Adjusted Gross Income (AGI) in 2020: $145,819 (Individual Income Tax Returns)
Here:
$145,819
State:
$74,300
Salary/wage: $116,459 (reported on 77.9% of returns)
Here:
$116,459
State:
$60,330
(% of AGI for various income ranges: 1086.7% for AGIs below $25k, 3499.6% for AGIs $25k-50k, 5922.1% for AGIs $50k-75k, 9342.8% for AGIs $75k-100k, 19306.0% for AGIs $100k-200k, 105777.2% for AGIs over 200k)
Taxable interest for individuals: $3,060 (reported on 47.5% of returns)
This zip code:
$3,060
Rhode Island:
$1,971
(% of AGI for various income ranges: 37.1% for AGIs below $25k, 55.0% for AGIs $25k-50k, 81.6% for AGIs $50k-75k, 178.2% for AGIs $75k-100k, 243.1% for AGIs $100k-200k, 1771.9% for AGIs over 200k)
Ordinary dividends: $11,650 (reported on 39.7% of returns)
Here:
$11,650
State:
$7,621
(% of AGI for various income ranges: 58.6% for AGIs below $25k, 142.5% for AGIs $25k-50k, 198.5% for AGIs $50k-75k, 404.2% for AGIs $75k-100k, 679.2% for AGIs $100k-200k, 6337.2% for AGIs over 200k)
Net capital gain/loss in AGI: +$39,734 (reported on 35.5% of returns)
Here:
+$39,734
State:
+$26,041
(% of AGI for various income ranges: 72.6% for AGIs below $25k, 113.0% for AGIs $25k-50k, 172.0% for AGIs $50k-75k, 350.5% for AGIs $75k-100k, 980.7% for AGIs $100k-200k, 24227.4% for AGIs over 200k)
Profit/loss from business: +$30,107 (reported on 17.8% of returns)
Here:
+$30,107
State:
+$15,775
(% of AGI for various income ranges: 105.5% for AGIs below $25k, 201.0% for AGIs $25k-50k, 333.2% for AGIs $50k-75k, 358.2% for AGIs $75k-100k, 899.6% for AGIs $100k-200k, 6902.6% for AGIs over 200k)
Taxable individual retirement arrangement distribution: $24,970 (reported on 14.1% of returns)
02818:
$24,970
Rhode Island:
$18,801
(% of AGI for various income ranges: 113.3% for AGIs below $25k, 213.0% for AGIs $25k-50k, 325.6% for AGIs $50k-75k, 617.5% for AGIs $75k-100k, 1127.4% for AGIs $100k-200k, 2536.0% for AGIs over 200k)
Self-employed (Keogh) retirement plans: $26,037 (reported on 2.6% of returns)
02818:
$26,037
Rhode Island:
$23,424
(% of AGI for various income ranges: 26.1% for AGIs $25k-50k, 86.0% for AGIs $100k-200k, 1094.5% for AGIs over 200k)
Total itemized deductions: $34,824 (reported on 19.3% of returns)
Here:
$34,824
State:
$29,550
(% of AGI for various income ranges: 119.5% for AGIs below $25k, 241.6% for AGIs $25k-50k, 518.8% for AGIs $50k-75k, 807.5% for AGIs $75k-100k, 1421.4% for AGIs $100k-200k, 7501.5% for AGIs over 200k)
Charity contributions: $8,641 (reported on 16.1% of returns)
Here:
$8,641
State:
$7,826
(% of AGI for various income ranges: 14.8% for AGIs $25k-50k, 47.8% for AGIs $50k-75k, 83.0% for AGIs $75k-100k, 193.5% for AGIs $100k-200k, 2085.1% for AGIs over 200k)
Taxes paid: $9,236 (reported on 19.2% of returns)
02818:
$9,236
State:
$8,398
(% of AGI for various income ranges: 17.5% for AGIs below $25k, 64.3% for AGIs $25k-50k, 158.4% for AGIs $50k-75k, 288.7% for AGIs $75k-100k, 462.6% for AGIs $100k-200k, 1710.9% for AGIs over 200k)
Earned income credit: $1,290 (reported on 4.8% of returns)
Here:
$1,290
State:
$2,059
(% of AGI for various income ranges: 29.0% for AGIs below $25k, 22.6% for AGIs $25k-50k)
Percentage of individuals using paid preparers for their 2020 taxes: 93.1%
Here:
93%
State:
94%
(% for various income ranges: 91.4% for AGIs below $25k, 94.1% for AGIs $25k-50k, 92.9% for AGIs $50k-75k, 92.0% for AGIs $75k-100k, 92.6% for AGIs $100k-200k, 95.8% for AGIs over 200k)
Averages for the 2012 tax year for zip code 02818, filed in 2013:
Average Adjusted Gross Income (AGI) in 2012: $130,171 (Individual Income Tax Returns)
Here:
$130,171
State:
$60,628
Salary/wage: $97,091 (reported on 80.1% of returns)
Here:
$97,091
State:
$50,029
(% of AGI for various income ranges: 67.5% for AGIs below $25k, 69.4% for AGIs $25k-50k, 65.4% for AGIs $50k-75k, 64.4% for AGIs $75k-100k, 71.9% for AGIs $100k-200k, 53.9% for AGIs over 200k)
Taxable interest for individuals: $2,633 (reported on 52.6% of returns)
This zip code:
$2,633
Rhode Island:
$1,640
(% of AGI for various income ranges: 2.0% for AGIs below $25k, 1.7% for AGIs $25k-50k, 1.2% for AGIs $50k-75k, 1.2% for AGIs $75k-100k, 1.0% for AGIs $100k-200k, 1.0% for AGIs over 200k)
Ordinary dividends: $8,190 (reported on 40.7% of returns)
Here:
$8,190
State:
$6,396
(% of AGI for various income ranges: 4.0% for AGIs below $25k, 2.5% for AGIs $25k-50k, 2.5% for AGIs $50k-75k, 2.7% for AGIs $75k-100k, 2.4% for AGIs $100k-200k, 2.5% for AGIs over 200k)
Net capital gain/loss in AGI: +$26,033 (reported on 33.6% of returns)
Here:
+$26,033
State:
+$15,680
(% of AGI for various income ranges: 0.3% for AGIs $25k-50k, 0.9% for AGIs $50k-75k, 0.8% for AGIs $75k-100k, 1.4% for AGIs $100k-200k, 10.3% for AGIs over 200k)
Profit/loss from business: +$31,057 (reported on 17.5% of returns)
Here:
+$31,057
State:
+$15,678
(% of AGI for various income ranges: 8.4% for AGIs below $25k, 4.2% for AGIs $25k-50k, 4.3% for AGIs $50k-75k, 5.1% for AGIs $75k-100k, 4.8% for AGIs $100k-200k, 3.7% for AGIs over 200k)
Taxable individual retirement arrangement distribution: $21,330 (reported on 15.5% of returns)
02818:
$21,330
Rhode Island:
$14,081
(% of AGI for various income ranges: 4.6% for AGIs below $25k, 3.8% for AGIs $25k-50k, 4.0% for AGIs $50k-75k, 4.3% for AGIs $75k-100k, 3.7% for AGIs $100k-200k, 1.7% for AGIs over 200k)
Self-employment retirement plans: $21,888 (reported on 2.6% of returns)
02818:
$21,888
Rhode Island:
$18,642
(% of AGI for various income ranges: 0.8% for AGIs $50k-75k, 0.4% for AGIs $100k-200k, 0.5% for AGIs over 200k)
Total itemized deductions: $37,615 (17% of AGI, reported on 52.4% of returns)
Here:
$37,615
State:
$24,445
Here:
17.0% of AGI
State:
20.5% of AGI
(% of AGI for various income ranges: 19.2% for AGIs below $25k, 14.8% for AGIs $25k-50k, 18.5% for AGIs $50k-75k, 18.4% for AGIs $75k-100k, 19.1% for AGIs $100k-200k, 13.1% for AGIs over 200k)
Charity contributions: $4,389 (reported on 46.7% of returns)
Here:
$4,389
State:
$2,961
(% of AGI for various income ranges: 1.1% for AGIs below $25k, 1.0% for AGIs $25k-50k, 1.4% for AGIs $50k-75k, 1.5% for AGIs $75k-100k, 1.7% for AGIs $100k-200k, 1.6% for AGIs over 200k)
Taxes paid: $20,881 (reported on 52.4% of returns)
02818:
$20,881
State:
$11,235
(% of AGI for various income ranges: 5.6% for AGIs below $25k, 5.2% for AGIs $25k-50k, 7.6% for AGIs $50k-75k, 8.8% for AGIs $75k-100k, 10.0% for AGIs $100k-200k, 8.3% for AGIs over 200k)
Earned income credit: $1,535 (reported on 5.9% of returns)
Here:
$1,535
State:
$2,170
(% of AGI for various income ranges: 2.3% for AGIs below $25k, 0.4% for AGIs $25k-50k)
Percentage of individuals using paid preparers for their 2012 taxes: 62.2%
Here:
62%
State:
60%
(% for various income ranges: 52.8% for AGIs below $25k, 55.8% for AGIs $25k-50k, 61.7% for AGIs $50k-75k, 69.2% for AGIs $75k-100k, 65.9% for AGIs $100k-200k, 79.6% for AGIs over 200k)
Averages for the 2004 tax year for zip code 02818, filed in 2005:
Average Adjusted Gross Income (AGI) in 2004: $109,471 (Individual Income Tax Returns)
Here:
$109,471
State:
$51,090
Salary/wage: $91,803 (reported on 79.8% of returns)
Here:
$91,803
State:
$43,690
(% of AGI for various income ranges: 196.7% for AGIs below $10k, 62.4% for AGIs $10k-25k, 71.3% for AGIs $25k-50k, 71.9% for AGIs $50k-75k, 72.4% for AGIs $75k-100k, 65.2% for AGIs over 100k)
Taxable interest for individuals: $3,138 (reported on 68.6% of returns)
This zip code:
$3,138
Rhode Island:
$1,567
(% of AGI for various income ranges: 17.1% for AGIs below $10k, 4.3% for AGIs $10k-25k, 2.7% for AGIs $25k-50k, 2.0% for AGIs $50k-75k, 2.0% for AGIs $75k-100k, 1.8% for AGIs over 100k)
Taxable dividends: $6,050 (reported on 47.3% of returns)
Here:
$6,050
State:
$3,896
(% of AGI for various income ranges: 18.9% for AGIs below $10k, 4.0% for AGIs $10k-25k, 2.5% for AGIs $25k-50k, 2.5% for AGIs $50k-75k, 2.5% for AGIs $75k-100k, 2.5% for AGIs over 100k)
Net capital gain/loss: +$15,667 (reported on 39.6% of returns)
Here:
+$15,667
State:
+$15,829
(% of AGI for various income ranges: -8.9% for AGIs below $10k, 1.0% for AGIs $10k-25k, 1.0% for AGIs $25k-50k, 1.5% for AGIs $50k-75k, 1.5% for AGIs $75k-100k, 7.0% for AGIs over 100k)
Profit/loss from business: +$29,794 (reported on 17.1% of returns)
Here:
+$29,794
State:
+$15,557
(% of AGI for various income ranges: 9.5% for AGIs below $10k, 6.0% for AGIs $10k-25k, 4.4% for AGIs $25k-50k, 4.3% for AGIs $50k-75k, 4.7% for AGIs $75k-100k, 4.6% for AGIs over 100k)
IRA payment deduction: $3,464 (reported on 4.0% of returns)
02818:
$3,464
Rhode Island:
$3,092
(% of AGI for various income ranges: 0.5% for AGIs $10k-25k, 0.4% for AGIs $25k-50k, 0.3% for AGIs $50k-75k, 0.3% for AGIs $75k-100k, 0.1% for AGIs over 100k)
Self-employed pension: $19,068 (reported on 3.2% of returns)
Here:
$19,068
Rhode Island:
$14,597
(% of AGI for various income ranges: 0.3% for AGIs $25k-50k, 0.2% for AGIs $50k-75k, 0.4% for AGIs $75k-100k, 0.6% for AGIs over 100k)
Total itemized deductions: $32,719 (18% of AGI, reported on 53.2% of returns)
Here:
$32,719
State:
$20,228
Here:
17.6% of AGI
State:
21.1% of AGI
(% of AGI for various income ranges: 31.8% for AGIs below $10k, 17.2% for AGIs $10k-25k, 16.0% for AGIs $25k-50k, 19.2% for AGIs $50k-75k, 20.5% for AGIs $75k-100k, 15.1% for AGIs over 100k)
Charity contributions deductions: $4,634 (2% of AGI, reported on 50.4% of returns)
Here:
$4,634
State:
$2,620
Here:
2.4% of AGI
State:
2.6% of AGI
(% of AGI for various income ranges: 0.8% for AGIs below $10k, 1.4% for AGIs $10k-25k, 1.5% for AGIs $25k-50k, 2.1% for AGIs $50k-75k, 2.3% for AGIs $75k-100k, 2.2% for AGIs over 100k)
Total tax: $26,962 (reported on 82.5% of returns)
02818:
$26,962
State:
$8,437
(% of AGI for various income ranges: 6.3% for AGIs below $10k, 5.2% for AGIs $10k-25k, 8.4% for AGIs $25k-50k, 10.1% for AGIs $50k-75k, 10.4% for AGIs $75k-100k, 23.6% for AGIs over 100k)
Earned income credit: $1,187 (reported on 4.3% of returns)
Here:
$1,187
State:
$1,659
Percentage of individuals using paid preparers for their 2004 taxes: 63.2%
Here:
63%
State:
63%
(% for various income ranges: 56.0% for AGIs below $10k, 60.0% for AGIs $10k-25k, 58.3% for AGIs $25k-50k, 63.8% for AGIs $50k-75k, 64.1% for AGIs $75k-100k, 72.7% for AGIs over 100k)
Likely homosexual households (counted as self-reported same-sex unmarried-partner households)
Lesbian couples: 0.3% of all households
Gay men: 0.1% of all households
Household received Food Stamps/SNAP in the past 12 months: 421 Household did not receive Food Stamps/SNAP in the past 12 months: 8,297
Women who had a birth in the past 12 months: 215 (199 now married, 17 unmarried) Women who did not have a birth in the past 12 months: 3,834 (2,137 now married, 1,720 unmarried)
Housing units in zip code 02818 with a mortgage: 4,436 (689 second mortgage, 14 home equity loan, 640 both second mortgage and home equity loan) Houses without a mortgage: 249
Median monthly owner costs for units with a mortgage: $3,168 Median monthly owner costs for units without a mortgage: $1,189
Residents with income below the poverty level in 2022:
This zip code:
5.6%
Whole state:
10.8%
Residents with income below 50% of the poverty level in 2022:
This zip code:
2.9%
Whole state:
5.6%
Median number of rooms in houses and condos:
Here:
7.4
State:
6.2
Median number of rooms in apartments:
Here:
3.8
State:
4.1
Notable locations in this zip code not listed on our city pages
Notable locations in zip code 02818: Allens Corner (A), Allens Grist Mill (B), Spencer Mill (C), East Greenwich Golf Course (D), Rocky Hill Fairgrounds (E), Goddard State Park Golf Course (F), H K Jenks Forge (G), Potowomut Golf Club (H), Windmill Cottage (I), Warwick Musical Theatre (J), Warwick Museum of Art (K), Varnum Military Museum (L), Varnum Memorial Armory (M), Varnum House Museum (N), Kent County Courthouse (O), East Greenwich Free Library (P), East Greenwich Fire District Station 2 (Q), London Bridge Child Care Center (R), East Greenwich Town Hall (S), East Greenwich Police Department (T). Display/hide their locations on the map
Churches in zip code 02818 include: United Church of Christ (A), Frenchtown Baptist Church (B), First Evangelical Lutheran Church (C), East Greenwich United Methodist Church (D), East Greenwich Baptist Church (E), Saint Lukes Episcopal Church (F). Display/hide their locations on the map
Cemeteries: Captain Joseph Spencer Lot (1), Chafee Lot (2), David Bennett Lot (3), East Greenwich Cemetery (4), East Greenwich Historical Cemetery Number 1 (5), East Greenwich Historical Cemetery Number 2 (6), East Greenwich Historical Cemetery Number 3 (7). Display/hide their locations on the map
Streams, rivers, and creeks: Mawney Brook (A), Fry Brook (B), Frenchtown Brook (C), Potowomut River (D), Hunt River (E), Maskerchugg River (F), Dark Entry Brook (G). Display/hide their locations on the map
Parks in zip code 02818 include: Davis Memorial Wildlife Refuge (1), Goddard Memorial State Park (2), East Greenwich Historic District (3). Display/hide their locations on the map
In group quarters: 204 (-1 institutionalized population)
Size of family households: 2,248 2-persons, 1,377 3-persons, 1,094 4-persons, 447 5-persons, 59 6-persons, 36 7-or-more-persons
Size of nonfamily households: 2,618 1-person, 739 2-persons, 26 4-persons
3,935 married couples with children.
185 single-parent households (84 men, 101 women).
90.6% of residents of 02818 zip code speak English at home.
2.1% of residents speak Spanish at home (75% very well, 23% well, 3% not well).
3.3% of residents speak other Indo-European language at home (85% very well, 9% well, 7% not well).
4.4% of residents speak Asian or Pacific Island language at home (60% very well, 40% well).
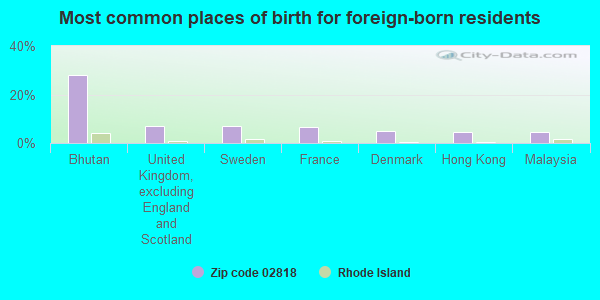
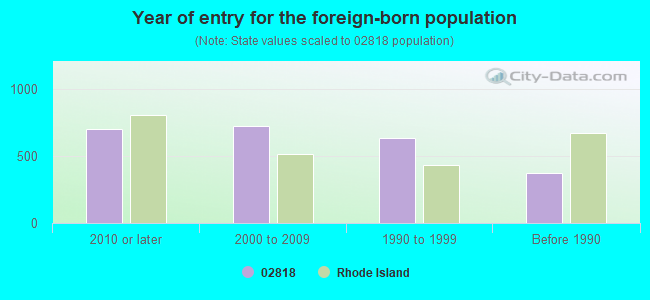
Foreign born population: 2,105 (10.6%) (60.6% of them are naturalized citizens)
Major facilities with environmental interests located in this zip code:
AMERICAN BIOPHYSICS CORPORATION (2240 SOUTH COUNTY TRAIL in EAST GREENWICH, RI)
ENFORCEMENT/COMPLIANCE ACTIVITY (Integrated Compliance Information System) - ICIS-01-2003-0039, FORMAL ENFORCEMENT ACTION (Integrated Compliance Information System) - ICIS-01-2003-0039, FORMAL ENFORCEMENT ACTION COMPLIANCE ACTIVITY (Tracking inspections of insecticide, fungicide, and rodenticide, and toxic substances) Alternative names: AMERICAN BIOPHYSICS (BRUCE WIGTON)
EAST GREENWICH PARKS & GROUNDS GARAGE (20 CROMPTON RD in EAST GREENWICH, RI)
ENFORCEMENT/COMPLIANCE ACTIVITY (Integrated Compliance Information System) - ICIS-01-2003-9073, FORMAL ENFORCEMENT ACTION (Integrated Compliance Information System) - ICIS-01-2003-9073, FORMAL ENFORCEMENT ACTION
EAST GREENWICH RI HIGHWAY GARAGE (2 BEAR SWAMP RD in EAST GREENWICH, RI)
ENFORCEMENT/COMPLIANCE ACTIVITY (Integrated Compliance Information System) - ICIS-01-2003-9073, FORMAL ENFORCEMENT ACTION (Integrated Compliance Information System) - ICIS-01-2003-9073, FORMAL ENFORCEMENT ACTION
EAST GREENWICH RI WWTF (21 CROMPTON RD in EAST GREENWICH, RI)
ENFORCEMENT/COMPLIANCE ACTIVITY (Integrated Compliance Information System) - ICIS-01-2003-9073, FORMAL ENFORCEMENT ACTION (Integrated Compliance Information System) - ICIS-01-2003-9073, FORMAL ENFORCEMENT ACTION
DEBLOIS OIL COMPANY (2579 S COUNTY TRL in EAST GREENWICH, RI)
National Pollutant Discharge Elimination System NON-MAJOR (Tracking pollutant discharge elimination systems) - permit - ICIS-, ENFORCEMENT/COMPLIANCE ACTIVITY Small Quantity Generators, between 100 kg and 1000 kg of hazardous waste/month (Resource Conservation and Recovery Act (tracking hazardous waste)) - notification Business SIC classification: FUEL OIL DEALERS Business NAICS classification: HEATING OIL DEALERS. Organizations: PETRO HOLDINGS, INC. (CONTACT/OWNER)
, PETROLEUM HEAT & POWER CO., INC. (CONTACT/OWNER)
Alternative names: DEBLOIS OIL CO/EAST GREENWICH DIVISION
AMERICAN INDUSTRIAL CASTING, INC. (ONE AMERICAN WAY in EAST GREENWICH, RI)
AIR MINOR (AIRS/AFS) National Pollutant Discharge Elimination System NON-MAJOR (Tracking pollutant discharge elimination systems) - permit (Resource Conservation and Recovery Act (tracking hazardous waste)) Business SIC classification: ALUMINUM FOUNDRIES; NONCLASSIFIABLE ESTABLISHMENTS Organizations: BERETEC PROPERTIES, LLC (CONTACT/OWNER)
, BERATEC PROPERTIES LLC (CONTACT/OWNER)
Alternative names: AMERICAN IDNUSTRIAL CASTING, I
ON SEMICONDUCTOR DEVELOPMENT CENTER (2000 SOUTH COUNTY TRAIL in EAST GREENWICH, RI)
AIR MINOR (AIRS/AFS) ENFORCEMENT/COMPLIANCE ACTIVITY (Integrated Compliance Information System) CRITERIA AND HAZARDOUS AIR POLLUTANT INVENTORY (Inventory of air pollution sources) HAZARDOUS WASTE BIENNIAL REPORTER (Resource Conservation and Recovery Act (tracking hazardous waste)) (Resource Conservation and Recovery Act (tracking hazardous waste)) TRI REPORTER (Tracking of toxic chemicals releasing facilities) Business SIC classification: SEMICONDUCTORS AND RELATED DEVICES Business NAICS classification: SEMICONDUCTOR AND RELATED DEVICE MANUFACTURING.; SEMICONDUCTOR AND RELATED DEVICE MANUFACTURING. Organizations: SEMICONDUCTOR COMPONENTS IND OF RI INC (CONTACT/OWNER)
Alternative names: CHERRY SEMICONDUCTOR, SEMICONDUCTOR COMPONENT INDUSTRIES OF RI INC, SEMICONDUCTOR COMPONENTS IND. OF RI INC., SEMICONDUCTOR COMPONENTS INDS. OF RI INC.
OCEAN MITSUBISHI (870 QUAKER LANE in WARWICK, RI)
Conditionally Exempt Small Quantity Generators, less than 100 kg/month of hazardous waste (Resource Conservation and Recovery Act (tracking hazardous waste)) - notification (Resource Conservation and Recovery Act (tracking hazardous waste)) Organizations: OWNERNAME (CONTACT/OWNER)
, J G ONIELL JR INC (CONTACT/OWNER)
, CENTURY AUTOMOTIVE INC (CONTACT/OWNER)
Alternative names: CENTURY MITSUBISHI, HURD MITSUBISHI
GEORGE HANAFORD SCHOOL (LEBARON DRIVE in EAST GREENWICH, RI)
(Geographic Names Information System) (National Center for Education Statistics) - STATE ID-09108 Organizations: EAST GREENWICH SCH DIST (SCHOOL DISTRICT)
FRENCHTOWN SCHOOL (FRENCHTOWN ROAD in EAST GREENWICH, RI)
(Geographic Names Information System) (National Center for Education Statistics) - STATE ID-09105 Organizations: EAST GREENWICH SCH DIST (SCHOOL DISTRICT)
MEADOWBROOK FARMS SCHOOL (2 CHESTNUT DRIVE in EAST GREENWICH, RI)
(Geographic Names Information System) (National Center for Education Statistics) - STATE ID-09107 Organizations: EAST GREENWICH SCH DIST (SCHOOL DISTRICT)
JAMES H. ELDREDGE SCHOOL (FIRST AVENUE in EAST GREENWICH, RI)
(Geographic Names Information System) (National Center for Education Statistics) - STATE ID-09102 Organizations: EAST GREENWICH SCH DIST (SCHOOL DISTRICT)
ARCHIE R. COLE JR. HIGH (100 CEDAR AVENUE in EAST GREENWICH, RI)
(National Center for Education Statistics) - STATE ID-09103 Organizations: EAST GREENWICH SCH DIST (SCHOOL DISTRICT)
Housing units lacking complete plumbing facilities: 0.1% Housing units lacking complete kitchen facilities: 1.5%
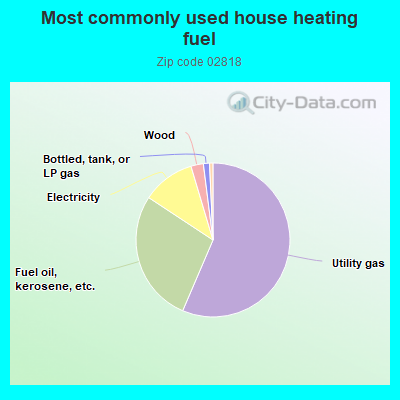
56.4%Utility gas
27.8%Fuel oil, kerosene, etc.
11.1%Electricity
2.6%Wood
1.3%Bottled, tank, or LP gas
Population in 1990: 16,180. Population change in the 1990s: +2,190 (+13.5%).
Place of birth for U.S.-born residents:
This state: 10,026
Northeast: 4,715
Midwest: 873
South: 1,202
West: 790
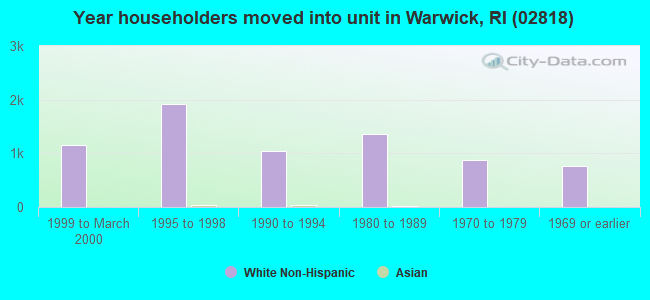
61% of the 02818 zip code residents lived in the same house 5 years ago. Out of people who lived in different houses, 38% lived in this county. Out of people who lived in different counties, 50% lived in Rhode Island.
93% of the 02818 zip code residents lived in the same house 1 year ago. Out of people who lived in different houses, 33% moved from this county. Out of people who lived in different houses, 32% moved from different county within same state. Out of people who lived in different houses, 25% moved from different state. Out of people who lived in different houses, 9% moved from abroad.
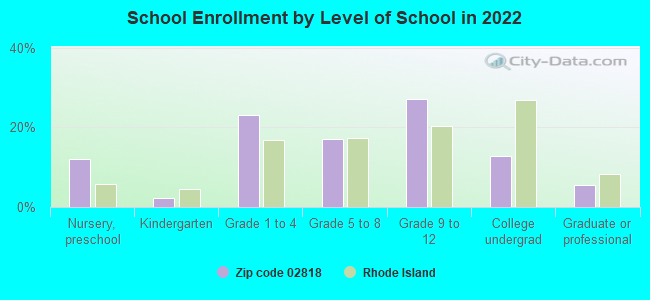
Private vs. public school enrollment:
Students in private schools in grades 1 to 8 (elementary and middle school): 184
Here:
10.4%
Rhode Island:
12.2%
Students in private schools in grades 9 to 12 (high school): 165
Here:
13.7%
Rhode Island:
11.6%
Students in private undergraduate colleges: 236
Here:
42.1%
Rhode Island:
41.1%
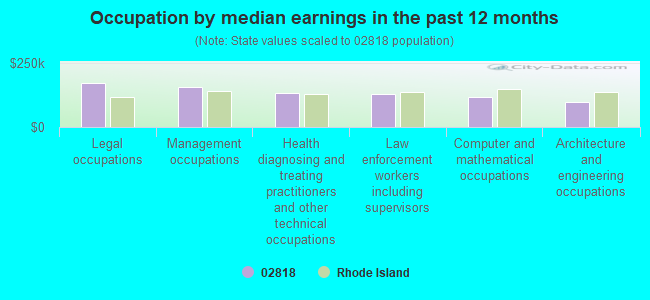
Occupation by median earnings in the past 12 months ($)
171,067Legal occupations
154,229Management occupations
133,997Health diagnosing and treating practitioners and other technical occupations
128,549Law enforcement workers including supervisors
117,934Computer and mathematical occupations
97,698Architecture and engineering occupations
Companies with federal contracts located in this zip code (EAST GREENWICH, RI):
ROBERT F AUDET, INC (2883 S COUNTY TRL; small business) : $2,233,907 in 12 contractsfrom 2000 to 2005
Contracts for Maintenance, Repair or Alteration of Real Property -- Other Utilities, Maintenance, Repair or Alteration of Real Property -- Fuel Supply Facilities by Navy Signed by year:2000: $2,168,380; 2001: $11,154; 2002: $17,467; 2003: $20,982; 2004: $0; 2005: $15,924; 2006: $0.
Biggest contracts:
$1,541,080 with Navy for Maintenance, Repair or Alteration of Real Property -- Other Utilities. Signed on 2000-12-28. Completion date: 2001-06-12.
$627,300, same as above.Signed on 2000-09-29. Completion date: 2001-06-12.
$11,154 with Navy for Maintenance, Repair or Alteration of Real Property -- Other Utilities. Taking place in CT. Signed on 2001-08-23. Completion date: 2001-11-06.
$8,120 with Navy for Maintenance, Repair or Alteration of Real Property -- Other Utilities. Signed on 2003-02-04. Completion date: 2002-12-13.
ADVANCED COMPONENTS & MATERIAL (1360 HIGH HAWK ROAD; small business) : $911,495 in 8 contractsfrom 2000 to 2005
Contracts for Defense Aircraft -- Management and Support (R&D), Defense Aircraft -- Applied Research and Exploratory Development (R&D) by Air Force Signed by year:2000: $99,527; 2001: $375,000; 2002: $336,071; 2003: $0; 2004: $22,423; 2005: $78,474; 2006: $0.
Biggest contracts:
$375,000 with Air Force for Defense Aircraft -- Management and Support (R&D). Signed on 2001-07-24. Completion date: 2004-12-26.
$315,572, same as above.Signed on 2002-06-10. Completion date: 2004-12-26.
$99,527 with Air Force for Defense Aircraft -- Management and Support (R&D). Taking place in WI. Signed on 2000-05-05. Completion date: 2001-03-12.
$50,478 with Air Force for Defense Aircraft -- Applied Research and Exploratory Development (R&D). Signed on 2005-05-23. Completion date: 2003-11-17.
ADVANTECH BUSINESS BUILDERS, I (5600 POST RD #114-175; small business) : $81,500 in 3 contractsin 2005
$57,000 with Navy for Construction of Structures and Facilities -- Exhibit Design (Non-Building). Signed on 2005-09-06. Completion date: 2005-12-01.
$14,500 with Navy for Program Management/Support Services. Signed on 2005-12-21. Completion date: 2006-09-30.
$10,000 with Navy for Other Professional Services. Signed on 2005-05-12. Completion date: 2005-12-01.
AMERICAN INDUSTRIAL CASTING, I (ONE AMERICAN WAY; small business) : $46,464 in 10 contractsfrom 1999 to 2005
Contracts for Other Defense -- Advanced Development (R&D), Guns, over 150 mm through 200 mm, Guns, 75 mm through 125 mm, Maintenance, Repair and Rebuilding of Equipment -- Ammunition and Explosives by Air Force, Army, Navy Signed by year:2000: $0; 2001: $0; 2002: -$199,836; 2003: $0; 2004: $23,129; 2005: $679; 2006: $0.
Biggest contracts:
$222,492 with Air Force for Other Defense -- Advanced Development (R&D). Signed on 1999-11-10. Completion date: 2000-03-31.
$11,599 with Army for Guns, over 150 mm through 200 mm. Signed on 2004-07-27. Completion date: 2004-11-01.
$2,770 with Army for Guns, 75 mm through 125 mm. Signed on 2004-08-05. Completion date: 2004-11-18.
$2,770, same as above.Signed on 2004-09-09. Completion date: 2004-12-01.
EPAC SOFTWARE TECHNOLOGY INC (42 LADD STREET; small business)
$37,556 with Army for ADP Components. Taking place in MD. Signed on 2005-09-30. Completion date: 2005-10-31.
STANLEY-BOSTITCH INC (ROUTE 2 SOUTH COUNTY TRAIL)
$2,634 with Defense Logistics Agency for Nails, Machine Keys, and Pins. Signed on 2005-03-11. Completion date: 2005-04-01.
IDEAL WINDLASS CO (5810 POST ROAD; small business)
-$8,720 with Navy for Marine Hardware and Hull Items. Signed on 2005-07-09. Completion date: 2000-07-14.
Top industries in this zip code by the number of employees in 2005:
Management of Companies and Enterprises: Corporate, Subsidiary, and Regional Managing Offices (500-999 employees: 1 establishment, 100-249 employees: 1 establishment)
2003 - 2018 National Fire Incident Reporting System (NFIRS) incidents
Based on the data from the years 2003 - 2018 the average number of fires per year is 25. The highest number of reported fire incidents - 59 took place in 2018, and the least - 0 in 2004. The data has a rising trend.
When looking into fire subcategories, the most reports belonged to: Outside Fires (37.9%), and Structure Fires (27.4%).
Fire incident types reported to NFIRS in Zip Code 02818


 Nearest zip codes: 02893, 02852, 02886, 02889, 02920, 02921.


 Based on the data from the years 2003 - 2018 the average number of fires per year is 25. The highest number of reported fire incidents - 59 took place in 2018, and the least - 0 in 2004. The data has a rising trend.
 When looking into fire subcategories, the most reports belonged to: Outside Fires (37.9%), and Structure Fires (27.4%).