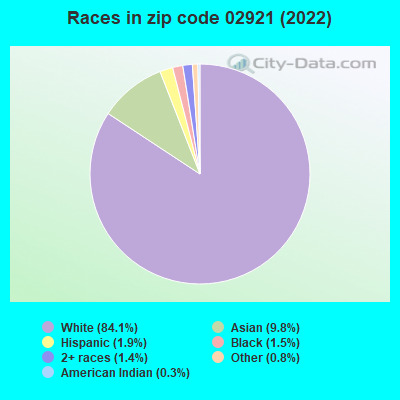
Estimated zip code population in 2022: 12,199 Zip code population in 2010: 12,361 Zip code population in 2000: 10,775
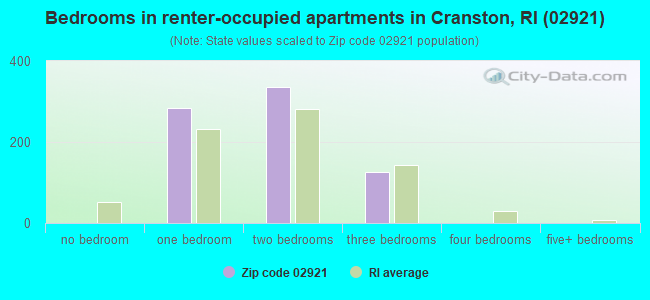
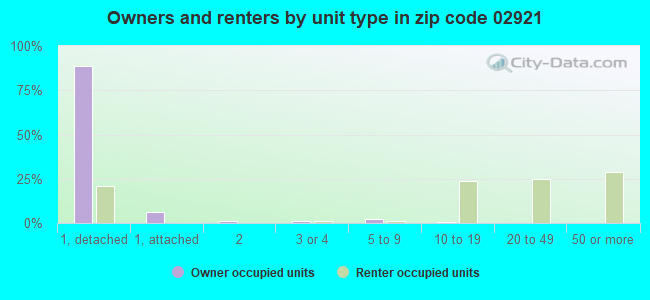
Houses and condos: 4,767 Renter-occupied apartments: 756
% of renters here:
16%
State:
37%
March 2022 cost of living index in zip code 02921: 91.4 (less than average, U.S. average is 100)
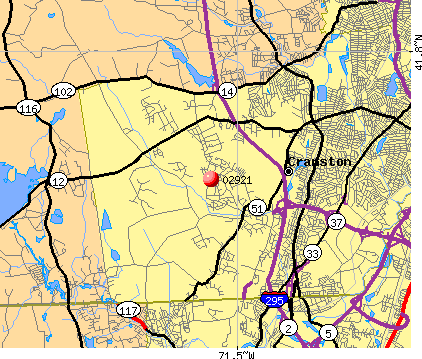
Land area: 13.1 sq. mi. Water area: 0.1 sq. mi.
Population density: 928 people per square mile
(low).
OSM Map
Google Map
MSN Map
OSM Map
General Map
Google Map
MSN Map
OSM Map
Google Map
MSN Map
OSM Map
Google Map
MSN Map
Please wait while loading the map...
Real estate property taxes paid for housing units in 2022:
This zip code:
1.4% ($7,334)
Rhode Island:
1.2% ($4,726)
Median real estate property taxes paid for housing units with mortgages in 2022: $7,923 (1.5%) Median real estate property taxes paid for housing units with no mortgage in 2022: $6,475 (1.3%)
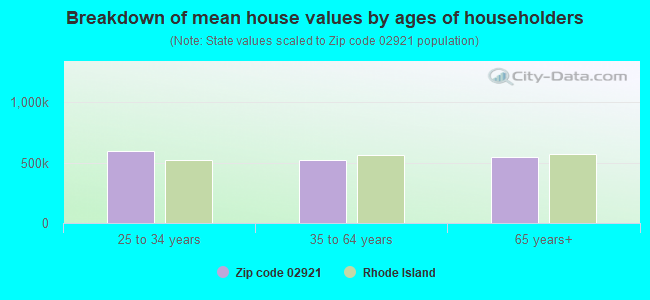
Estimated median house/condo value in 2022: $518,953
02921:
$518,953
Rhode Island:
$383,900
According to our research of Rhode Island and other state lists, there were 4 registered sex offenders living in 02921 zip code as of April 27, 2024. The ratio of all residents to sex offenders in zip code 02921 is 3,185 to 1. The ratio of registered sex offenders to all residents in this zip code is much lower than the state average.
Median resident age:
This zip code:
43.3 years
Rhode Island median age:
40.7 years
Average household size:
This zip code:
2.5 people
Rhode Island:
2.4 people
Averages for the 2020 tax year for zip code 02921, filed in 2021:
Average Adjusted Gross Income (AGI) in 2020: $115,005 (Individual Income Tax Returns)
Here:
$115,005
State:
$74,300
Salary/wage: $90,723 (reported on 84.3% of returns)
Here:
$90,723
State:
$60,330
(% of AGI for various income ranges: 1188.8% for AGIs below $25k, 3557.9% for AGIs $25k-50k, 6620.4% for AGIs $50k-75k, 9713.6% for AGIs $75k-100k, 20986.8% for AGIs $100k-200k, 80967.5% for AGIs over 200k)
Taxable interest for individuals: $2,557 (reported on 43.7% of returns)
This zip code:
$2,557
Rhode Island:
$1,971
(% of AGI for various income ranges: 35.7% for AGIs below $25k, 50.4% for AGIs $25k-50k, 71.6% for AGIs $50k-75k, 108.4% for AGIs $75k-100k, 179.8% for AGIs $100k-200k, 1724.6% for AGIs over 200k)
Ordinary dividends: $5,706 (reported on 32.4% of returns)
Here:
$5,706
State:
$7,621
(% of AGI for various income ranges: 44.0% for AGIs below $25k, 65.4% for AGIs $25k-50k, 84.8% for AGIs $50k-75k, 184.7% for AGIs $75k-100k, 344.0% for AGIs $100k-200k, 2855.0% for AGIs over 200k)
Net capital gain/loss in AGI: +$18,102 (reported on 29.2% of returns)
Here:
+$18,102
State:
+$26,041
(% of AGI for various income ranges: 16.3% for AGIs below $25k, 66.9% for AGIs $25k-50k, 157.7% for AGIs $50k-75k, 169.8% for AGIs $75k-100k, 603.7% for AGIs $100k-200k, 11234.2% for AGIs over 200k)
Profit/loss from business: +$19,034 (reported on 16.0% of returns)
Here:
+$19,034
State:
+$15,775
(% of AGI for various income ranges: 92.5% for AGIs below $25k, 184.9% for AGIs $25k-50k, 262.9% for AGIs $50k-75k, 265.3% for AGIs $75k-100k, 580.2% for AGIs $100k-200k, 4133.3% for AGIs over 200k)
Taxable individual retirement arrangement distribution: $17,758 (reported on 11.0% of returns)
02921:
$17,758
Rhode Island:
$18,801
(% of AGI for various income ranges: 75.7% for AGIs below $25k, 149.6% for AGIs $25k-50k, 206.6% for AGIs $50k-75k, 390.0% for AGIs $75k-100k, 596.1% for AGIs $100k-200k, 1130.8% for AGIs over 200k)
Self-employed (Keogh) retirement plans: $28,062 (reported on 1.2% of returns)
02921:
$28,062
Rhode Island:
$23,424
(% of AGI for various income ranges: 47.7% for AGIs $100k-200k, 752.5% for AGIs over 200k)
Total itemized deductions: $28,126 (reported on 15.4% of returns)
Here:
$28,126
State:
$29,550
(% of AGI for various income ranges: 121.5% for AGIs below $25k, 187.9% for AGIs $25k-50k, 567.0% for AGIs $50k-75k, 766.7% for AGIs $75k-100k, 1042.1% for AGIs $100k-200k, 4106.2% for AGIs over 200k)
Charity contributions: $4,919 (reported on 13.1% of returns)
Here:
$4,919
State:
$7,826
(% of AGI for various income ranges: 5.8% for AGIs below $25k, 10.3% for AGIs $25k-50k, 42.1% for AGIs $50k-75k, 80.9% for AGIs $75k-100k, 148.9% for AGIs $100k-200k, 891.2% for AGIs over 200k)
Taxes paid: $9,015 (reported on 15.4% of returns)
02921:
$9,015
State:
$8,398
(% of AGI for various income ranges: 32.4% for AGIs below $25k, 56.7% for AGIs $25k-50k, 186.8% for AGIs $50k-75k, 294.4% for AGIs $75k-100k, 370.2% for AGIs $100k-200k, 1108.3% for AGIs over 200k)
Earned income credit: $1,363 (reported on 4.1% of returns)
Here:
$1,363
State:
$2,059
(% of AGI for various income ranges: 24.2% for AGIs below $25k, 22.8% for AGIs $25k-50k)
Percentage of individuals using paid preparers for their 2020 taxes: 93.2%
Here:
93%
State:
94%
(% for various income ranges: 90.8% for AGIs below $25k, 94.6% for AGIs $25k-50k, 93.9% for AGIs $50k-75k, 94.3% for AGIs $75k-100k, 93.8% for AGIs $100k-200k, 92.7% for AGIs over 200k)
Averages for the 2012 tax year for zip code 02921, filed in 2013:
Average Adjusted Gross Income (AGI) in 2012: $89,468 (Individual Income Tax Returns)
Here:
$89,468
State:
$60,628
Salary/wage: $72,644 (reported on 86.5% of returns)
Here:
$72,644
State:
$50,029
(% of AGI for various income ranges: 72.3% for AGIs below $25k, 74.6% for AGIs $25k-50k, 72.6% for AGIs $50k-75k, 74.3% for AGIs $75k-100k, 80.7% for AGIs $100k-200k, 55.9% for AGIs over 200k)
Taxable interest for individuals: $1,985 (reported on 52.1% of returns)
This zip code:
$1,985
Rhode Island:
$1,640
(% of AGI for various income ranges: 1.9% for AGIs below $25k, 1.0% for AGIs $25k-50k, 1.3% for AGIs $50k-75k, 0.9% for AGIs $75k-100k, 0.8% for AGIs $100k-200k, 1.6% for AGIs over 200k)
Ordinary dividends: $3,736 (reported on 33.1% of returns)
Here:
$3,736
State:
$6,396
(% of AGI for various income ranges: 2.2% for AGIs below $25k, 1.5% for AGIs $25k-50k, 1.2% for AGIs $50k-75k, 1.3% for AGIs $75k-100k, 0.8% for AGIs $100k-200k, 1.9% for AGIs over 200k)
Net capital gain/loss in AGI: +$6,283 (reported on 26.9% of returns)
Here:
+$6,283
State:
+$15,680
(% of AGI for various income ranges: 0.2% for AGIs $25k-50k, 0.5% for AGIs $75k-100k, 0.6% for AGIs $100k-200k, 4.9% for AGIs over 200k)
Profit/loss from business: +$20,931 (reported on 16.2% of returns)
Here:
+$20,931
State:
+$15,678
(% of AGI for various income ranges: 7.5% for AGIs below $25k, 4.6% for AGIs $25k-50k, 4.4% for AGIs $50k-75k, 3.5% for AGIs $75k-100k, 3.6% for AGIs $100k-200k, 3.4% for AGIs over 200k)
Taxable individual retirement arrangement distribution: $13,809 (reported on 11.4% of returns)
02921:
$13,809
Rhode Island:
$14,081
(% of AGI for various income ranges: 4.3% for AGIs below $25k, 3.6% for AGIs $25k-50k, 2.8% for AGIs $50k-75k, 2.7% for AGIs $75k-100k, 1.5% for AGIs $100k-200k, 0.9% for AGIs over 200k)
Self-employment retirement plans: $21,567 (reported on 1.5% of returns)
02921:
$21,567
Rhode Island:
$18,642
Total itemized deductions: $27,621 (20% of AGI, reported on 55.3% of returns)
Here:
$27,621
State:
$24,445
Here:
19.8% of AGI
State:
20.5% of AGI
(% of AGI for various income ranges: 14.2% for AGIs below $25k, 17.1% for AGIs $25k-50k, 21.2% for AGIs $50k-75k, 20.5% for AGIs $75k-100k, 18.8% for AGIs $100k-200k, 13.3% for AGIs over 200k)
Charity contributions: $2,588 (reported on 49.4% of returns)
Here:
$2,588
State:
$2,961
(% of AGI for various income ranges: 0.6% for AGIs below $25k, 1.0% for AGIs $25k-50k, 1.6% for AGIs $50k-75k, 1.7% for AGIs $75k-100k, 1.6% for AGIs $100k-200k, 1.3% for AGIs over 200k)
Taxes paid: $14,748 (reported on 55.3% of returns)
02921:
$14,748
State:
$11,235
(% of AGI for various income ranges: 5.1% for AGIs below $25k, 6.9% for AGIs $25k-50k, 9.5% for AGIs $50k-75k, 10.1% for AGIs $75k-100k, 10.0% for AGIs $100k-200k, 8.5% for AGIs over 200k)
Earned income credit: $1,700 (reported on 5.2% of returns)
Here:
$1,700
State:
$2,170
(% of AGI for various income ranges: 2.3% for AGIs below $25k, 0.4% for AGIs $25k-50k)
Percentage of individuals using paid preparers for their 2012 taxes: 64.6%
Here:
65%
State:
60%
(% for various income ranges: 58.2% for AGIs below $25k, 60.7% for AGIs $25k-50k, 69.9% for AGIs $50k-75k, 70.6% for AGIs $75k-100k, 66.0% for AGIs $100k-200k, 75.0% for AGIs over 200k)
Averages for the 2004 tax year for zip code 02921, filed in 2005:
Average Adjusted Gross Income (AGI) in 2004: $80,847 (Individual Income Tax Returns)
Here:
$80,847
State:
$51,090
Salary/wage: $66,947 (reported on 87.6% of returns)
Here:
$66,947
State:
$43,690
(% of AGI for various income ranges: 192.3% for AGIs below $10k, 70.8% for AGIs $10k-25k, 74.6% for AGIs $25k-50k, 76.8% for AGIs $50k-75k, 83.3% for AGIs $75k-100k, 68.5% for AGIs over 100k)
Taxable interest for individuals: $1,931 (reported on 71.1% of returns)
This zip code:
$1,931
Rhode Island:
$1,567
(% of AGI for various income ranges: 12.9% for AGIs below $10k, 4.4% for AGIs $10k-25k, 2.0% for AGIs $25k-50k, 1.9% for AGIs $50k-75k, 1.3% for AGIs $75k-100k, 1.5% for AGIs over 100k)
Taxable dividends: $2,421 (reported on 40.9% of returns)
Here:
$2,421
State:
$3,896
(% of AGI for various income ranges: 10.1% for AGIs below $10k, 1.7% for AGIs $10k-25k, 1.2% for AGIs $25k-50k, 1.2% for AGIs $50k-75k, 0.7% for AGIs $75k-100k, 1.3% for AGIs over 100k)
Net capital gain/loss: +$13,301 (reported on 33.5% of returns)
Here:
+$13,301
State:
+$15,829
(% of AGI for various income ranges: -8.8% for AGIs below $10k, -1.0% for AGIs $10k-25k, -0.1% for AGIs $25k-50k, 1.3% for AGIs $50k-75k, 0.7% for AGIs $75k-100k, 8.2% for AGIs over 100k)
Profit/loss from business: +$24,977 (reported on 17.3% of returns)
Here:
+$24,977
State:
+$15,557
(% of AGI for various income ranges: 1.4% for AGIs below $10k, 6.8% for AGIs $10k-25k, 6.1% for AGIs $25k-50k, 5.2% for AGIs $50k-75k, 3.5% for AGIs $75k-100k, 5.7% for AGIs over 100k)
IRA payment deduction: $3,459 (reported on 4.9% of returns)
02921:
$3,459
Rhode Island:
$3,092
(% of AGI for various income ranges: 0.5% for AGIs $10k-25k, 0.5% for AGIs $25k-50k, 0.4% for AGIs $50k-75k, 0.3% for AGIs $75k-100k, 0.1% for AGIs over 100k)
Self-employed pension: $16,278 (reported on 2.2% of returns)
Here:
$16,278
Rhode Island:
$14,597
(% of AGI for various income ranges: 0.4% for AGIs $50k-75k, 0.2% for AGIs $75k-100k, 0.6% for AGIs over 100k)
Total itemized deductions: $24,939 (21% of AGI, reported on 60.7% of returns)
Here:
$24,939
State:
$20,228
Here:
20.8% of AGI
State:
21.1% of AGI
(% of AGI for various income ranges: 26.8% for AGIs below $10k, 16.4% for AGIs $10k-25k, 20.5% for AGIs $25k-50k, 24.1% for AGIs $50k-75k, 23.0% for AGIs $75k-100k, 16.8% for AGIs over 100k)
Charity contributions deductions: $2,625 (2% of AGI, reported on 57.9% of returns)
Here:
$2,625
State:
$2,620
Here:
2.1% of AGI
State:
2.6% of AGI
(% of AGI for various income ranges: 1.8% for AGIs below $10k, 1.4% for AGIs $10k-25k, 1.5% for AGIs $25k-50k, 2.1% for AGIs $50k-75k, 2.2% for AGIs $75k-100k, 1.8% for AGIs over 100k)
Total tax: $14,246 (reported on 83.3% of returns)
02921:
$14,246
State:
$8,437
(% of AGI for various income ranges: 4.6% for AGIs below $10k, 5.3% for AGIs $10k-25k, 7.7% for AGIs $25k-50k, 8.4% for AGIs $50k-75k, 9.1% for AGIs $75k-100k, 18.1% for AGIs over 100k)
Earned income credit: $1,271 (reported on 3.7% of returns)
Here:
$1,271
State:
$1,659
Percentage of individuals using paid preparers for their 2004 taxes: 65.0%
Here:
65%
State:
63%
(% for various income ranges: 56.5% for AGIs below $10k, 61.4% for AGIs $10k-25k, 63.6% for AGIs $25k-50k, 70.5% for AGIs $50k-75k, 68.5% for AGIs $75k-100k, 68.6% for AGIs over 100k)
Household received Food Stamps/SNAP in the past 12 months: 290 Household did not receive Food Stamps/SNAP in the past 12 months: 4,547
Women who had a birth in the past 12 months: 162 (120 now married, 41 unmarried) Women who did not have a birth in the past 12 months: 2,392 (1,296 now married, 1,110 unmarried)
Housing units in zip code 02921 with a mortgage: 2,873 (421 second mortgage, 6 home equity loan, 399 both second mortgage and home equity loan) Houses without a mortgage: 195
Median monthly owner costs for units with a mortgage: $2,592 Median monthly owner costs for units without a mortgage: $1,092
Residents with income below the poverty level in 2022:
This zip code:
4.1%
Whole state:
10.8%
Residents with income below 50% of the poverty level in 2022:
This zip code:
1.6%
Whole state:
5.6%
Median number of rooms in houses and condos:
Here:
6.7
State:
6.2
Median number of rooms in apartments:
Here:
4.0
State:
4.1
Notable locations in this zip code not listed on our city pages
Notable locations in zip code 02921: Cranston Country Club (A), Alpine Country Club (B), Dermksien Orchard (C), Oak Lawn Branch Cranston Public Library (D), Western Cranston Learning Center (E), Little Apostles Early Childhood Center (F), Cranston Fire Department Station 6 (G). Display/hide their locations on the map
Churches in zip code 02921 include: Faith Presbyterian Church (A), Word of Life Covenant Church (B), Shepherd of the Valley Church (C). Display/hide their locations on the map
In group quarters: 160 (-1 institutionalized population)
Size of family households: 1,822 2-persons, 723 3-persons, 819 4-persons, 116 5-persons, 69 6-persons
Size of nonfamily households: 909 1-person, 285 2-persons, 29 3-persons
1,914 married couples with children.
146 single-parent households (42 men, 104 women).
82.2% of residents of 02921 zip code speak English at home.
1.7% of residents speak Spanish at home (73% very well, 5% well, 22% not well).
9.5% of residents speak other Indo-European language at home (83% very well, 10% well, 6% not well, 1% not at all).
4.7% of residents speak Asian or Pacific Island language at home (61% very well, 15% well, 24% not well).
0.5% of residents speak other language at home (100% very well).
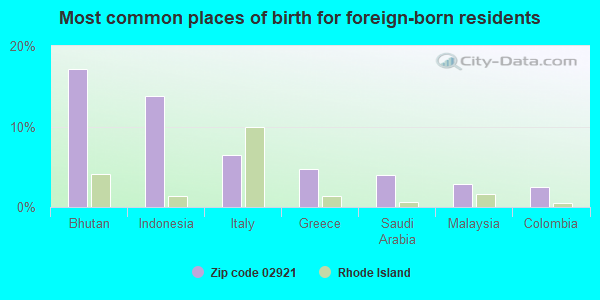
Foreign born population: 1,627 (13.3%) (68.5% of them are naturalized citizens)
Major facilities with environmental interests located in this zip code:
EAST GREENWICH BROWN DAIRY (2032 PLAINFIELD PIKE in CRANSTON, RI)
COMPLIANCE ACTIVITY (Tracking inspections of insecticide, fungicide, and rodenticide, and toxic substances) (Resource Conservation and Recovery Act (tracking hazardous waste)) TRI REPORTER (Tracking of toxic chemicals releasing facilities) Business SIC classification: FLUID MILK; FROZEN FRUITS, FRUIT JUICES, AND VEGETABLES Organizations: CLIFFORD JOHNSON (CONTACT/OWNER)
Alternative names: NATURES BEST DAIRY BARN
CON-WAY CENTRAL EXPRESS - XPI (15 SOUTHERN INDUSTRIAL DRIVE in CRANSTON, RI)
National Pollutant Discharge Elimination System NON-MAJOR (Tracking pollutant discharge elimination systems) - permit Business SIC classification: COURIER SERVICES, EXCEPT BY AIR Organizations: CNF, INC. (CONTACT/OPERATOR)
Alternative names: CNF, INC.
MEARTHANE PRODUCTS CORPORATION (16 WESTERN INDUSTRIAL DR. in CRANSTON, RI)
COMPLIANCE ACTIVITY (Tracking inspections of insecticide, fungicide, and rodenticide, and toxic substances) CRITERIA AND HAZARDOUS AIR POLLUTANT INVENTORY (Inventory of air pollution sources) Small Quantity Generators, between 100 kg and 1000 kg of hazardous waste/month (Resource Conservation and Recovery Act (tracking hazardous waste)) - notification TRI REPORTER (Tracking of toxic chemicals releasing facilities) Business SIC classification: CUSTOM COMPOUNDING OF PURCHASED PLASTICS RESINS Business NAICS classification: CUSTOM COMPOUNDING OF PURCHASED RESINS. Alternative names: MEARTHANE PRODS. CORP., MEATHANE PRODUCTS CORP.
COLBEA ENTERPRISE LLC (2050 PLAINFIELD PIKE in CRANSTON, RI)
Small Quantity Generators, between 100 kg and 1000 kg of hazardous waste/month (Resource Conservation and Recovery Act (tracking hazardous waste)) - notification Organizations: AAA SOUTH CENTRAL NEW ENGLAND (CONTACT/OWNER)
, MARIO COLETTA (CONTACT/OWNER)
Alternative names: A A A EMERGENCY ROAD SERVICE
COLOR TECH INCORPORATED (25 WESTERN INDUSTRIAL DRIVE in CRANSTON, RI)
(Resource Conservation and Recovery Act (tracking hazardous waste)) Organizations: RALPH SACCO JR (CONTACT/OWNER)
CUSTOM CLEANERS (1804 PLAINFIELD PIKE in CRANSTON, RI)
(Resource Conservation and Recovery Act (tracking hazardous waste)) Organizations: ALBERT C SCARTABELLO (CONTACT/OWNER)
DEAN MACHINE INCORPORATED (935 PHENIX AVE in CRANSTON, RI)
(Resource Conservation and Recovery Act (tracking hazardous waste)) Organizations: DAVID MAYNARD & ROBERT CAITO (CONTACT/OWNER)
FRITO LAY INC (45 STAMP FARM RD in CRANSTON, RI)
(Resource Conservation and Recovery Act (tracking hazardous waste))
KEYPRINT INC (25 AMFLEX DR in CRANSTON, RI)
Small Quantity Generators, between 100 kg and 1000 kg of hazardous waste/month (Resource Conservation and Recovery Act (tracking hazardous waste)) - notification Business NAICS classification: COMMERCIAL LITHOGRAPHIC PRINTING.; PREPRESS SERVICES.; COMMERCIAL PHOTOGRAPHY. Organizations: JOANN RILEY (CONTACT/OWNER)
, ROBERT CLEMENT (CONTACT/OWNER)
, ROBERT TIERNEY (CONTACT/OWNER)
MACERA BROS OF CRANSTON (2550 PLAINFIELD PIKE in CRANSTON, RI)
(Resource Conservation and Recovery Act (tracking hazardous waste)) Organizations: MACERA BROS OF CRANSTON INC (CONTACT/OWNER)
NEW ENGLAND LIFT TRUCK CORP (131 COMSTOCK PRKW in CRANSTON, RI)
(Resource Conservation and Recovery Act (tracking hazardous waste)) Organizations: COMSTOCK REALTY ASS LLC (CONTACT/OWNER)
NORTH SAFETY PRODUCTS (2000 PLAINFIELD PIKE in CRANSTON, RI)
CRITERIA AND HAZARDOUS AIR POLLUTANT INVENTORY (Inventory of air pollution sources) Small Quantity Generators, between 100 kg and 1000 kg of hazardous waste/month (Resource Conservation and Recovery Act (tracking hazardous waste)) - notification Business SIC classification: PLASTICS PRODUCTS Organizations: BERKSHIRE ACQUISITION CORPORATION (CONTACT/OWNER)
, SIEBE PLC (CONTACT/OWNER)
Alternative names: NORTH SAFETY EQUIPMENT
ALGA PLASTICS CO (21 AMFLEX DR in CRANSTON, RI)
CRITERIA AND HAZARDOUS AIR POLLUTANT INVENTORY (Inventory of air pollution sources) Small Quantity Generators, between 100 kg and 1000 kg of hazardous waste/month (Resource Conservation and Recovery Act (tracking hazardous waste)) - notification Business SIC classification: PLASTICS PRODUCTS Organizations: ALGA REALTY CO (CONTACT/OWNER)
Housing units lacking complete plumbing facilities: 0.5% Housing units lacking complete kitchen facilities: 0.1%
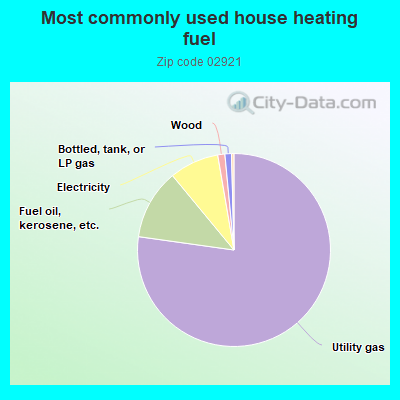
77.3%Utility gas
11.8%Fuel oil, kerosene, etc.
8.3%Electricity
1.2%Wood
1.1%Bottled, tank, or LP gas
Population in 1990: 6,502. Population change in the 1990s: +4,273 (+65.7%).
Place of birth for U.S.-born residents:
This state: 8,498
Northeast: 1,053
Midwest: 94
South: 75
West: 150
66% of the 02921 zip code residents lived in the same house 5 years ago. Out of people who lived in different houses, 73% lived in this county. Out of people who lived in different counties, 50% lived in Rhode Island.
94% of the 02921 zip code residents lived in the same house 1 year ago. Out of people who lived in different houses, 54% moved from this county. Out of people who lived in different houses, 19% moved from different county within same state. Out of people who lived in different houses, 27% moved from different state.
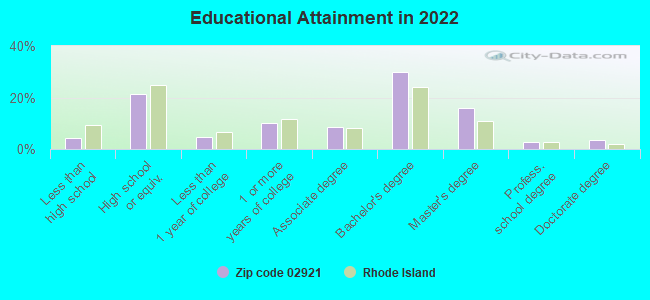
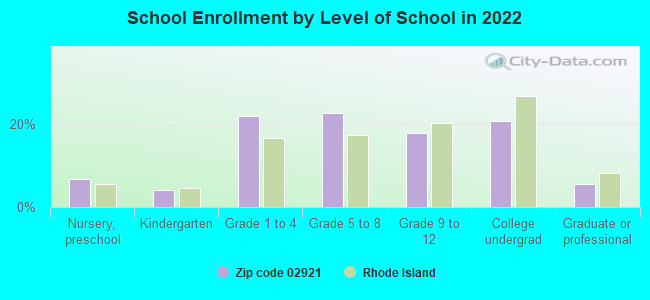
Private vs. public school enrollment:
Students in private schools in grades 1 to 8 (elementary and middle school): 123
Here:
12.6%
Rhode Island:
12.2%
Students in private schools in grades 9 to 12 (high school): 82
Here:
20.8%
Rhode Island:
11.6%
Students in private undergraduate colleges: 63
Here:
13.4%
Rhode Island:
41.1%
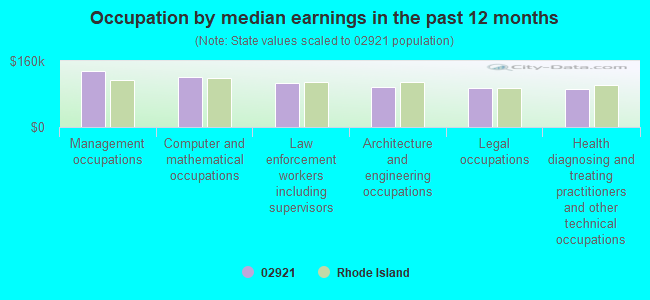
Occupation by median earnings in the past 12 months ($)
135,016Management occupations
121,690Computer and mathematical occupations
105,546Law enforcement workers including supervisors
97,835Architecture and engineering occupations
94,544Legal occupations
93,211Health diagnosing and treating practitioners and other technical occupations
Companies with federal contracts located in this zip code (CRANSTON, RI):
STERLING MOVING & STORAGE INC (61 COMSTOCK PARKWAY; small business) : $1,560,722 in 6 contractsfrom 2000 to 2004
Contracts for Personal Property Management Services by Navy Signed by year:2000: $192,616; 2001: $0; 2002: $894,149; 2003: $0; 2004: $473,957; 2005: $0; 2006: $0.
Biggest contracts:
$473,957 with Navy for Personal Property Management Services. Taking place in CT. Signed on 2004-01-01. Completion date: 2004-12-31.
$421,940, same as above.Signed on 2002-12-11. Completion date: 2003-12-31.
$421,940, same as above.Signed on 2002-06-01. Completion date: 2002-12-31.
$192,616, same as above.Signed on 2000-01-01. Completion date: 2000-12-31.
ELECTRO STANDARDS LABORATORY, (36 WESTERN INDUSTRIAL DR; small business) : $893,607 in 12 contractsfrom 2002 to 2006
Contracts for Defense Electronics and Communication Equipment -- Basic Research (R&D), Other Defense -- Applied Research and Exploratory Development (R&D), Cable, Cord, and Wire Assemblies: Communications Equipment, ADP Facility Operation and Maintenance Services, and moreby Navy, Minerals Management Service, Geological Survey Signed by year:2000: $0; 2001: $0; 2002: $69,960; 2003: $329,900; 2004: $298,127; 2005: $190,760; 2006: $4,860.
Biggest contracts:
$300,000 with Navy for Defense Electronics and Communication Equipment -- Basic Research (R&D). Signed on 2003-12-01. Completion date: 2005-11-30.
$297,547, same as above.Signed on 2004-02-06. Completion date: 2005-11-30.
$149,990, same as above.Signed on 2005-12-20. Completion date: 2006-06-20.
$69,960 with Navy for Other Defense -- Applied Research and Exploratory Development (R&D). Signed on 2002-12-16. Completion date: 2003-06-15.
AIR CARE ENVIROMENTAL SERVICES (2220 PLAINFIELD PIKE; small business) : $351,293 in 19 contractsfrom 2002 to 2006
Contracts for Maintenance, Repair or Alteration of Real Property -- Other Administrative Facilities and Service Buildings, Other Professional Services, Other Housekeeping Services, Maintenance, Repair or Alteration of Real Property -- Miscellaneous Buildings, and moreby U.S. Coast Guard, Navy, Army Signed by year:2000: $0; 2001: $0; 2002: $25,211; 2003: $50,054; 2004: $0; 2005: $159,162; 2006: $116,866.
Biggest contracts:
$95,998 with U.S. Coast Guard for Maintenance, Repair or Alteration of Real Property -- Other Administrative Facilities and Service Buildings. Taking place in CT. Signed on 2005-11-29. Completion date: 2006-03-15.
$50,054 with Navy for Other Professional Services. Taking place in MA. Signed on 2003-01-28. Completion date: 2003-04-30.
$38,989 with U.S. Coast Guard for Maintenance, Repair or Alteration of Real Property -- Other Administrative Facilities and Service Buildings. Taking place in CT. Signed on 2006-07-27. Completion date: 2006-08-18.
$26,531 with Navy for Other Housekeeping Services. Taking place in MA. Signed on 2005-06-23. Completion date: 2005-07-29.
M-F ATHLETIC CO INC (11 AMFLEX DR; small business) : $186,846 in 27 contractsfrom 2001 to 2006
Contracts for Miscellaneous Items, ADP Support Equipment, Rubber Fabricated Materials, Boxes, Cartons, and Crates, and moreby Indian Health Service, Army, Federal Law Enforcement Training Center, Defense Logistics Agency, and others Signed by year:2000: $0; 2001: $14,788; 2002: $0; 2003: $10,763; 2004: $64,778; 2005: $28,937; 2006: $67,580.
Biggest contracts:
$20,878 with Indian Health Service for Miscellaneous Items. Taking place in NM. Signed on 2006-09-05. Completion date: 2006-09-25.
$19,320 with Army for ADP Support Equipment. Signed on 2004-05-27. Completion date: 2004-06-04.
$14,788 with Army for Rubber Fabricated Materials. Taking place in GA. Signed on 2001-11-20. Completion date: 2001-11-28.
$13,206 with Army for Boxes, Cartons, and Crates. Signed on 2004-03-09. Completion date: 2004-04-08.
MEARTHANE PRODUCTS CORPORATION (16 WESTERN INDUSTRIAL DRIV; small business) : $73,373 in 7 contractsfrom 2003 to 2005
Contracts for Plastics Fabricated Materials by Navy Signed by year:2000: $0; 2001: $0; 2002: $0; 2003: $116; 2004: $19,425; 2005: $53,832; 2006: $0.
Biggest contracts:
$30,329 with Navy for Plastics Fabricated Materials. Signed on 2005-08-26. Completion date: 2005-10-20.
$23,503, same as above.Signed on 2005-01-20. Completion date: 2005-03-11.
$19,424, same as above.Signed on 2004-08-20. Completion date: 2004-10-22.
$116 with Navy for Plastics Fabricated Materials. Taking place in GA. Signed on 2003-12-16. Completion date: 2003-08-22.
NEW ENGLAND LIFT TRUCK CORPORA (131 COMSTOCK PKWY; small business) : $67,650 in 2 contractsin 2005
$58,650 with Navy for Maintenance, Repair and Rebuilding of Equipment -- Materials Handling Equipment. Taking place in CT. Signed on 2005-04-13. Completion date: 2005-09-30.
$9,000 with Navy for Batteries, Rechargeable. Taking place in CT. Signed on 2005-08-04. Completion date: 2005-08-08.
AAC ENVIRONMENTAL SERVICES INC (30 DUTCHESS DR; small business) : $37,535 in 53 contractsfrom 2001 to 2005
Contracts for Maintenance, Repair or Alteration of Real Property -- Other Administrative Facilities and Service Buildings, Maintenance, Repair or Alteration of Real Property -- Office Buildings, Other Housekeeping Services, Facilities Operations Support Services by Navy Signed by year:2000: $0; 2001: $3,605; 2002: $5,100; 2003: $9,500; 2004: $38,140; 2005: -$18,810; 2006: $0.
Biggest contracts:
$16,240 with Navy for Maintenance, Repair or Alteration of Real Property -- Other Administrative Facilities and Service Buildings. Signed on 2004-01-30. Completion date: 2005-03-29.
$9,660 with Navy for Maintenance, Repair or Alteration of Real Property -- Office Buildings. Signed on 2004-01-30. Completion date: 2004-03-01.
$6,410 with Navy for Other Housekeeping Services. Signed on 2005-09-08. Completion date: 2005-09-30.
$6,000 with Navy for Maintenance, Repair or Alteration of Real Property -- Office Buildings. Signed on 2004-01-07. Completion date: 2004-06-05.
STERLING TRUCKING INC (61 COMSTOCK PKWY; small business)
$6,510 with Navy for Packing/Crating Services. Signed on 2005-09-06. Completion date: 2005-09-09.
FRI RESINS CORPORATION (21 STARLINE WAY; small business)
$73 with Navy for Preservative and Sealing Compounds. Signed on 2005-08-15. Completion date: 2005-08-31.
Top industries in this zip code by the number of employees in 2005:
Health Care and Social Assistance: Nursing Care Facilities (250-499 employees: 1 establishment)
Health Care and Social Assistance: Vocational Rehabilitation Services (100-249: 1)
Administrative and Support and Waste Management and Remediation Services: Temporary Help Services (50-99: 1, 20-49: 1, 5-9: 1)
Information: Periodical Publishers (20-49: 3)
People in group quarters in 2010:
40 people in nursing facilities/skilled-nursing facilities
25 people in group homes intended for adults
3 people in residential treatment centers for adults
People in group quarters in 2000:
40 people in nursing homes
13 people in homes for the mentally retarded
4 people in homes for the mentally ill
Fatal accident statistics in 2014:
Fatal accident count: 1
Vehicles involved in fatal accidents: 2
Fatal accidents caused by drunken drivers: 0
Fatalities: 1
Persons involved in fatal accidents: 2
Pedestrians involved in fatal accidents: 0
Fatal accident statistics in 2013:
Fatal accident count: 1
Vehicles involved in fatal accidents: 1
Fatal accidents caused by drunken drivers: 0
Fatalities: 1
Persons involved in fatal accidents: 2
Pedestrians involved in fatal accidents: 1
Home Mortgage Disclosure Act Aggregated Statistics For Year 2009 (Based on 4 full and 4 partial tracts)
A) FHA, FSA/RHS & VA Home Purchase Loans
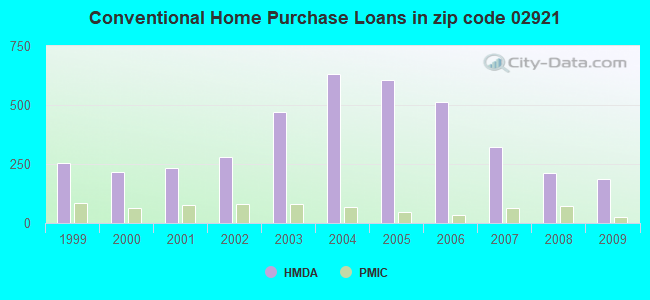
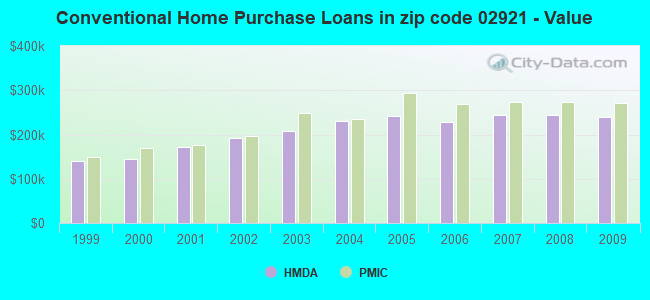
B) Conventional Home Purchase Loans
C) Refinancings
D) Home Improvement Loans
F) Non-occupant Loans on < 5 Family Dwellings (A B C & D)
Number
Average Value
Number
Average Value
Number
Average Value
Number
Average Value
Number
Average Value
LOANS ORIGINATED
91
$254,277
186
$239,788
1,091
$216,913
39
$128,554
17
$206,192
APPLICATIONS APPROVED, NOT ACCEPTED
0
$0
16
$224,932
97
$236,774
5
$72,544
2
$144,645
APPLICATIONS DENIED
32
$255,121
29
$264,542
290
$252,597
15
$91,103
6
$231,130
APPLICATIONS WITHDRAWN
6
$277,988
22
$321,381
162
$236,200
6
$44,225
4
$295,730
FILES CLOSED FOR INCOMPLETENESS
5
$148,444
8
$314,934
59
$254,844
1
$177,440
2
$398,975
Aggregated Statistics For Year 2008 (Based on 4 full and 4 partial tracts)
A) FHA, FSA/RHS & VA Home Purchase Loans
B) Conventional Home Purchase Loans
C) Refinancings
D) Home Improvement Loans
F) Non-occupant Loans on < 5 Family Dwellings (A B C & D)
G) Loans On Manufactured Home Dwelling (A B C & D)
Number
Average Value
Number
Average Value
Number
Average Value
Number
Average Value
Number
Average Value
Number
Average Value
LOANS ORIGINATED
58
$248,696
212
$242,979
493
$223,454
94
$80,479
20
$174,642
2
$313,400
APPLICATIONS APPROVED, NOT ACCEPTED
4
$240,652
17
$260,575
71
$243,091
10
$84,278
1
$128,310
0
$0
APPLICATIONS DENIED
17
$190,711
52
$216,777
194
$282,871
24
$46,300
7
$270,444
0
$0
APPLICATIONS WITHDRAWN
4
$257,822
25
$247,445
136
$259,332
2
$120,540
5
$104,902
0
$0
FILES CLOSED FOR INCOMPLETENESS
2
$308,575
14
$286,896
34
$292,575
2
$20,250
2
$247,975
0
$0
Aggregated Statistics For Year 2007 (Based on 4 full and 4 partial tracts)
A) FHA, FSA/RHS & VA Home Purchase Loans
B) Conventional Home Purchase Loans
C) Refinancings
D) Home Improvement Loans
E) Loans on Dwellings For 5+ Families
F) Non-occupant Loans on < 5 Family Dwellings (A B C & D)
Number
Average Value
Number
Average Value
Number
Average Value
Number
Average Value
Number
Average Value
Number
Average Value
LOANS ORIGINATED
5
$254,996
321
$243,021
616
$217,537
141
$84,352
1
$610,000
24
$182,951
APPLICATIONS APPROVED, NOT ACCEPTED
0
$0
51
$215,795
115
$218,415
27
$96,887
0
$0
4
$208,215
APPLICATIONS DENIED
3
$327,963
74
$249,117
376
$244,346
46
$84,115
0
$0
20
$203,030
APPLICATIONS WITHDRAWN
0
$0
50
$200,256
157
$257,519
10
$136,802
0
$0
5
$188,868
FILES CLOSED FOR INCOMPLETENESS
0
$0
9
$353,824
57
$248,602
6
$145,432
0
$0
1
$104,800
Aggregated Statistics For Year 2006 (Based on 4 full and 4 partial tracts)
A) FHA, FSA/RHS & VA Home Purchase Loans
B) Conventional Home Purchase Loans
C) Refinancings
D) Home Improvement Loans
E) Loans on Dwellings For 5+ Families
F) Non-occupant Loans on < 5 Family Dwellings (A B C & D)
G) Loans On Manufactured Home Dwelling (A B C & D)
Number
Average Value
Number
Average Value
Number
Average Value
Number
Average Value
Number
Average Value
Number
Average Value
Number
Average Value
LOANS ORIGINATED
2
$153,910
514
$227,797
940
$192,927
257
$62,796
4
$265,620
37
$207,897
4
$27,820
APPLICATIONS APPROVED, NOT ACCEPTED
0
$0
74
$248,110
136
$214,131
33
$71,972
0
$0
9
$381,956
0
$0
APPLICATIONS DENIED
4
$260,665
138
$217,871
337
$234,804
77
$120,698
0
$0
14
$255,278
1
$184,750
APPLICATIONS WITHDRAWN
0
$0
56
$246,048
318
$260,548
24
$159,973
0
$0
10
$246,818
0
$0
FILES CLOSED FOR INCOMPLETENESS
0
$0
12
$203,498
69
$244,584
1
$109,780
0
$0
0
$0
0
$0
Aggregated Statistics For Year 2005 (Based on 4 full and 4 partial tracts)
A) FHA, FSA/RHS & VA Home Purchase Loans
B) Conventional Home Purchase Loans
C) Refinancings
D) Home Improvement Loans
E) Loans on Dwellings For 5+ Families
F) Non-occupant Loans on < 5 Family Dwellings (A B C & D)
G) Loans On Manufactured Home Dwelling (A B C & D)
Number
Average Value
Number
Average Value
Number
Average Value
Number
Average Value
Number
Average Value
Number
Average Value
Number
Average Value
LOANS ORIGINATED
7
$261,413
605
$240,991
1,167
$211,253
243
$99,911
1
$8,442,510
45
$200,858
0
$0
APPLICATIONS APPROVED, NOT ACCEPTED
1
$145,780
51
$233,670
128
$228,224
17
$63,863
0
$0
1
$178,380
0
$0
APPLICATIONS DENIED
0
$0
88
$253,567
377
$232,845
95
$102,154
0
$0
8
$178,552
1
$33,300
APPLICATIONS WITHDRAWN
0
$0
62
$238,278
477
$236,361
34
$158,651
0
$0
10
$157,201
0
$0
FILES CLOSED FOR INCOMPLETENESS
0
$0
5
$138,178
107
$271,568
7
$64,631
0
$0
1
$131,000
0
$0
Aggregated Statistics For Year 2004 (Based on 4 full and 4 partial tracts)
A) FHA, FSA/RHS & VA Home Purchase Loans
B) Conventional Home Purchase Loans
C) Refinancings
D) Home Improvement Loans
F) Non-occupant Loans on < 5 Family Dwellings (A B C & D)
G) Loans On Manufactured Home Dwelling (A B C & D)
Number
Average Value
Number
Average Value
Number
Average Value
Number
Average Value
Number
Average Value
Number
Average Value
LOANS ORIGINATED
13
$235,847
630
$230,537
1,269
$189,264
165
$77,974
48
$183,719
3
$86,933
APPLICATIONS APPROVED, NOT ACCEPTED
2
$241,075
75
$225,409
212
$177,093
29
$78,000
4
$156,062
0
$0
APPLICATIONS DENIED
1
$110,180
65
$233,192
350
$217,385
77
$70,132
8
$89,999
2
$9,645
APPLICATIONS WITHDRAWN
2
$149,985
77
$231,307
490
$187,514
20
$53,646
6
$238,625
0
$0
FILES CLOSED FOR INCOMPLETENESS
4
$182,792
9
$175,269
106
$234,420
12
$140,889
3
$220,143
0
$0
Aggregated Statistics For Year 2003 (Based on 4 full and 4 partial tracts)
A) FHA, FSA/RHS & VA Home Purchase Loans
B) Conventional Home Purchase Loans
C) Refinancings
D) Home Improvement Loans
E) Loans on Dwellings For 5+ Families
F) Non-occupant Loans on < 5 Family Dwellings (A B C & D)
Number
Average Value
Number
Average Value
Number
Average Value
Number
Average Value
Number
Average Value
Number
Average Value
LOANS ORIGINATED
17
$168,081
469
$207,451
3,148
$162,650
101
$58,423
0
$0
59
$163,460
APPLICATIONS APPROVED, NOT ACCEPTED
2
$168,755
89
$208,083
360
$156,342
43
$35,758
0
$0
15
$152,477
APPLICATIONS DENIED
7
$180,633
78
$200,653
478
$175,648
52
$48,976
1
$131,000
13
$176,617
APPLICATIONS WITHDRAWN
4
$135,105
23
$222,962
482
$176,957
15
$122,208
0
$0
4
$151,202
FILES CLOSED FOR INCOMPLETENESS
1
$80,620
10
$136,269
52
$170,913
5
$135,754
0
$0
1
$191,300
Aggregated Statistics For Year 2002 (Based on 2 full and 2 partial tracts)
A) FHA, FSA/RHS & VA Home Purchase Loans
B) Conventional Home Purchase Loans
C) Refinancings
D) Home Improvement Loans
F) Non-occupant Loans on < 5 Family Dwellings (A B C & D)
Number
Average Value
Number
Average Value
Number
Average Value
Number
Average Value
Number
Average Value
LOANS ORIGINATED
20
$156,784
279
$192,934
1,095
$151,347
72
$41,749
16
$109,819
APPLICATIONS APPROVED, NOT ACCEPTED
0
$0
35
$189,671
136
$150,699
15
$56,073
3
$145,183
APPLICATIONS DENIED
2
$228,005
26
$173,294
183
$151,744
26
$46,365
5
$83,126
APPLICATIONS WITHDRAWN
1
$101,480
40
$193,230
141
$153,787
7
$35,644
2
$121,500
FILES CLOSED FOR INCOMPLETENESS
0
$0
8
$84,609
29
$173,186
0
$0
0
$0
Aggregated Statistics For Year 2001 (Based on 2 full and 2 partial tracts)
A) FHA, FSA/RHS & VA Home Purchase Loans
B) Conventional Home Purchase Loans
C) Refinancings
D) Home Improvement Loans
F) Non-occupant Loans on < 5 Family Dwellings (A B C & D)
Number
Average Value
Number
Average Value
Number
Average Value
Number
Average Value
Number
Average Value
LOANS ORIGINATED
39
$150,387
234
$172,506
851
$132,804
91
$38,360
16
$105,074
APPLICATIONS APPROVED, NOT ACCEPTED
2
$163,525
24
$152,528
86
$115,407
26
$43,109
5
$98,172
APPLICATIONS DENIED
0
$0
19
$163,061
213
$111,983
21
$27,891
2
$100,730
APPLICATIONS WITHDRAWN
0
$0
15
$231,961
133
$128,197
11
$34,845
2
$90,645
FILES CLOSED FOR INCOMPLETENESS
0
$0
6
$100,602
10
$126,664
0
$0
0
$0
Aggregated Statistics For Year 2000 (Based on 2 full and 2 partial tracts)
A) FHA, FSA/RHS & VA Home Purchase Loans
B) Conventional Home Purchase Loans
C) Refinancings
D) Home Improvement Loans
F) Non-occupant Loans on < 5 Family Dwellings (A B C & D)
Number
Average Value
Number
Average Value
Number
Average Value
Number
Average Value
Number
Average Value
LOANS ORIGINATED
28
$123,522
215
$144,511
190
$87,415
64
$31,177
2
$64,215
APPLICATIONS APPROVED, NOT ACCEPTED
2
$163,930
30
$144,698
32
$75,244
21
$39,294
0
$0
APPLICATIONS DENIED
5
$87,860
24
$193,318
115
$87,007
41
$29,175
1
$66,990
APPLICATIONS WITHDRAWN
2
$182,085
22
$106,340
94
$101,866
16
$43,641
0
$0
FILES CLOSED FOR INCOMPLETENESS
2
$105,110
2
$242,665
15
$106,415
0
$0
0
$0
Aggregated Statistics For Year 1999 (Based on 1 full and 2 partial tracts)
A) FHA, FSA/RHS & VA Home Purchase Loans
B) Conventional Home Purchase Loans
C) Refinancings
D) Home Improvement Loans
F) Non-occupant Loans on < 5 Family Dwellings (A B C & D)
2010 - 2018 National Fire Incident Reporting System (NFIRS) incidents
Based on the data from the years 2010 - 2018 the average number of fire incidents per year is 35. The highest number of fires - 45 took place in 2015, and the least - 17 in 2010. The data has a growing trend.
When looking into fire subcategories, the most incidents belonged to: Outside Fires (56.3%), and Structure Fires (20.9%).
Fire incident types reported to NFIRS in Zip Code 02921


 Nearest zip codes: 02920, 02919, 02910, 02909, 02893, 02886.


 Based on the data from the years 2010 - 2018 the average number of fire incidents per year is 35. The highest number of fires - 45 took place in 2015, and the least - 17 in 2010. The data has a growing trend.
 When looking into fire subcategories, the most incidents belonged to: Outside Fires (56.3%), and Structure Fires (20.9%).