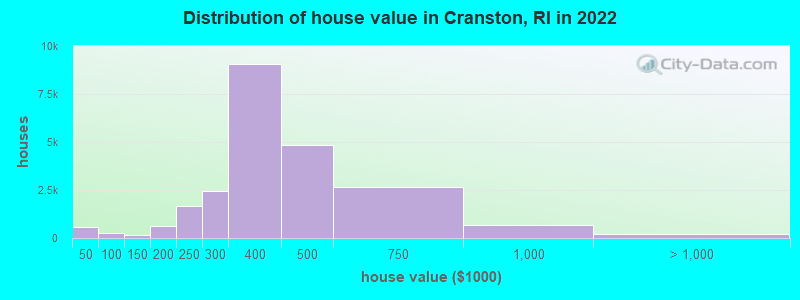
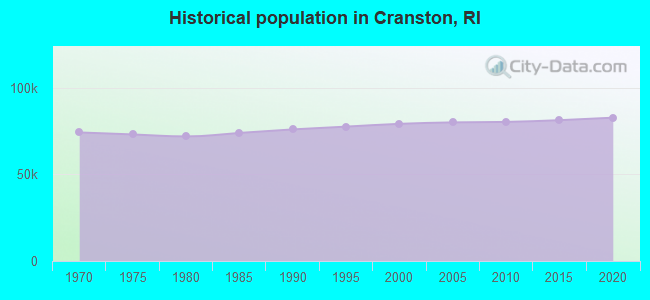
Estimated median house or condo value in 2022: $364,800 (it was $122,600 in 2000)
Cranston:
$364,800
RI:
$383,900
Mean prices in 2022:all housing units: $392,793; detached houses: $405,505; townhouses or other attached units: $339,290; in 2-unit structures: $332,238; in 3-to-4-unit structures: $352,027; in 5-or-more-unit structures: $213,527; mobile homes: $155,635
Median gross rent in 2022: $1,270.
March 2022 cost of living index in Cranston: 92.2 (less than average, U.S. average is 100)
Percentage of residents living in poverty in 2022: 13.9%
(7.2% for White Non-Hispanic residents, 16.4% for Black residents, 12.7% for Hispanic or Latino residents, 6.5% for American Indian residents, 12.0% for other race residents, 9.0% for two or more races residents)
According to our research of Rhode Island and other state lists, there were 77 registered sex offenders living in Cranston, Rhode Island as of April 26, 2024. The ratio of all residents to sex offenders in Cranston is 1,052 to 1. The ratio of registered sex offenders to all residents in this city is near the state average.
Crime rates in Cranston by year
Type
2009
2010
2011
2012
2013
2014
2015
2016
2017
2018
2019
2020
2021
2022
Murders (per 100,000)
2 (2.5)
1 (1.2)
1 (1.2)
2 (2.5)
0 (0.0)
2 (2.5)
3 (3.7)
1 (1.2)
2 (2.5)
0 (0.0)
1 (1.2)
2 (2.5)
0 (0.0)
0 (0.0)
Rapes (per 100,000)
20 (24.9)
17 (21.1)
18 (22.4)
16 (19.9)
29 (35.9)
20 (24.7)
25 (30.8)
31 (38.2)
26 (32.0)
26 (32.1)
26 (31.9)
28 (34.4)
24 (28.5)
27 (32.8)
Robberies (per 100,000)
37 (46.1)
24 (29.9)
30 (37.4)
34 (42.3)
42 (52.0)
22 (27.2)
21 (25.9)
22 (27.1)
22 (27.0)
23 (28.4)
20 (24.5)
13 (16.0)
17 (20.2)
12 (14.6)
Assaults (per 100,000)
62 (77.3)
74 (92.1)
55 (68.5)
79 (98.4)
75 (92.9)
64 (79.1)
64 (78.8)
70 (86.2)
62 (76.2)
69 (85.1)
80 (98.2)
69 (84.9)
72 (85.6)
59 (71.8)
Burglaries (per 100,000)
415 (517.3)
382 (475.2)
461 (574.2)
391 (486.8)
309 (382.8)
266 (328.8)
240 (295.4)
232 (285.8)
214 (263.1)
159 (196.2)
113 (138.7)
86 (105.8)
79 (93.9)
189 (229.9)
Thefts (per 100,000)
1,467 (1,829)
1,340 (1,667)
1,424 (1,774)
1,363 (1,697)
1,307 (1,619)
1,227 (1,517)
1,084 (1,334)
1,142 (1,407)
943 (1,159)
886 (1,093)
912 (1,119)
687 (844.9)
790 (939.3)
695 (845.4)
Auto thefts (per 100,000)
196 (244.3)
180 (223.9)
159 (198.0)
154 (191.7)
139 (172.2)
102 (126.1)
117 (144.0)
136 (167.6)
91 (111.9)
95 (117.2)
85 (104.3)
87 (107.0)
106 (126.0)
66 (80.3)
Arson (per 100,000)
15 (18.7)
12 (14.9)
14 (17.4)
17 (21.2)
9 (11.1)
4 (4.9)
5 (6.2)
8 (9.9)
10 (12.3)
2 (2.5)
13 (16.0)
12 (14.8)
10 (11.9)
3 (3.6)
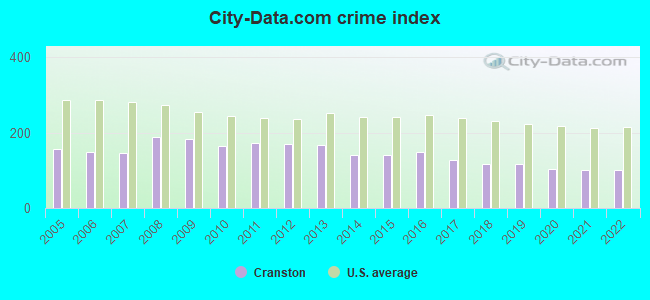
City-Data.com crime index
183.1
164.6
172.3
170.6
168.3
142.5
141.1
148.1
127.6
118.0
117.8
104.0
100.2
101.3
The City-Data.com crime index weighs serious crimes and violent crimes more heavily. Higher means more crime, U.S. average is 246.1. It adjusts for the number of visitors and daily workers commuting into cities.
- means the value is smaller than the state average. - means the value is about the same as the state average.
Latest news from Cranston, RI collected exclusively by city-data.com from local newspapers, TV, and radio stations
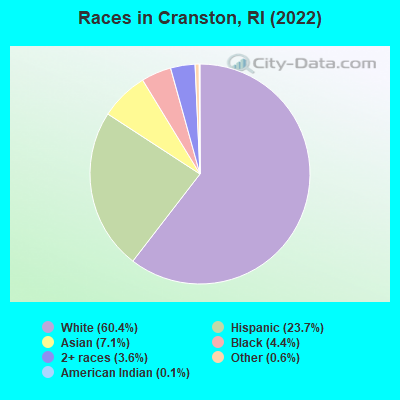
Ancestries: Italian (25.2%), Irish (7.1%), American (5.4%), Portuguese (5.0%), English (3.7%), French Canadian (2.1%).
Current Local Time: EST time zone
Incorporated in 1754
Elevation: 60 feet
Land area: 28.6 square miles.
Population density: 2,885 people per square mile (average).
13,045 residents are foreign born (6.6% Latin America, 4.9% Asia, 2.6% Europe).
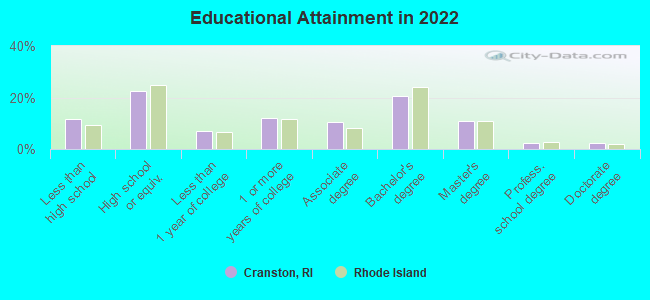
This city:
15.8%
Rhode Island:
14.4%
Median real estate property taxes paid for housing units with mortgages in 2022: $5,138 (1.4%) Median real estate property taxes paid for housing units with no mortgage in 2022: $4,773 (1.4%)
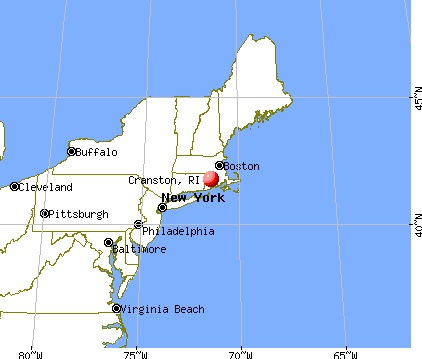
Nearest city with pop. 200,000+: Boston, MA (42.3 miles , pop. 589,141).
Nearest city with pop. 1,000,000+: Bronx, NY (141.1 miles , pop. 1,332,650).
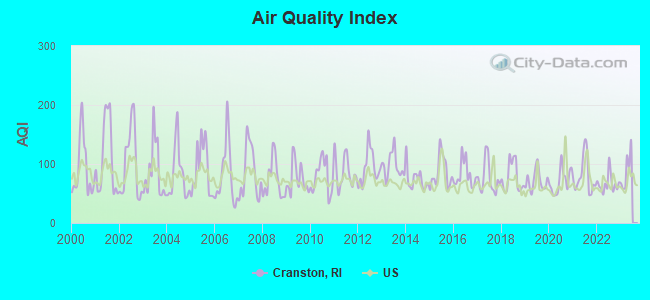
Air Quality Index (AQI) level in 2022 was 66.3. This is about average.
City:
66.3
U.S.:
72.6
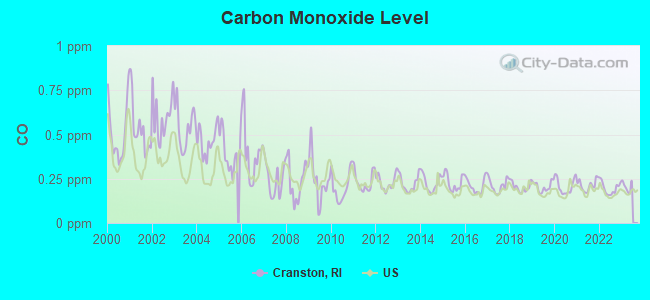
Carbon Monoxide (CO) [ppm] level in 2022 was 0.196. This is better than average.Closest monitor was 3.9 miles away from the city center.
City:
0.196
U.S.:
0.251
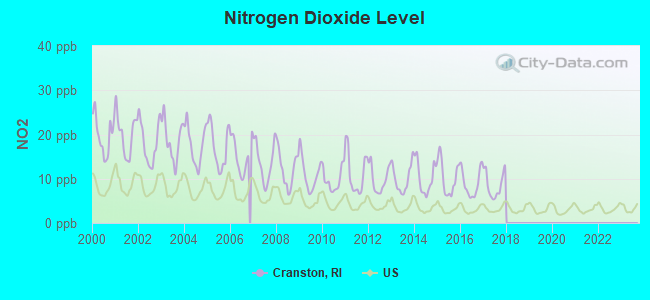
Nitrogen Dioxide (NO2) [ppb] level in 2017 was 8.61. This is significantly worse than average.Closest monitor was 1.2 miles away from the city center.
City:
8.61
U.S.:
5.11
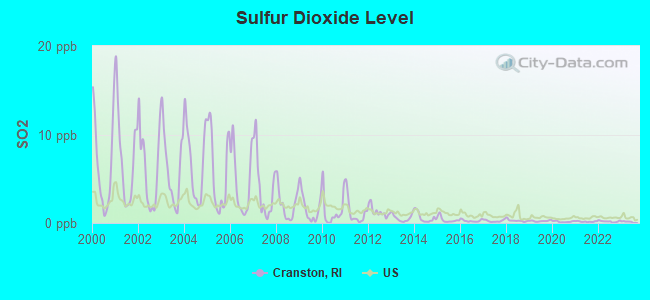
Sulfur Dioxide (SO2) [ppb] level in 2022 was 0.179. This is significantly better than average.Closest monitor was 1.2 miles away from the city center.
City:
0.179
U.S.:
1.515
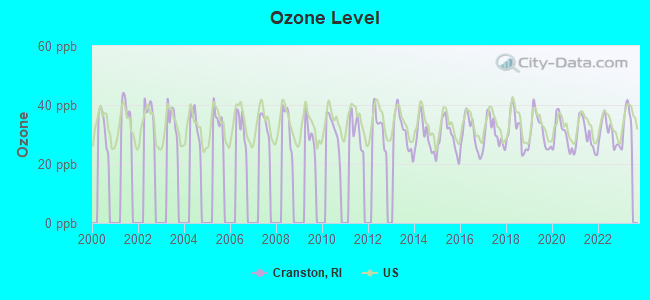
Ozone [ppb] level in 2022 was 30.5. This is about average.Closest monitor was 4.4 miles away from the city center.
City:
30.5
U.S.:
33.3
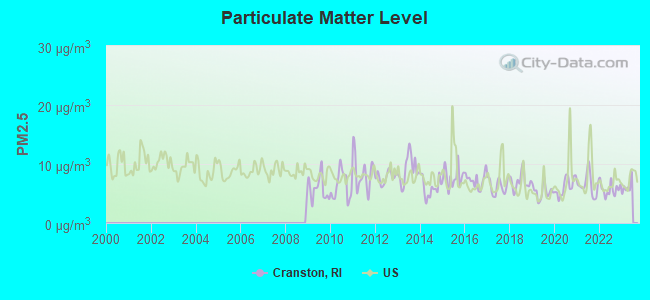
Particulate Matter (PM2.5) [µg/m3] level in 2022 was 5.75. This is significantly better than average.Closest monitor was 3.2 miles away from the city center.
City:
5.75
U.S.:
8.11
Lead (Pb) [µg/m3] level in 2001 was 0.0176. This is significantly worse than average.Closest monitor was 1.2 miles away from the city center.
City:
0.0176
U.S.:
0.0093
Tornado activity:
Cranston-area historical tornado activity is near Rhode Island state average. It is 49% smaller than the overall U.S. average.
On 6/9/1953, a category F4 (max. wind speeds 207-260 mph) tornado 36.6 miles away from the Cranston city center killed 90 peopleand injured 1228 peopleand causedbetween $50,000,000 and $500,000,000 in damages.
On 6/9/1953, a category F3 (max. wind speeds 158-206 mph) tornado 23.2 miles away from the city center injured 17 peopleand causedbetween $500,000 and $5,000,000 in damages.
Earthquake activity:
Cranston-area historical earthquake activity is significantly above Rhode Island state average. It is 73% smaller than the overall U.S. average.
On 10/7/1983 at 10:18:46, a magnitude 5.3 (5.1 MB, 5.3 LG, 5.1 ML, Class: Moderate, Intensity: VI - VII) earthquake occurred 210.2 miles away from the city center On 4/20/2002 at 10:50:47, a magnitude 5.3 (5.3 ML, Depth: 3.0 mi) earthquake occurred 220.7 miles away from Cranston center On 4/20/2002 at 10:50:47, a magnitude 5.2 (5.2 MB, 4.2 MS, 5.2 MW, 5.0 MW) earthquake occurred 219.8 miles away from the city center On 1/19/1982 at 00:14:42, a magnitude 4.7 (4.5 MB, 4.7 MD, 4.5 LG, Class: Light, Intensity: IV - V) earthquake occurred 119.7 miles away from the city center On 10/16/2012 at 23:12:25, a magnitude 4.7 (4.7 ML, Depth: 10.0 mi) earthquake occurred 132.5 miles away from Cranston center On 8/22/1992 at 12:20:32, a magnitude 4.8 (4.8 MB, 3.8 MS, 4.7 LG, Depth: 6.2 mi) earthquake occurred 193.9 miles away from the city center Magnitude types: regional Lg-wave magnitude (LG), body-wave magnitude (MB), duration magnitude (MD), local magnitude (ML), surface-wave magnitude (MS), moment magnitude (MW)
Natural disasters:
The number of natural disasters in Providence County (17) is near the US average (15). Major Disasters (Presidential) Declared: 7 Emergencies Declared: 10
Causes of natural disasters: Hurricanes: 5, Snowstorms: 4, Blizzards: 3, Floods: 2, Storms: 2, Winter Storms: 2, Snow: 1, Snowfall: 1, Tropical Storm: 1, Water Main Break: 1, Wind: 1, Other: 1 (Note: some incidents may be assigned to more than one category).
Hospitals in Cranston:
COMMUNITY HOSPITAL OF RHODE ISLAND (provides emergency services, 1763 BROAD STREET)
ELEANOR SLATER HOSPITAL (BOX 8269)
RIMC-INST OF MENTAL HEALTH (BOX 8281)
Home Health Centers in Cranston:
CEDAR HOME HEALTH, LLC (125 SCITUATE AVENUE)
CONCORD HOME HEALTH SERVICES (30 ROLFE SQUARE)
H AND T MEDICALS INC (1738 BROAD STREET)
HOME CARE ADVANTAGE CHC (165 BURNSIDE ST.)
INTREPID USA HEALTHCARE SVS (1020 PARK AVENUE)
LIFE CARE AT HOME OF RI (63 SOCKANOSSET CROSSROAD)
ST JUDE HOME CARE, INC (445 RESERVOIR AVE)
Nursing Homes in Cranston:
CEDAR CREST NURSING CENTRE INC (125 SCITUATE AVENUE)
CRA-MAR MEADOWS (575 SEVEN MILE ROAD)
SCANDINAVIAN HOME INC (1811 BROAD STREET)
Amtrak station near Cranston:
5 miles: PROVIDENCE (100 GASPEE ST.) . Services: ticket office, fully wheelchair accessible, enclosed waiting area, public restrooms, public payphones, snack bar, ATM, paid short-term parking, paid long-term parking, call for car rental service, taxi stand, public transit connection.
Paul Mitchell the School-Rhode Island (Full-time enrollment: 195; Location: 30 Chapel View Blvd., Suite 100; Private, for-profit; Website: rhodeisland.paulmitchell.edu/)
Toni & Guy Hairdressing Academy-Cranston (Full-time enrollment: 194; Location: 1400 Oaklawn Ave; Private, for-profit; Website: toniguy.com)
Colleges/universities with over 2000 students nearest to Cranston:
Johnson & Wales University-Providence (about 4 miles; Providence, RI; Full-time enrollment: 10,898)
Rhode Island School of Design (about 5 miles; Providence, RI; FT enrollment: 2,714)
Community College of Rhode Island (about 5 miles; Warwick, RI; FT enrollment: 10,500)
Brown University (about 5 miles; Providence, RI; FT enrollment: 8,458)
Rhode Island College (about 5 miles; Providence, RI; FT enrollment: 7,189)
Providence College (about 5 miles; Providence, RI; FT enrollment: 4,312)
New England Institute of Technology (about 9 miles; East Greenwich, RI; FT enrollment: 3,183)
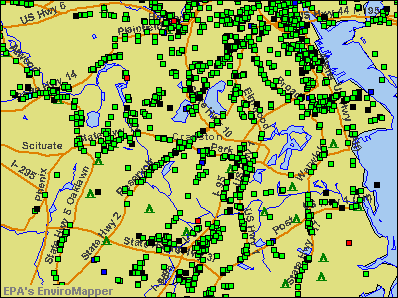
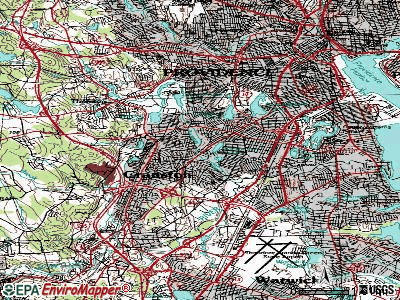
Notable locations in Cranston: Cranston Country Club (A), Edgewood Yacht Club (B), Alpine Country Club (C), Pawtuxet Yacht Club (D), Narragansett Yacht Club (E), Dermksien Orchard (F), Russo Playground (G), Cranston Stadium (H), Pawtuxet Reservation (I), Rhode Island Yacht Club (J), Oak Lawn Branch Cranston Public Library (K), Knightville Meeting House (L), Knightsville Branch Cranston Public Library (M), John Waterman Arnold House (N), Governor Sprague Mansion Museum (O), Diocesan Resource Center Office of Religious Education Library (P), Cranston Public Library (Q), Cranston City Hall (R), Auburn Branch Cranston Public Library (S), Arlington Reading Room Cranston Public Library (T). Display/hide their locations on the map
Shopping Centers: Garden City Center Shopping Center (1), Cohoes Commons Shopping Center (2), Park N Shop Center Shopping Center (3), Reservoir Plaza Shopping Center (4). Display/hide their locations on the map
Churches in Cranston include: Saint Davids Episcopal Church (A), Trinity Episcopal Church (B), Knightsville-Franklin Congregation Church (C), Unification Church of Rhode Island (D), Faith Presbyterian Church (E), Faith Lutheran Brethren Church (F), Church of the Transfiguration (G), Christadelthian Ecclesia (H), First Korean Church (I). Display/hide their locations on the map
Parks in Cranston include: Stillhouse Cove Park (1), Oak Lawn Village Historic District (2), J L Curran Park (3), Pawtuxet State Park (4), Dyer Avenue Playground (5), Meshanticut State Park (6), Fay Memorial Field (7), Salter Grove State Park (8). Display/hide their locations on the map
Tourist attractions: Rhode Island State - Legislative Information- Secretary of State- State Capitol- Lib (Cultural Attractions- Events- & Facilities; 600 New London Avenue) (1), Ocean State Amusements (Amusement & Theme Parks; 60 Webb Street) (2), Mulligans Island (Amusement & Theme Parks; 1000 New London Avenue) (3), Literatour of New England Inc (Tours & Charters; 51 Glen Avenue) (4), Cruise Brothers (Tours & Charters; 950 Wellington Avenue) (5). Display/hide their approximate locations on the map
Birthplace of: Vinny Paz - Boxer, Elisabeth Hasselbeck - Television host, Jack Reed (politician) - Senator, David Quinn (ice hockey) - Ice hockey player, Dennis Wholey - Aemrican game show host, Hugh Duffy - Major League Baseball player, Jack Capuano - Ice hockey player, Joe Exter - Ice Hockey player, Ralph Warburton - Ice hockey player, William Sprague (Rhode Island, 1799–1856) - Governor of Rhode Island.
Providence County has a predicted average indoor radon screening level between 2 and 4 pCi/L (pico curies per liter) - Moderate Potential
Drinking water stations with addresses in Cranston and their reported violations in the past:
ALPINE COUNTRY CLUB (Population served: 200, Groundwater):
Past health violations:
MCL, Monthly (TCR) - Between JUL-2008 and SEP-2008, Contaminant: Coliform. Follow-up actions: St Violation/Reminder Notice (OCT-02-2008), St Boil Water Order (OCT-02-2008), St Formal NOV issued (OCT-02-2008), St Public Notif requested (OCT-02-2008), St Compliance achieved (NOV-11-2008), St Public Notif received (NOV-20-2009)
MCL, Monthly (TCR) - Between JUL-2006 and SEP-2006, Contaminant: Coliform. Follow-up actions: St Violation/Reminder Notice (SEP-06-2006), St Boil Water Order (SEP-06-2006), St Formal NOV issued (SEP-06-2006), St Public Notif requested (SEP-06-2006), St Compliance achieved (SEP-18-2006), St Public Notif received (SEP-18-2006)
Past monitoring violations:
Follow-up Or Routine LCR Tap M/R - In JAN-01-2005, Contaminant: Lead and Copper Rule. Follow-up actions: St Public Notif requested (DEC-21-2007), St Formal NOV issued (DEC-21-2007), St Violation/Reminder Notice (DEC-21-2007), St Compliance achieved (NOV-20-2008), St Public Notif received (NOV-20-2008)
COUNTRY FOOD MART, LLC (Population served: 150, Groundwater):
Past health violations:
MCL, Monthly (TCR) - In MAR-2008, Contaminant: Coliform. Follow-up actions: St Public Notif requested (MAR-31-2008), St Boil Water Order (MAR-31-2008), St Formal NOV issued (MAR-31-2008), St Violation/Reminder Notice (MAR-31-2008), St Compliance achieved (APR-09-2008), St Public Notif received (APR-09-2008), St BCA signed (APR-09-2008)
MCL, Monthly (TCR) - In FEB-2008, Contaminant: Coliform. Follow-up actions: St Public Notif requested (MAR-03-2008), St Boil Water Order (MAR-03-2008), St Formal NOV issued (MAR-03-2008), St Violation/Reminder Notice (MAR-03-2008), St Public Notif received (MAR-17-2008), St Compliance achieved (APR-09-2008), St BCA signed (APR-09-2008)
MCL, Monthly (TCR) - In JAN-2008, Contaminant: Coliform. Follow-up actions: St Public Notif requested (JAN-31-2008), St Boil Water Order (JAN-31-2008), St Formal NOV issued (JAN-31-2008), St Violation/Reminder Notice (JAN-31-2008), St Public Notif received (FEB-04-2008), St Compliance achieved (APR-09-2008), St BCA signed (APR-09-2008)
MCL, Monthly (TCR) - In DEC-2007, Contaminant: Coliform. Follow-up actions: St Boil Water Order (DEC-19-2007), St Public Notif requested (DEC-19-2007), St Formal NOV issued (DEC-19-2007), St Violation/Reminder Notice (DEC-19-2007), St Public Notif received (JAN-16-2008), St BCA signed (APR-09-2008), St Compliance achieved (APR-09-2008)
MCL, Monthly (TCR) - Between OCT-2007 and DEC-2007, Contaminant: Coliform. Follow-up actions: St Boil Water Order (NOV-16-2007), St Formal NOV issued (NOV-16-2007), St Violation/Reminder Notice (NOV-16-2007), St Public Notif requested (NOV-16-2007), St Public Notif received (JAN-16-2008), St BCA signed (APR-09-2008), St Compliance achieved (APR-09-2008)
Drinking water stations with addresses in Cranston that have no violations reported:
BEL-AIR MOTOR INN, INC. (Population served: 30,Primary Water Source Type: Groundwater)
ST. JOSEPH'S CEMETERY (Population served: 25,Primary Water Source Type: Groundwater)
Average household size:
This city:
2.5 people
Rhode Island:
2.4 people
Percentage of family households:
This city:
64.3%
Whole state:
62.8%
Percentage of households with unmarried partners:
This city:
6.7%
Whole state:
7.6%
Likely homosexual households (counted as self-reported same-sex unmarried-partner households)
Lesbian couples: 0.6% of all households
Gay men: 0.5% of all households
People in group quarters in Cranston in 2010:
3,433 people in state prisons
363 people in college/university student housing
224 people in nursing facilities/skilled-nursing facilities
156 people in mental (psychiatric) hospitals and psychiatric units in other hospitals
135 people in correctional facilities intended for juveniles
96 people in group homes intended for adults
43 people in emergency and transitional shelters (with sleeping facilities) for people experiencing homelessness
24 people in residential treatment centers for juveniles (non-correctional)
24 people in in-patient hospice facilities
9 people in residential treatment centers for adults
8 people in group homes for juveniles (non-correctional)
5 people in other noninstitutional facilities
3 people in workers' group living quarters and job corps centers
People in group quarters in Cranston in 2000:
3,252 people in state prisons
309 people in college dormitories (includes college quarters off campus)
242 people in nursing homes
234 people in training schools for juvenile delinquents
162 people in wards in general hospitals for patients who have no usual home elsewhere
156 people in other noninstitutional group quarters
96 people in mental (psychiatric) hospitals or wards
96 people in homes for the mentally retarded
65 people in hospitals/wards and hospices for chronically ill
65 people in other hospitals or wards for chronically ill
21 people in other group homes
13 people in homes or halfway houses for drug/alcohol abuse
10 people in homes for the mentally ill
3 people in religious group quarters
Banks with most branches in Cranston (2011 data):
RBS Citizens, National Association: 11 branches. Info updated 2007/09/19: Bank assets: $106,940.6 mil, Deposits: $75,690.2 mil, headquarters in Providence, RI, positive income, 1135 total offices, Holding Company: Uk Financial Investments Limited
Coastway Community Bank: Cranston Branch, at One Coastway Plaza, Contact Center/Web Branch. Info updated 2009/07/20: Bank assets: $324.2 mil, Deposits: $283.0 mil, local headquarters, positive income, Commercial Lending Specialization, 9 total offices
Bank Rhode Island: Park Avenue Branch, Plainfield Pike Branch, Atwood Avenue Branch. Info updated 2006/09/28: Bank assets: $1,581.1 mil, Deposits: $1,131.1 mil, headquarters in Providence, RI, positive income, Commercial Lending Specialization, 17 total offices, Holding Company: Bancorp Rhode Island, Inc.
Sovereign Bank, National Association: Cranston Branch, Western Cranston Branch, Edgewood Branch. Info updated 2012/01/31: Bank assets: $78,146.9 mil, Deposits: $48,042.9 mil, headquarters in Wilmington, DE, positive income, Commercial Lending Specialization, 718 total offices, Holding Company: Banco Santander, S.A.
Bank of America, National Association: West Cranston Branch, Cranston Branch, Garden City Branch. Info updated 2009/11/18: Bank assets: $1,451,969.3 mil, Deposits: $1,077,176.8 mil, headquarters in Charlotte, NC, positive income, 5782 total offices, Holding Company: Bank Of America Corporation
The Washington Trust Company of Westerly: Oaklawn Branch at 1203 Oaklawn Avenue, branch established on 2007/06/11; Reservoir Avenue Branch at 645 Reservoir Avenue, branch established on 1981/05/26. Info updated 2006/11/03: Bank assets: $3,059.8 mil, Deposits: $2,127.5 mil, headquarters in Westerly, RI, positive income, Commercial Lending Specialization, 19 total offices, Holding Company: Washington Trust Bancorp, Inc.
Webster Bank, National Association: Pontiac Ave Branch at 1155 Pontiac Avenue, branch established on 2009/07/27; Cranston Branch at 1215 Park Ave., branch established on 2004/05/15. Info updated 2008/12/23: Bank assets: $18,674.3 mil, Deposits: $13,861.5 mil, headquarters in Waterbury, CT, positive income, Commercial Lending Specialization, 167 total offices, Holding Company: Webster Financial Corporation
Centreville Savings Bank: Cranston Branch at 193 Comstock Parkway, branch established on 2000/12/11. Info updated 2006/11/03: Bank assets: $965.6 mil, Deposits: $725.3 mil, headquarters in West Warwick, RI, positive income, 6 total offices
Randolph Savings Bank: Cranston Branch at 875 Pontiac Avenue, branch established on 2009/02/09. Info updated 2010/02/02: Bank assets: $383.0 mil, Deposits: $324.9 mil, headquarters in Randolph, MA, positive income, Mortgage Lending Specialization, 7 total offices, Holding Company: Randolph Bancorp
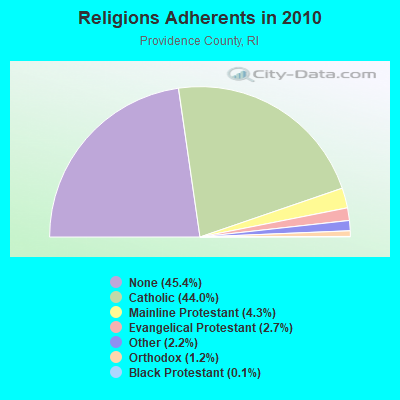
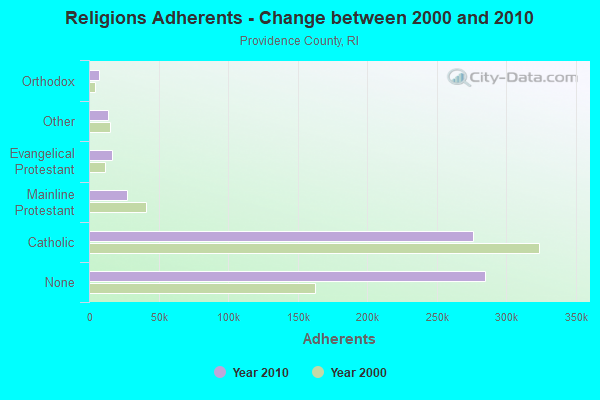
Religion statistics for Cranston, RI (based on Providence County data)
Religion
Adherents
Congregations
Catholic
276,011
98
Mainline Protestant
27,143
111
Evangelical Protestant
16,895
134
Other
13,896
48
Orthodox
7,325
10
Black Protestant
712
9
None
284,685
-
Source: Clifford Grammich, Kirk Hadaway, Richard Houseal, Dale E.Jones, Alexei Krindatch, Richie Stanley and Richard H.Taylor. 2012. 2010 U.S.Religion Census: Religious Congregations & Membership Study. Association of Statisticians of American Religious Bodies. Jones, Dale E., et al. 2002. Congregations and Membership in the United States 2000. Nashville, TN: Glenmary Research Center. Graphs represent county-level data
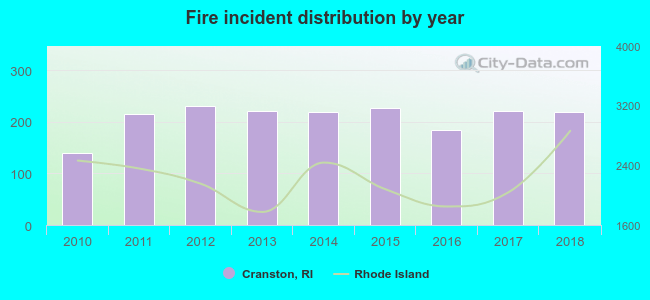
2010 - 2018 National Fire Incident Reporting System (NFIRS) incidents
According to the data from the years 2010 - 2018 the average number of fires per year is 208. The highest number of fire incidents - 231 took place in 2012, and the least - 140 in 2010. The data has an increasing trend.
When looking into fire subcategories, the most incidents belonged to: Outside Fires (43.9%), and Structure Fires (31.3%).
Fire incident types reported to NFIRS in Cranston, RI
#4 on the list of "Top 101 cities with largest percentage of males in occupations: fire fighting and prevention workers including supervisors (population 50,000+)"
#27 on the list of "Top 101 cities with the biggest property tax revenues per resident (population 10,000+)"
#30 on the list of "Top 101 cities with largest percentage of males in occupations: law enforcement workers including supervisors (population 50,000+)"
#33 on the list of "Top 101 cities with largest percentage of males in occupations: legal occupations (population 50,000+)"
#39 on the list of "Top 101 cities with largest percentage of females in occupations: installation, maintenance, and repair occupations (population 50,000+)"
#40 on the list of "Top 101 cities with largest percentage of females in industries: information (population 50,000+)"
#40 on the list of "Top 101 cities with the most residents born in Armenia (population 500+)"
#48 on the list of "Top 101 cities with the largest percentage of high school students in private schools (3,000+ students)"
#53 on the list of "Top 101 cities with largest percentage of males in occupations: installation, maintenance, and repair occupations (population 50,000+)"
#62 on the list of "Top 101 cities with the most residents born in Other Western Europe (population 500+)"
#64 on the list of "Top 101 cities with largest percentage of males in industries: public administration (population 50,000+)"
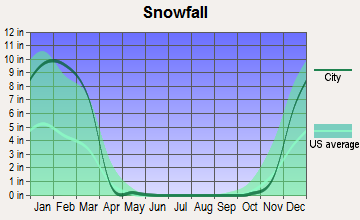
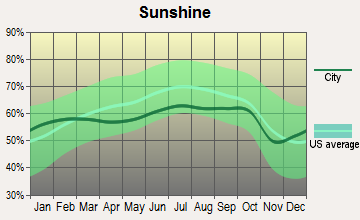
#65 on the list of "Top 101 cities with the lowest maximum monthly sunshine amount (population 50,000+)"
#65 on the list of "Top 101 cities with largest percentage of males in industries: finance and insurance (population 50,000+)"
#70 on the list of "Top 101 cities with the largest percentage of likely lesbian couples (counted as self-reported female-female unmarried-partner households) (population 50,000+)"
#70 on the list of "Top 101 cities with the smallest precipitation differences during a year (population 50,000+)"
#71 on the list of "Top 101 cities with the biggest local government total salary and wages expenses per resident (population 10,000+)"
#72 on the list of "Top 101 cities with largest percentage of males in industries: retail trade (population 50,000+)"
#76 on the list of "Top 101 cities with the largest percentage of likely homosexual households (counted as self-reported same-sex unmarried-partner households) (population 50,000+)"
#79 on the list of "Top 101 cities with largest percentage of females in occupations: education, training, and library occupations (population 50,000+)"
#85 on the list of "Top 101 cities with largest percentage of females in industries: health care and social assistance (population 50,000+)"
#89 (02920) on the list of "Top 101 zip codes with the most beauty salons in 2005"
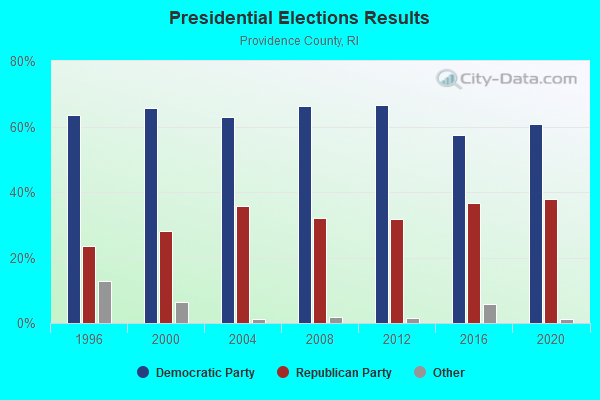
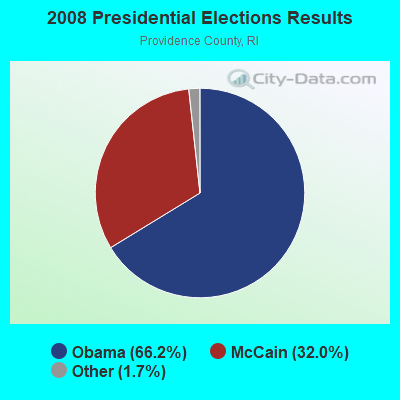
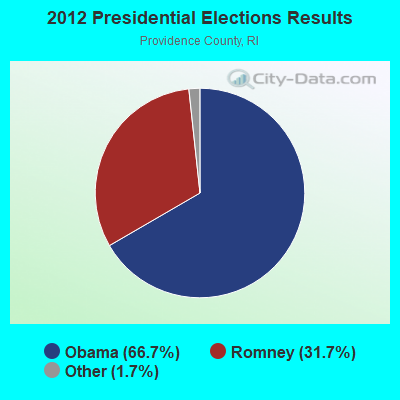
#17 on the list of "Top 101 counties with highest percentage of residents voting for Obama (Democrat) in the 2012 Presidential Election"
#18 on the list of "Top 101 counties with the lowest percentage of residents that keep firearms around their homes"
#20 on the list of "Top 101 counties with the most Catholic congregations"
#38 on the list of "Top 101 counties with the most Orthodox adherents"
#46 on the list of "Top 101 counties with the most Catholic adherents"


 Recent articles from our blog. Our writers, many of them Ph.D. graduates or candidates, create easy-to-read articles on a wide variety of topics.

 (42.3 miles


 According to the data from the years 2010 - 2018 the average number of fires per year is 208. The highest number of fire incidents - 231 took place in 2012, and the least - 140 in 2010. The data has an increasing trend.
 When looking into fire subcategories, the most incidents belonged to: Outside Fires (43.9%), and Structure Fires (31.3%).